Post written by Katherine Pearson
Elections experts Ken Goldstein, Walter Mebane, and Vincent Hutchings analyzed the results and key lessons of the 2018 Midterm Elections at a round table discussion hosted by the Center for Political Studies on November 13, 2018. A recording of the event is available below.
Ken Goldstein, Professor of Politics at the University of San Francisco
Ken Goldstein began his presentation by noting that there are still races that do not have a clear winner a week after the election, including the Senate and Governor’s races in Florida and the Governor’s race in Georgia.
Leading up to the Midterm Elections, some observers anticipated big wins for the Democratic Party. Goldstein observed that while there was a general lack of exuberance on the part of Democrats on election night, further reflection reveals that there were meaningful shifts in this election. Although the “blue wave” of Democratic wins didn’t materialize, the number of congressional seats changing away from the President’s party was of similar magnitude to past midterm elections.
Goldstein drew attention to the behavior of independent voters. Exit poll data show that independents favored Republican candidates for the House of Representatives in the past two midterm elections, as well as the 2016 General Election. In contrast, independent voters were more likely to vote for Democratic House candidates in 2018 by a margin of 12 percentage points.

Were the polls leading up to the election predictive of the actual outcome? Goldstein said they were fairly accurate, but reminded the audience that many congressional seats were not in play in this election. There are few high-quality state-level polls, which makes forecasting less accurate. More probability-based surveys that weight responses for education and race of the respondent would improve the accuracy of predictions.
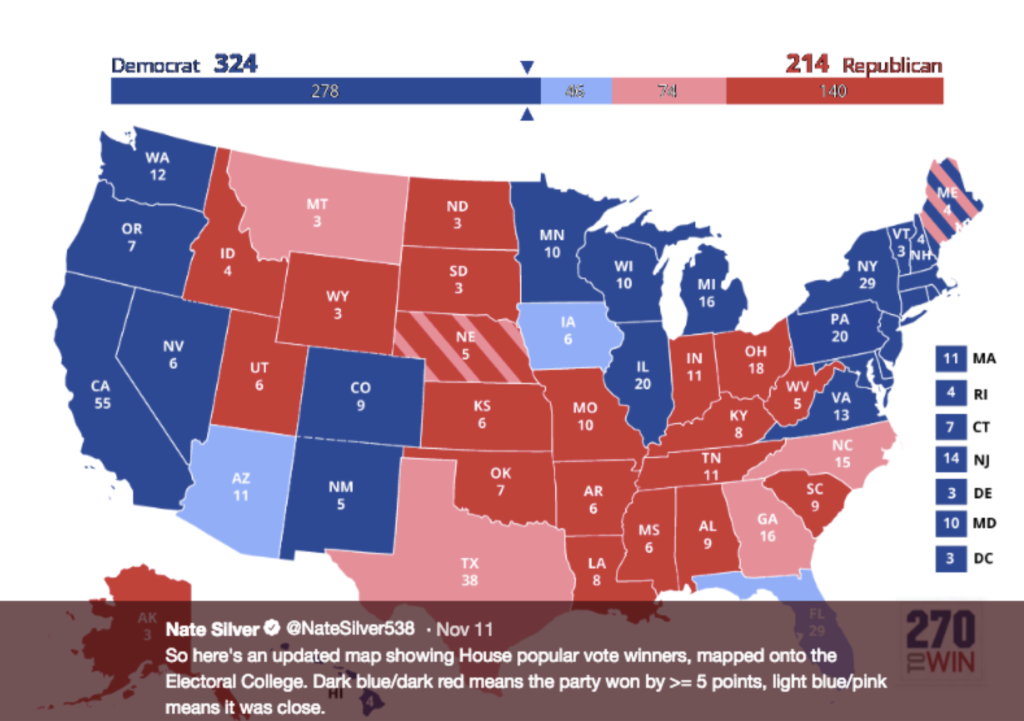
Looking at the big picture trends, Goldstein observed that there was a substantial increase in the number of women running for office and winning, as well as large increases in non-white voters. He shared a map showing what the results of the presidential election would look if votes followed the same partisan break-down as the 2018 midterms. However, Goldstein cautioned that presidential campaigns are very different from congressional campaigns, and that a presidential candidate running a nation-wide campaign will face challenges in changing districts, especially in the Midwest.
Walter Mebane, Professor of Political Science and Statistics at the University of Michigan
Next, Walter Mebane presented analyses he has conducted using election forensics. Mebane coined the term “election forensics” to describe a set of statistical methods he developed to determine whether the results of an election accurately reflect the intentions of the electors.
Using Twitter data from the 2016 General Election Mebane analyzed reports of election incidents, including wait times and problems with voting. During the 2016 General Election people used Twitter to report different kinds of election incidents depending on their partisan affiliation. These incidents tended to be reported in replies to people with similar partisan affiliations.
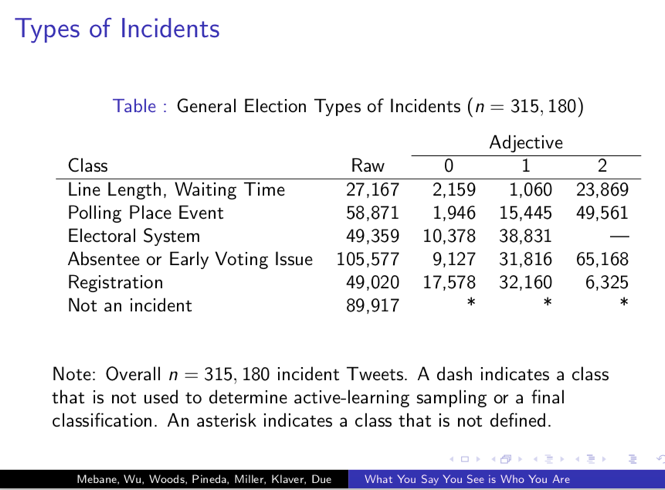
Mebane discovered that there are partisan differences in the types of incidents that Twitter users shared during the 2016 General Election. For example, Republicans were less likely to report a long line to vote, but more likely to report registration problems. A significant conclusion from this finding is that such observational biases and communication silos suggest partisans tended to form different impressions of how the 2016 election went, supported by the divergent reported experiences. These patterns will probably continue in 2018, according to Mebane.
Vincent Hutchings, Professor of Political Science at the University of Michigan
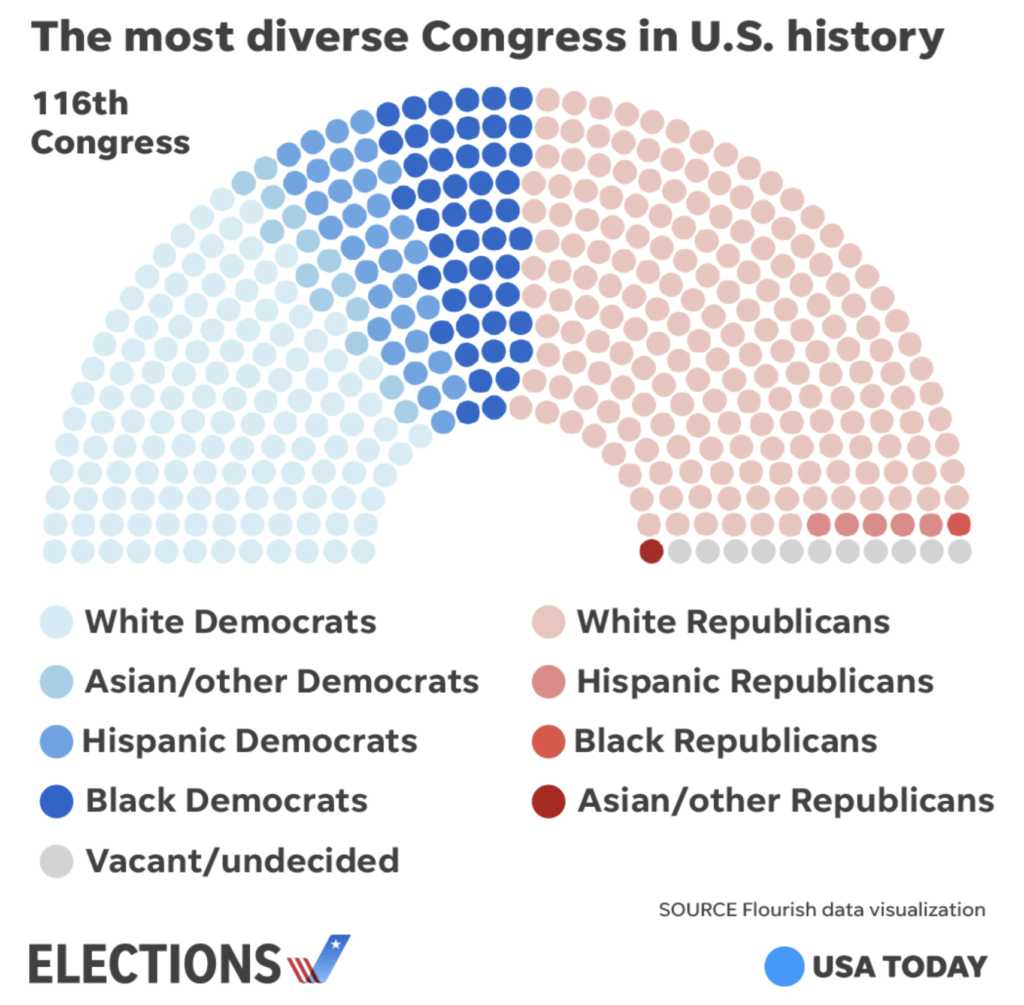
Vincent Hutchings analyzed the shifting demographics of the American electorate. Hutchings presented data showing that Democratic voters have become more racially diverse in the past 20 years, while Republican voters have remained predominately white. Similarly, the Congress elected in 2018 is the most diverse in the history of the United States, but the increase in diversity has been primarily among Democrats elected to Congress.
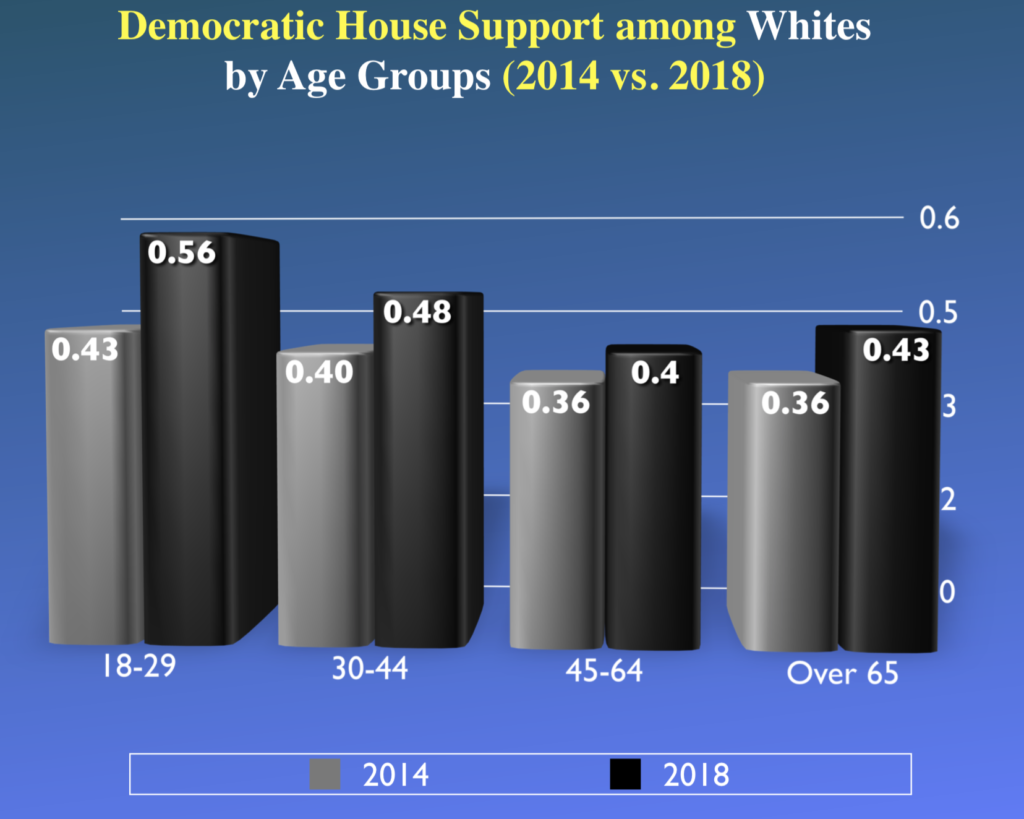
Reviewing voting data by race, gender, age, marital status, and education, Hutchings notes that each demographic group voted for Democrats at a higher rate than they did in the 2014 Midterm Elections. However, the magnitude of change was different for each group.
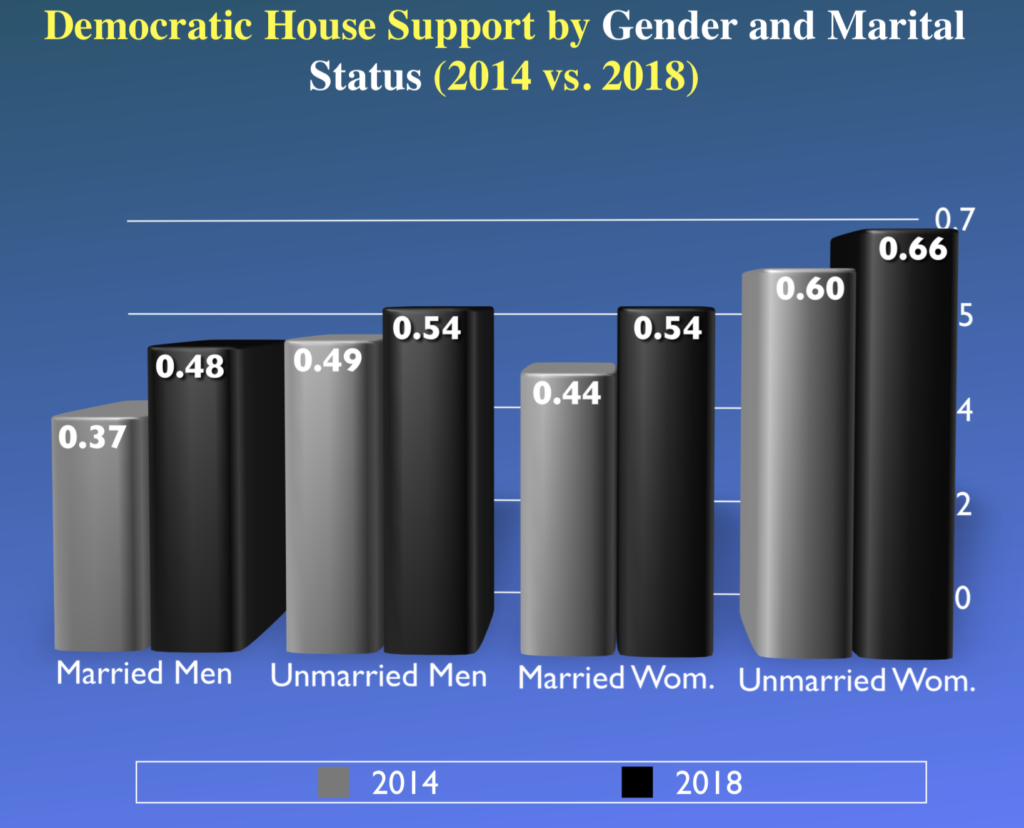
Some elections experts wondered whether women would vote for Democrats at higher rates in 2018 in response to the #MeToo movement, the contentious confirmation of Justice Kavanaugh, and controversial remarks about women made by President Trump. Hutchings showed that, among white voters, men and women both shifted toward Democratic candidates, but the gender gap didn’t change. Married men and married women both moved toward the Democratic Party House candidates at roughly equal rates in 2018 compared to 2014. No matter how Hutchings examined gender, he found no evidence that white women behaved differently than comparable men, relative to their preferences four years ago.
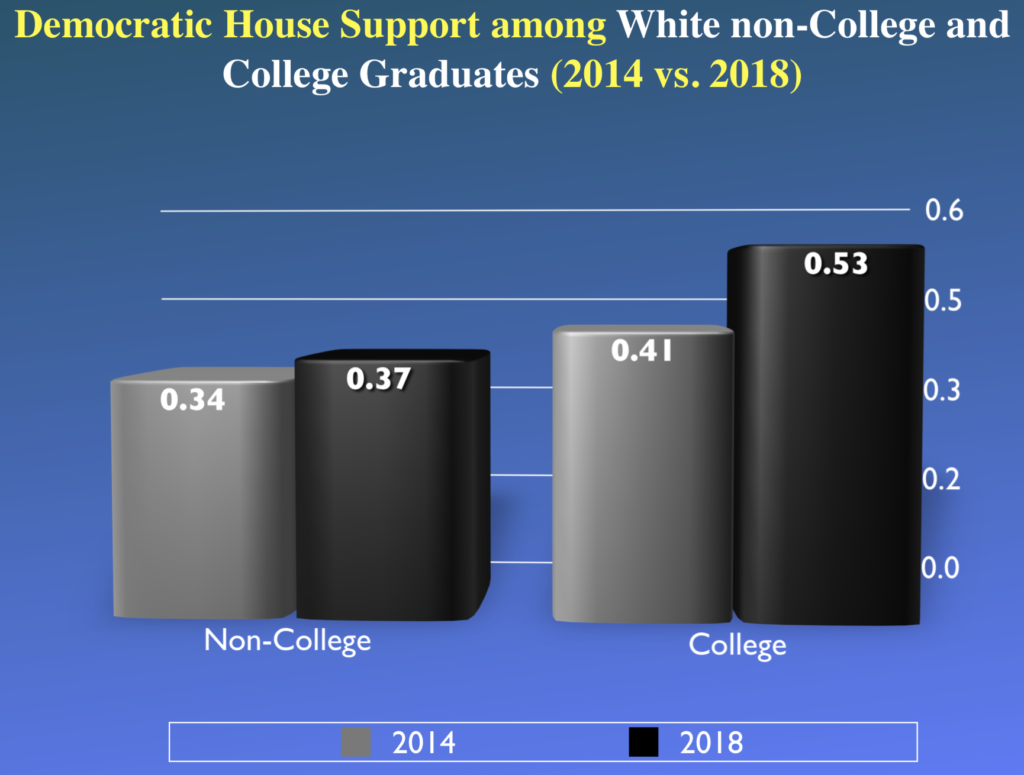
Similarly, Hutchings observed meaningful trends related to generation and education. Voters under 30 years old voted for Democrats at a higher rate than voters under 30 in 2014. Democrats also increased gains among college-educated white voters compared to the 2014 Midterm Elections. Hutchings concluded that, while media may focus on gender differences between Democratic and Republican voters, more important differences are emerging along generational and educational lines, and these are trends to watch