
Developed by Katie Brown in coordination with Robert Franzese
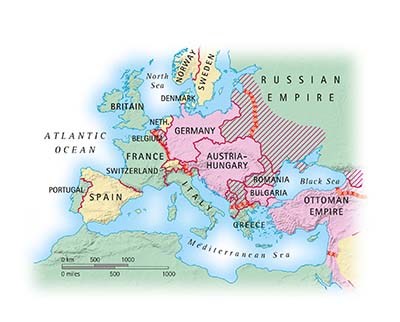 The map to the left shows Europe during World War I, including Italy and Romania. Can a graph illustrate how Italy’s decision to enter the war influenced Romania’s decision to do so?
Social scientists seek to understand social, political, and psychological phenomena. Quantitative research methods used by scientists can help investigate what factors cause specific outcomes (effects). Often, however, a factor in one unit causes an outcome in that unit, and that outcome then becomes a factor that causes outcomes in other units. Center for Political Studies (CPS) researcher and Professor of Political Science Robert Franzese, along with his coauthor and former member of CPS Jude Hays, has been studying ways to understand the relationships not just between cause and effect in one unit, but between causes and effects across multiple units, over time. That is, how to identify and estimate what is called spatial and spatiotemporal interdependence.
Franzese, along with Hays and their colleague Lena Schaeffer, presented a paper at the annual meeting of the American Political Science Association (APSA) that outlines the shortcomings of most approaches to the connection between causes and effects across multiple units over time. Then, the paper highlights some more promising models.
To illustrate how these more promising models work, let’s consider a specific application: investigating the decision of nations to enter World War I. This decision depends not only on domestic and international structural factors, but also on the decision of other nations to enter the war.
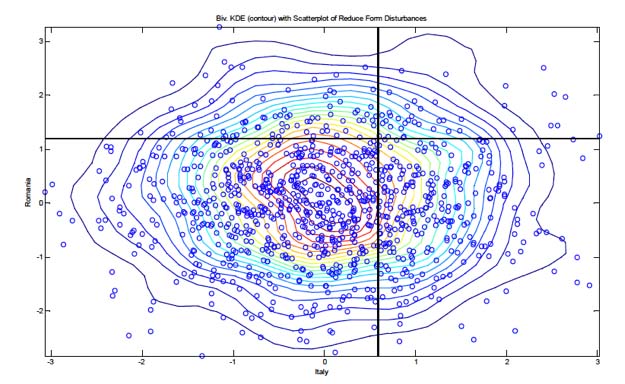
With this in mind, how did Italy’s decision to enter World War I influence Romania’s decision to do so? The below graph shows a simulation of 1,000 different possible outcomes (as dots on the graph), using Franzese’s model. From the set of simulations on the graph, we learn that when Italy joins the war (as indicated by the number of dots which appear to the right of the vertical cutoff line), Romania also joins the war 15.6% of the time (as indicated by the number of dots which appear above the horizontal cutoff line). Furthermore, when Italy does not join the war, Romania still joins the war 12.3% of the time. The difference between these two numbers – 3.3% – is thus the the impact of Italy’s decision to enter the war on Romania’s decision to enter the war.
This simulation is just one illustration of an application of spatiotemporal interdependence. Models such as these can help social scientists understand a variety of scenarios where interdependence occurs, with some of many other examples being:
- the relationship between the votes of legislators, the votes of citizens, and election results;
- the outcomes of coups, revolutions, and riots; and
- the entry of countries into treaties or alliances.