Election forensics is the field devoted to using statistical methods to determine whether the results of an election accurately reflect the intentions of the electors. Problems in elections that are not due to fraud may stem from legal or administrative decisions. Some examples of concerns that may distort turnout or vote choice data are long wait times, crowded polling place conditions, bad ballot design and location of polling stations relative to population.
A key component of democratic elections is the actual, and perceived, legitimacy of the process. Individuals’ observations about how elections proceed can provide valuable, on-the-ground insight into any flaws in the administration of the election. In some countries there are robust systems for recording citizen complaints, but not in the United States. So, a team* of University of Michigan researchers led by Walter Mebane used Twitter to extract observations of election incidents by individuals across the United States throughout the 2016 election, including primaries, caucuses and the general election. Through their observations, the team shows how reported phenomena like waiting in long lines or having difficulties actually casting a vote are associated with state-level election procedures and demographic variables.
The information gathered is the beginnings of what Mebane is calling the “Twitter Election Observatory.” The researchers collected tweets falling within a ten-day window around each primary/caucus election day and collected tweets continually during the October 1- November 9, 2016 lead up to the general election.
Mebane and his team then coded all of the tweets to extract the “incident observations” — tweets that mentioned an issue or complaint that an individual may have experienced when casting their vote. From the Twitter data, the researchers found that incidents occurred in every state during the general election period. Among the tweets that had recorded location information, the highest count of tweet observations occurred in California, Texas, Florida and New York and the smallest amount in Wyoming, North Dakota, South Dakota and Montana.
Additionally, the researchers calculated the rate of incidents relative to the population of the each state. On a per capita basis, the District of Columbia stands out with the highest rate of incident observation followed by Nevada and North Carolina with Wyoming as the lowest.
Every indication is that Twitter can be used to develop data about individuals’ observations of how American elections are conducted, data that cover the entire country with extensive and intensive local detail. Mebane notes that the frequency, and likely the diversity, of observations may vary depending on how many people care and want to participate in, observe and comment on an election. Ultimately, Mebane would like to dig further into the geolocation information of these tweets to try and pinpoint any incidents with exact polling locations.
Earlier this year, the National Academy of Sciences (NAS) announced the election of the Institute for Social Research’s Donald Kinder, the only University of Michigan professor to be named in 2017 and the 28th professor to be named in U-M’s history. Established by Congress in 1863, the private, non-profit NAS promotes science through its consortium of more than 2,000 distinguished scholars, of which nearly 500 have won Nobel Prizes. NAS serves as an independent advising entity to the government, and provides recommendations and guidance on matters of scientific or technological importance to the nation.
Donald Kinder
“It is a thrilling surprise to be elected to the National Academy of Sciences,” says Kinder. “I was very pleased when I received the call about my election, and I look forward to working with members on a variety of new projects.” As a member, Kinder will attend NAS membership meetings and help review papers for the multidisciplinary journal, Proceedings of the National Academy of Sciences, as well as provide his expertise on subject-related projects or efforts.
Kinder, a Research Professor at ISR’s Center for Political Studies, is notable for his research on prejudice and how it impacts contemporary American politics. “Most of my work over the last 20 years has focused on racial politics in the United States, as I’ve tried to understand the foundations of public opinion and the role that race plays in elections,” says Kinder. “This area of study has been a long-standing interest of mine that actually started in graduate school. I was in a specific time in a specific place at UCLA in the early 1970s and I became interested in how white suburban voters were affected by the racial identity of one of the mayoral candidates.”
More recently, Kinder’s work has revolved around ideology in the study of American politics and his newest book, Neither Liberal Nor Conservative, debuted in May. “This book is about American politics and how American elites seem highly ideological yet most American citizens are not,” says Kinder. “This is a condition that has been present over the past 50-60 years. In some ways, it’s a surprising argument to make because people who study politics and think about politics usually make the presumption that ordinary people think deeply about politics, too. But the reality is that regular citizens have better things to do with their lives and, as a consequence of that, their thinking is more casual and less organized and certainly less ideological.” The book, written with Louisiana State University professor, and U-M grad, Nathan Kalmoe has received several long-form journalism reviews including in VOX and Washington Monthly.
As Kinder reflects on both his current work and his new election to NAS, he says, “I’ve been at U-M for going on 40 years and what I love about the place is the endless parade of super smart graduate students who come through. I think of my election to the National Academy of Sciences as a reflection of this remarkable place, my great colleagues and wonderful students.”
Post developed by Mara Ostfeld and Catherine Allen-West
The effectiveness of America’s system of democratic representation, in practice, turns on broad participation. Yet only about 60 percent of voting eligible Americans cast their vote in presidential elections. This number is nearly cut in half in off-year elections (about 36 percent), and participation in local elections is even lower. This lack of electoral engagement does not fall equally across racial and ethnic subgroups. Latinos, for one, are particularly underrepresented at polling booths across the country. In 2016, eligible Latino voters were about 20 percentage points less likely to vote than their White counterparts, and about 13 percentage points less likely to vote than their Black counterparts.
This fall, a group of 24 University of Michigan undergraduate students sought to explore this disparity and pinpoint what, if anything, works to increase Latino political participation. In the class, entitled The Politics of Latinidad, CPS Faculty Associate and U-M Political Science ProfessorMara Ostfeld taught her students how to measure public opinion and challenged them to analyze the factors that affect Latino political participation.
Today, more than 50,000 Latinos live in Detroit and a majority of them reside in City Council District 6 in Southwest Detroit which is precisely where this course focused. The students began by studying the history of Latinos in Southeast Michigan and exploring how Latinos played critical roles in the city’s development dating back to before World War I. They analyzed broad trends in Latino public opinion, and considered how and why these patterns might be similar or different in Detroit. Students then designed their own pre-election polls to take into the field.
In order to understand what affects voter turnout, students surveyed over 300 residents of Southwest Detroit to measure the issues that were most important to them.
Students pictured here: Storm Boehlke, Mohamad Zawahra, Alex Tabet , Hannel So, Sion Lee.
The results illustrate some powerful patterns. Among the issues that the residents found most important, immigration and crime stood out. Forty-nine and 45 percent of Latinos listed immigration and crime, respectively, as issues of particular concern, with only 31 percent of residents saying that they felt safe in their own home.
Latinos in Southwest Detroit feel extremely high levels of discrimination. Seventy percent of Latinos surveyed said they felt Latinos face “a great deal” of discrimination. This significantly exceeds the roughly half of Latinos nationwide who say they have experienced discrimination.
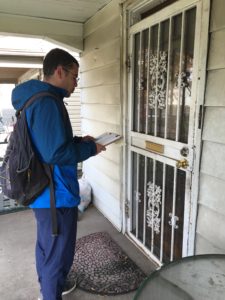
Student Alex Garcia visits residents in Detroit.
Local issues were also at the forefront of residents’ minds. Latinos had mixed views on the city’s use of blight tickets to combat housing code violations, with one third of respondents supporting them and one third opposing them.
As local organizations, like Michigan United, continue trying to get a paid sick leave initiative on the ballot in 2018, they can expect strong support among Latinos in Southwest Detroit. About two out of every three Latinos in the area indicated they would be more likely to support a candidate who supports the paid sick leave requirement.
The students then followed up with the residents a month later to see if they planned to vote in the upcoming city council election. At this point, the students implemented some interventions that have been used to increase political participation like, evoking emotions that have been shown to have a mobilizing effect, framing voting as an important social norm, and speaking with voters immediately before an election. With the election now over, students are back in the classroom analyzing the effectiveness of these interventions and will use their first-hand experience to better understand public opinion and political participation.
The initial release of the 2016 American National Election Studies (ANES) Time Series dataset is approaching. Since 1948, the ANES- a collaborative project between the University of Michigan and Stanford University- has conducted benchmark election surveys on voting, public opinion, and political participation. This year’s polarizing election warranted especially interesting responses. Shanto Iyengar, one of the project’s principal investigators and Stanford professor of political science, noted, “The data will tell us the extent to which Trump and Clinton voters inhabit distinct psychological worlds.”
To learn more about the study, we asked Ted Brader (University of Michigan professor of political science and one of the project’s principal investigators) a few questions about this year’s anticipated release.
When was the data collected?
The study interviewed respondents in a pre-election survey between September 7 and November 7, 2016. Election day was November 8. The study re-interviewed as many as possible of the same respondents in a post-election survey between November 9 and January 8, 2017.
The ANES conducted face-to-face and internet interviews again for 2016. How are these samples different from 2012? What are the sample sizes and the response rates?
The study has two independently drawn probability samples that describe approximately the same population. The target population for the face-to-face mode was 222.6 million U.S. citizens age 18 or older living in the 48 contiguous states and the District of Columbia, and the target population for the Internet mode was 224.1 million U.S. citizens age 18 or older living in the 50 U.S. states or the District of Columbia. In both modes, the sampling frame was lists of residential addresses where mail is delivered, and to be eligible to participate, a respondent had to reside at the sampled address and be a U.S. citizen age 18 or older at the time of recruitment.
The response rate, using the American Association for Public Opinion Research (AAPOR) formula for the minimum response rate on the pre-election interview, was 50 percent for the face-to-face component and 44 percent for the Internet component. The response rate for the face-to-face component is weighted to account for subsampling during data collection; due to subsampling for the face-to-face mode, the unweighted response rate would not be meaningful.
Photo Credit: Mark Newman (University of Michigan)
The re-interview rate on the post-election survey was 90 percent for the face-to-face component and 84 percent for the Internet component.
Are there any other aspects of the design that you think are particularly important?
I’d emphasize the effort to collect high quality samples via both in-person and online interviews for the whole survey as obviously the most important design aspect of the 2016 study, helping us to learn more about the trade-offs between survey mode and potential benefits of mixed mode data collection.
Are there any new questions that you think users will be particularly interested in?
Along with many previous questions that allow researchers to look at short and long term trends, we have lots of new items related to trade, outsourcing, immigration, policing, political correctness, LGBT issues, gender issues, social mobility, economic inequality, campaign finance, and international affairs.
What do you think some of the biggest challenges were for the 2016 data collection?
With increasing levels of polarization and a highly negative campaign, some Americans were much more resistant to participating in the survey. Many seemed to feel alienated, distrustful, and sick of the election. Under these circumstances, we worked hard with our partners at Westat to overcome this reluctance and are pleased to have recruited such a high quality sample by Election Day.
What are you most excited about when you think of the 2016 ANES?
The 2016 contest was in many ways a particularly fascinating election, even for those of us who usually find elections interesting! The election ultimately centered on two highly polarizing candidates, and people of many different backgrounds felt a lot was at stake in the outcome. Thus, not surprisingly, there was energetic speculation throughout the year about what voters were thinking and why they supported Clinton or Trump. The 2016 ANES survey provides an incredibly rich and unparalleled set of data for examining and testing among these speculations. I expect it will take some time to arrive at definitive answers, but I’m excited to release this wealth of evidence so the search for the truth can begin in earnest.
Is there anything else you’d like to share?
I would note that future releases will include redacted open-ended comments by respondents, numerical codings of some of the open-ended answers, and administrative data (e.g., interviewer observations, timing, etc.).
If Rick Snyder weren’t the Governor of Michigan, Donald Trump would probably have 16 fewer electoral votes. I say this not because I think Governor Snyder did anything improper, but because Michigan law provides a small electoral benefit to the Governor’s party in all statewide elections; candidates from that party are listed first on the ballot.
Yesterday, Donald Trump was declared the winner in Michigan by a mere 10,704 votes, out of nearly 5 million presidential votes cast. Although this is not the smallest state margin in recent history – President Bush won Florida and the election by 537 votes and Al Franken won his senate seat in Minnesota by 225 (after the result flipped in a recount) – it represented a margin of 0.22%. The best estimate of the effect of being listed first on the ballot in a presidential election is an improvement of the first-listed individual’s vote share of 0.31%. Thus, we would expect Hillary Clinton to have won Michigan by 0.4% if she were listed first and about 0.09% if neither candidate were consistently listed in the first position.
It may seem surprising to suggest that anyone’s presidential vote would hinge on the order of candidates’ names, but the evidence is strong. In a paper I published with colleagues in Public Opinion Quarterly in 2014, we looked at name order effects across 76 contests in California – one of the few states that rotates the order of candidates on the ballot – to estimate the size of this benefit. We later replicated the results in a study of North Dakota. Both times, we found that first-listed candidates received a benefit and that the effect was present, though smaller, at the presidential level.
There are many reasons that voters might choose the first name, even if they started their ballots without a predetermined presidential candidate. Some individuals might have been truly ambivalent and selected the first name they had heard of (in this case, “Trump”), others may have instead checked the first straight party box – listed in a similar order – without intending to select our new President-elect. Regardless of the cognitive mechanisms involved, the end result is clear – the “will” of the voters can be diverted by seemingly innocuous features of ballot design.
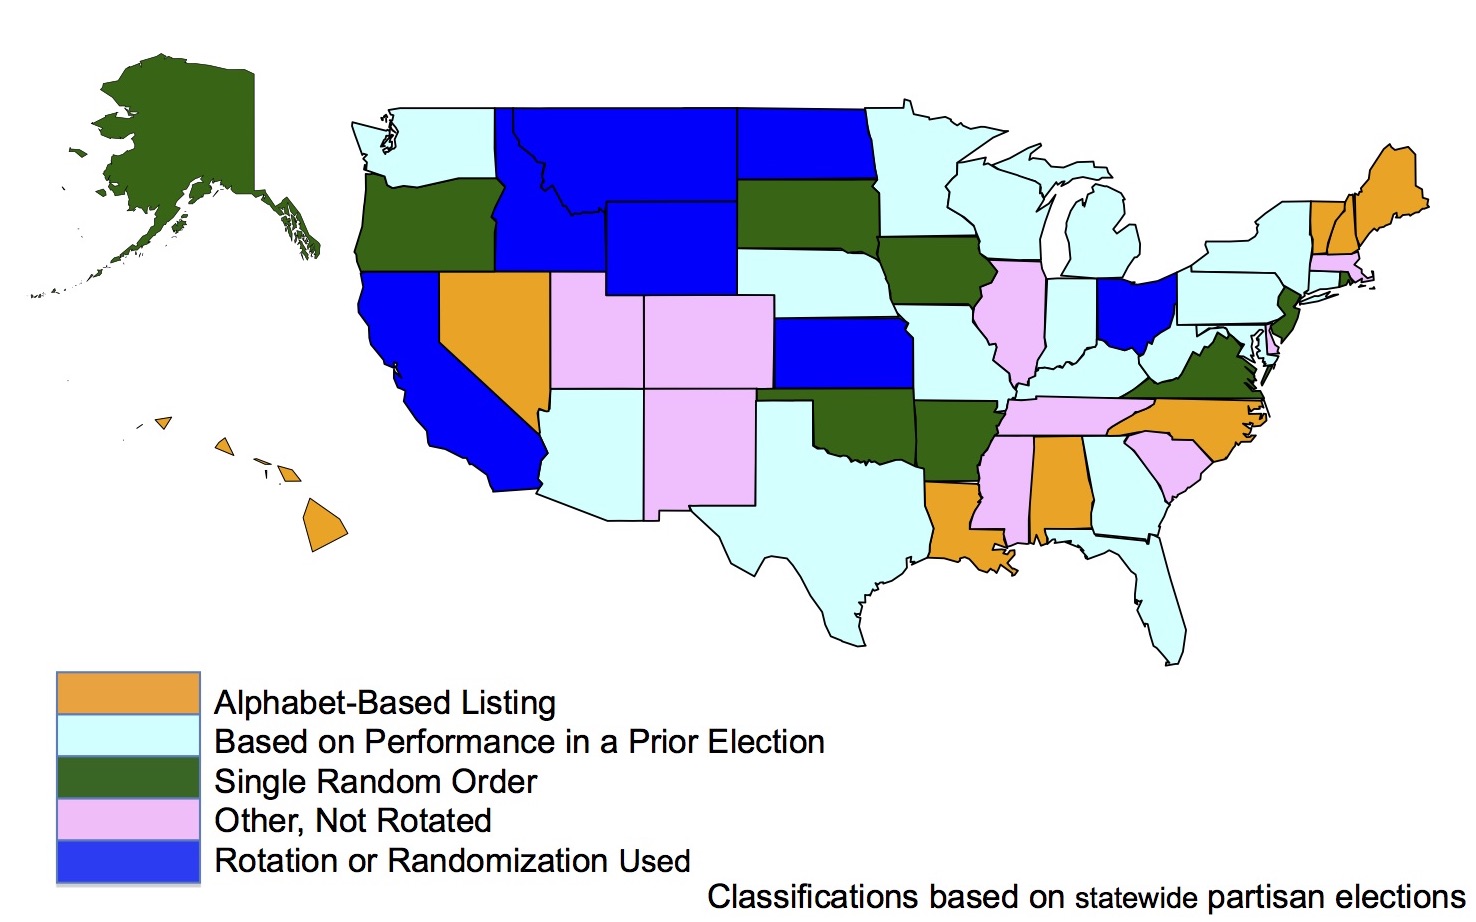
How broadly is this first-position benefit a problem? Across the country, only seven states vary the order of candidate names across precincts. Another nine choose a single random order for listing candidates in each contest, but use that same order across the entire state. And the rest generally use some combination of alphabetic ordering or a listing based on who won in prior elections at the state level. Michigan’s system – prioritizing the candidate who last won the Governor’s office – is among the most common methods.
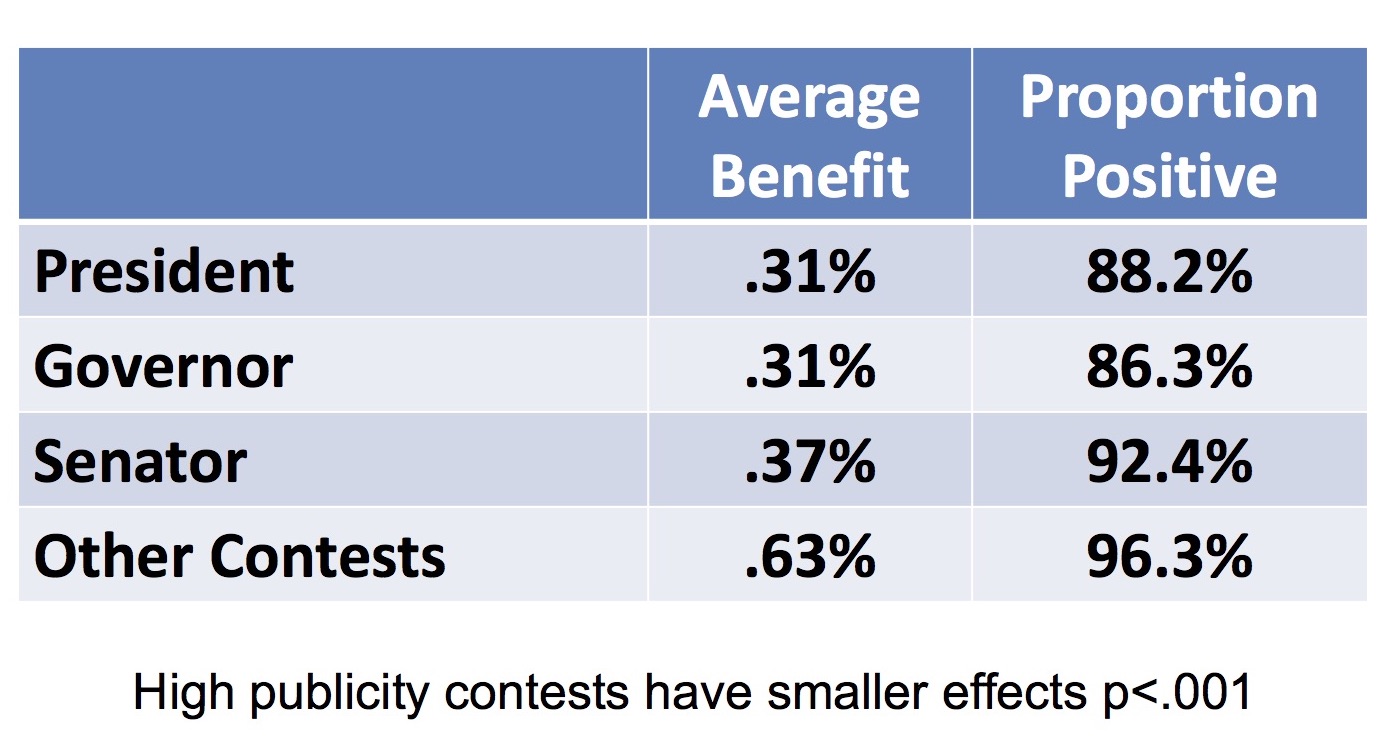
Given the control that Republicans currently hold over governorships, this bias likely helps Republicans maintain their dominance over many state legislatures. And the effects of being listed first only grow as you move down the ballot. In our study of California, we found the average benefit for a Governor was also 0.31 percent*, Senators gained 0.37 percentage points of additional votes, and candidates for other statewide offices gained an average of 0.63 percentage points.
Source: Prevalence and moderators of the candidate name-order effect evidence from statewide general elections in California Pasek J., Schneider D., Krosnick J.A., Tahk A., Ophir E., Milligan C. (2014) Public Opinion Quarterly, 78 (2) , pp. 416-439.
For a better answer, we might look to the strategy adopted by Michigan’s neighbor to the South. Ohio produces a unique ballot for each precinct where the ordering of candidates’ names is rotated. Although it is too late to prevent this effect from altering the 2016 election, it may have less of an impact if everyone were not filling out ballots with the same candidates listed first.
*this would likely be larger if California did not elect its Governors in non-presidential years.
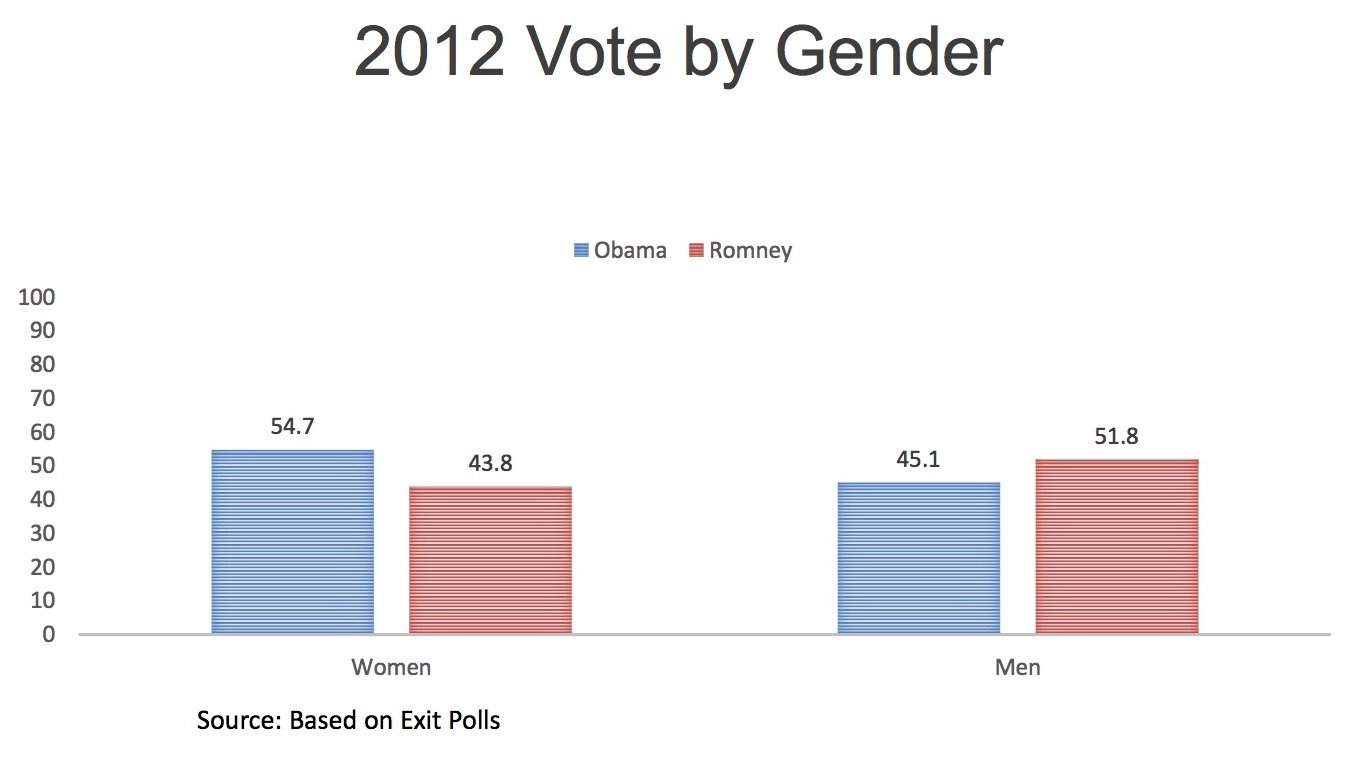
As of October, the latest national polls, predicted that the 2016 Election results will reflect the largest gender gap in vote choice in modern U.S. history. Today, according to NPR, “An average of three recent national polls shows that women prefer Clinton by roughly 13 points, while men prefer Trump by 12, totaling a 25-point gap.” If these polls prove true, the 2016 results would indicate a much larger gender gap than what was observed in 2012, where women overwhelmingly supported Barack Obama over Mitt Romney.
2012 vote by gender based on national exit poll conducted by Edison Media Research.
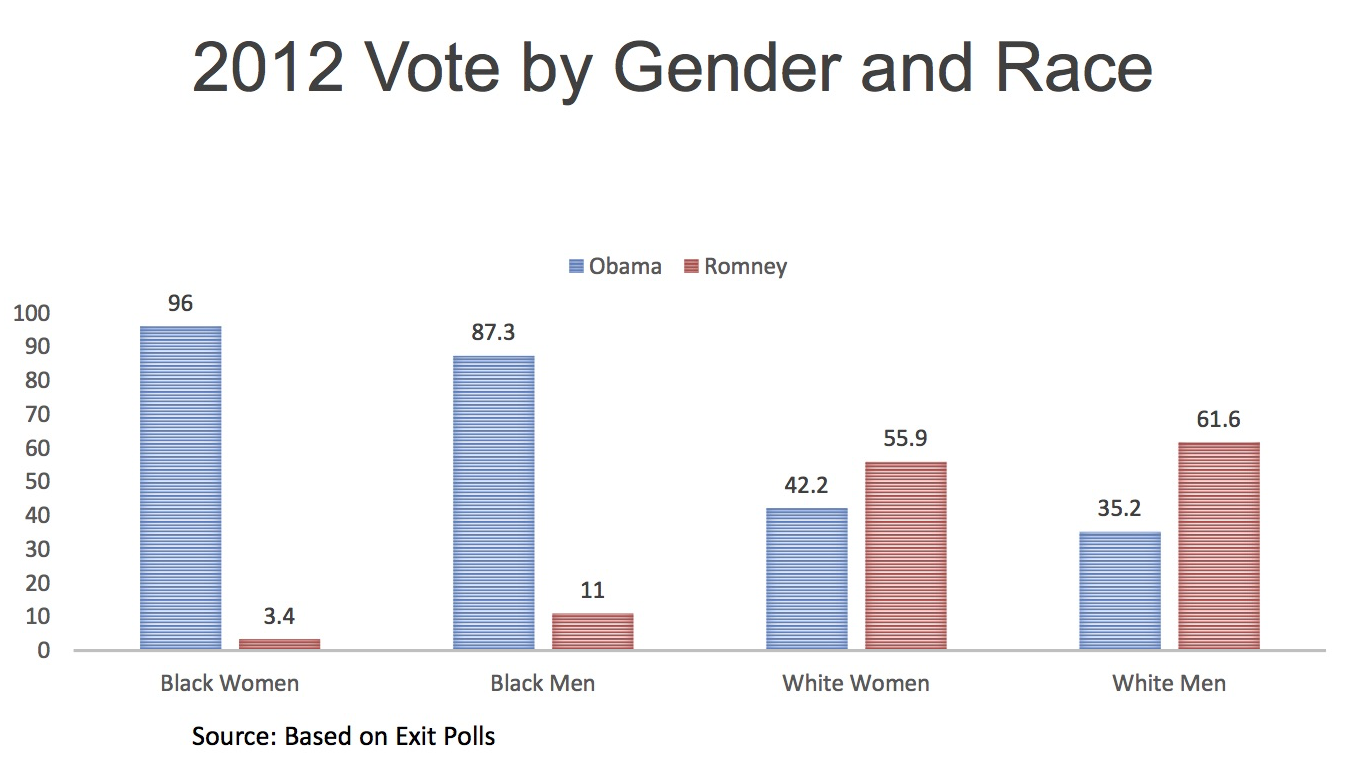
University of Texas at Austin Professor Tasha Philpot argues that what really may be driving this gap to even greater depths, is race. For instance, here’s the same data from the 2012 Election, broken down by gender and race.
2012 vote by gender and race based on national exit poll conducted by Edison Media Research.
Often overlooked in the discussion of the gender gap, race figures prominently into many American’s political identities.
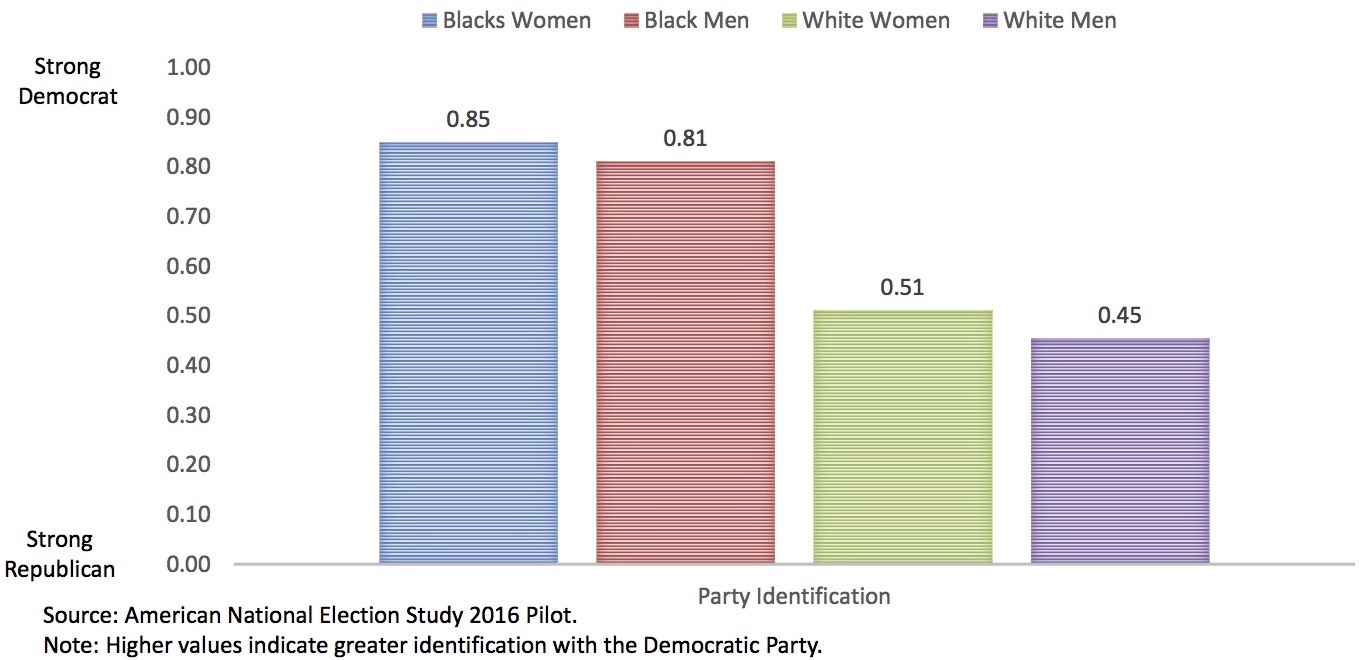
2016 Gender Gap in Party Identification
2016 Gender Gap in Party Identification.
Philpot recently participated in the panel “What We Know So Far About the 2016 Elections” at the University of Michigan’s Center for Political Studies. In her talk, “Race and the Gender Gap in the 2016 Election,” Philpot outlined the potential sources for the gender gap and emphasized the role that race is playing in widening the gap.
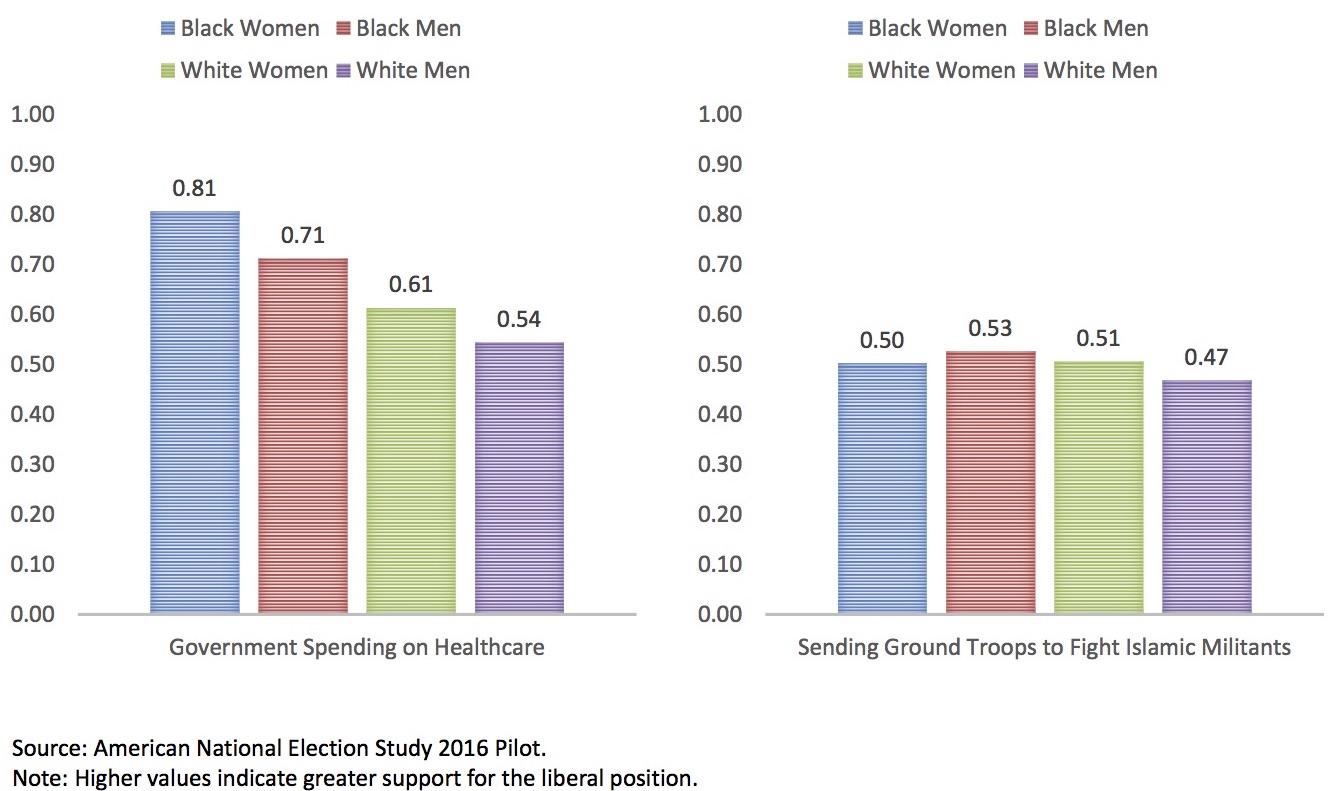
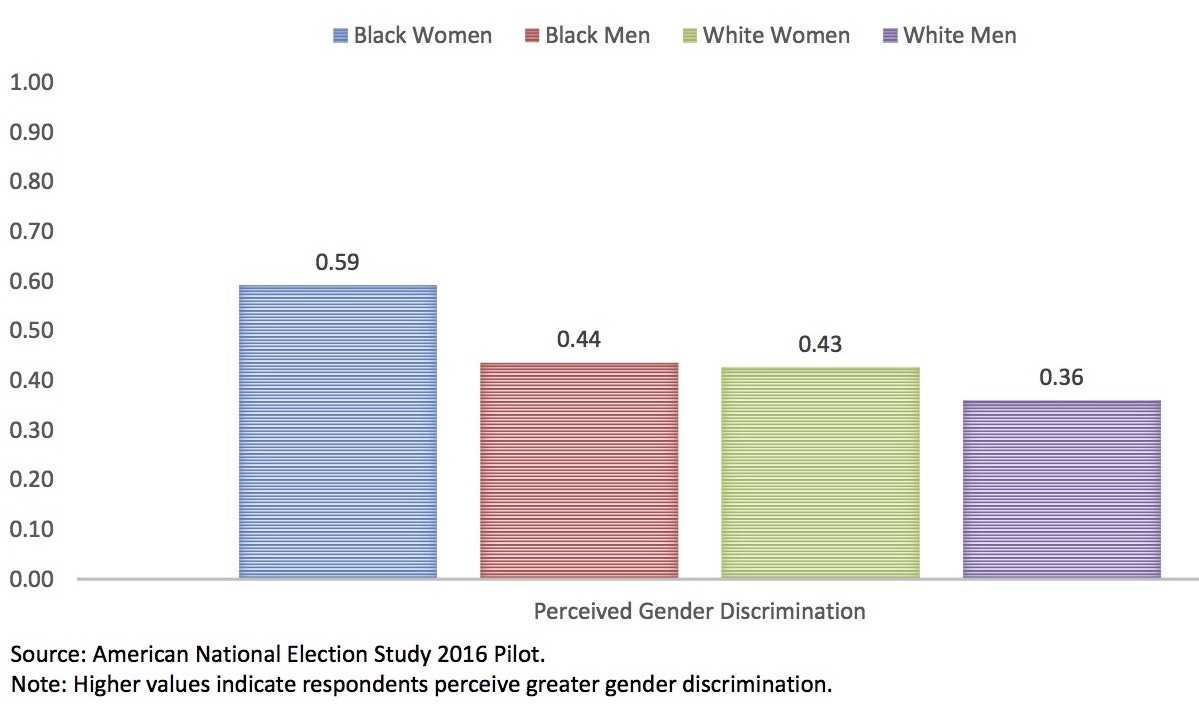
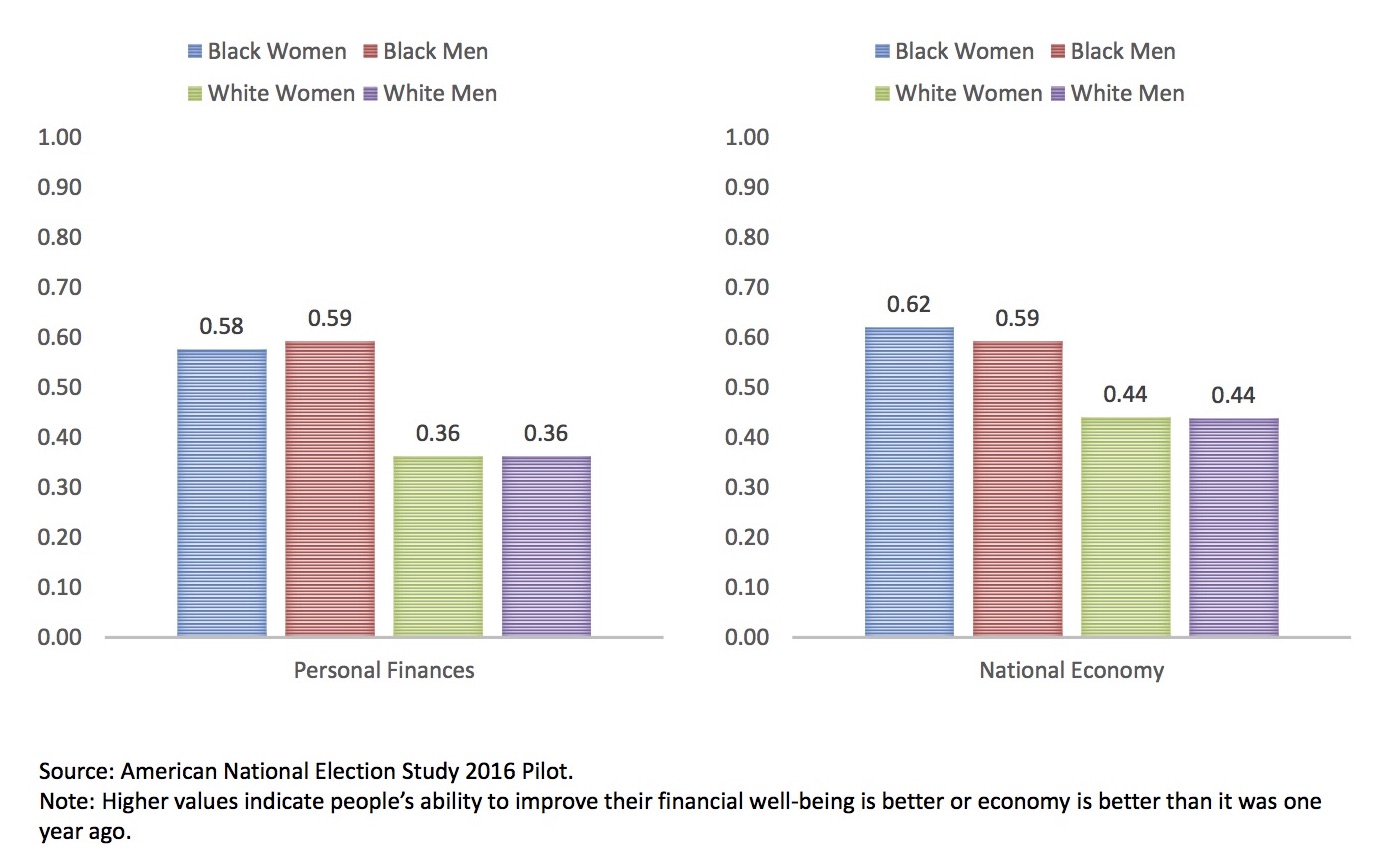
Using data from the ANES 2016 Pilot Study, Philpot compared opinions from white and black men and women on several issues such as government spending, inequality and discrimination, and evaluations of the economy. While there were noticeable differences strictly between men and women, the real story became clear when Philpot sorted the results by gender and race. Small gender gaps exist among both whites and blacks, but the most remarkable difference of opinions on all issues is between black women and white men.
SPENDING ON HEALTH CARE AND DEFENSE
2016 Gender Gap in Spending on Healthcare and Defense.
Perceived Gender Discrimination
2016 Gender Gap in Perceived Discrimination Based on Gender
Evaluations of the Economy
2016 Gender Gap in Economic Evaluations.
On most issues, black women and white men fall on opposite sides of the political spectrum. Philpot concludes that it’s an oversimplification to consider the gender gap as merely a gap between men and women, when, in reality, the observed gender gap is largest between white men and black women.
What We Know So Far About the 2016 Elections, was held on October 5, 2016 at the Center for Political Studies, University of Michigan. The panel also included the following talks:
Stuart Soroka: Read, Seen or Heard: A Text-Analytic Approach to Campaign Dynamics Nicholas Valentino: The Underappreciated Role of Sexism in the 2016 Presidential Race Michael Traugott: Pre-Election Polls in the 2016 Campaign


 The initial release of the 2016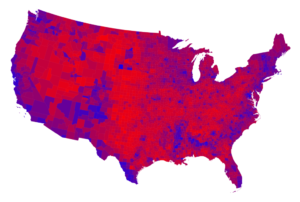
 With increasing levels of polarization and a