Sep 30, 2016 | Uncategorized
This post was developed by Catherine Allen-West, Stuart Soroka and Michael Traugott.
It’s an election year in America, and with that comes an endless string of media coverage of the political campaigns. If you are like 70% to 80% of Americans over the past 12 weeks, you’ve read, seen or heard some information about the top two presidential candidates, Hillary Clinton and Donald Trump, on any given day.
These are the findings from an ongoing research collaboration between Gallup, the University of Michigan and Georgetown University. Since July 11, 2016 Gallup has asked 500 respondents per night what they have read, seen or heard about Clinton or Trump that day. The resulting data include open-ended responses from over 30,000 Americans thus far.
Content analyses of these open-ended responses offer a unique picture of campaign dynamics. The responses capture whatever respondents remember hearing about the candidates over the previous few days from traditional media, social media, or friends and family. As Gallup points out in the article above, results from this project are noteworthy because while most survey research tracks Americans’ opinions on candidates leading up to an election, this study looks directly at the information the public absorbs, on a daily basis.
For up to date results from this project visit: www.electiondynamics.org
Tracking the ‘Tone’ of What Americans Have Read, Seen or Heard
In this blog post, we offer some supplementary analysis, focusing on the tone of responses to the “read, seen or heard” question. Positive and negative tone (or sentiment) are captured using the Lexicoder Sentiment Dictionary, run in Lexicoder. The Lexicoder Sentiment Dictionary includes roughly 6,000 positive or negative words. We count the frequency of both, and produce a measure of tone that is the % positive words – % negative words, for every response, from every respondent.
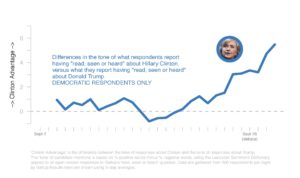
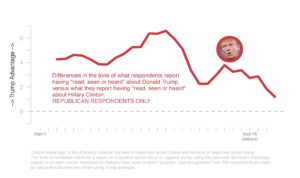
Taking the average tone of responses daily provides insight into the content that American citizens are receiving (and remembering) during the campaign. In this analysis, we focus on measures of “candidate advantage,” where “Clinton advantage” is the gap between the tone of responses to the “read, seen or heard” question about Clinton, and the tone of responses to the “read, seen or heard” question about Trump. Positive values reflect a systematic advantage for Clinton; that is, a tendency for recalled information about Clinton to be more positive than recalled information about Trump. Negative values reflect the opposite.
As would be expected, when we look at partisanship, Republicans have more a net positive assessment for Trump. This is particularly true in the first weeks of September. Democrats show a similar tendency in that they have more net positive assessments for Clinton. That said, the first few weeks of September show, at best, a very weak advantage for Clinton among Democrats. During the early weeks of September, Democrats’ recalled news was not markedly more positive for Clinton than it was for Trump. ‘Read, seen or heard’ comments from Democrats even turned to Trump’s advantage in the period from September 16th to 18th, before trending more positive towards Clinton again. This shift from Democrats followed concerns about Clinton’s health, but it also (and relatedly) reduced mentions of emails. This trend continued after the recent bombings in New York and New Jersey became prominent. And then came her performance in the debate. All of this coverage led to a steady increase in Clinton’s advantage among Democrats.
For Republicans, the picture is nearly the opposite. The gap between recalled information about Trump and recalled information about Clinton was striking through the first few weeks of September. While Democrats did not recall information favorable to Clinton, Republicans clearly recalled information favorable to Trump. But responses started to shift in the middle of the month and the ‘Trump Advantage’ in the tone of recalled information from Republicans has continued to fall since the first debate.
What do these findings suggest about the presidential campaign thus far? While these results do not capture vote intentions, nor are they direct assessments of the candidates, these data do give us a unique sense for the information that voters remember. Whether shifts in ‘read, seen or heard’ mentions are predictive of attitudes towards the candidates remains to be seen. Exploring this possibility is one objective of the ongoing project.
The Gallup, Michigan, Georgetown Working Group consists of: Frank Newport, Lisa Singh, Stuart Soroka, Michael Traugott, and Andrew Dugan.
Related Article: After the Debate, Trump is still dominating news coverage. But Clinton is getting the good press. The Washington Post.
Sep 3, 2016 | APSA, Elections
Post developed by Catherine Allen-West and Ozan Kuru.
ICYMI (In Case You Missed It) the following work was presented at the 2016 Annual Meeting of the American Political Science Association (APSA). The presentation, titled “Motivated Reasoning in the Perceived Credibility of Public Opinion Polls,” was part of the session “Surprises: A Magical Mystery Tour of Public Opinion and Political Psychology” on Saturday, September 3, 2016.
Polls have been an integral part of American democracy, political rhetoric, and news coverage since the 1930s. Today, there are new polls reported constantly, showing public opinion on a range of issues from the President’s approval rating to the direction of the country. Polls remain relevant because numbers and statistical evidence have always been regarded as sound evidence to support one’s beliefs or affirm their affiliations; similarly, polls are supposed to provide relatively objective information in politics.
However, despite their importance and ever-increasing prevalence, polls are often heavily criticized, both by the public and politicians, especially when they fail to predict election outcomes. Such criticisms and discounting of poll credibility is important, because people’s perceptions of polls matter. In such an environment, the perceived credibility of polls becomes an important issue for the public’s reception of poll findings, which then determines the likelihood of any meaningful impact of their results.
(more…)
Sep 2, 2016 | ANES, APSA, Elections
Post developed by Catherine Allen-West and Arthur Lupia
ICYMI (In Case You Missed It) this post details the Election Research Preacceptance Competition, organized by Arthur Lupia and Brendan Nyhan. Lupia discussed this initiative at the “Roundtable on the CPS Special Issue on Transparency in the Social Sciences” at APSA 2016 on Friday, September 2, 2016.
 How can scholars study politics most effectively? The Election Research Preacceptance Competition (http://www.erpc2016.com) is an innovative initiative that will test a new approach to conducting and publishing political science research during the 2016 election.
Entrants in the competition will preregister a research design intended to study an important aspect of the 2016 general election using data collected by the American National Election Studies (ANES). A condition of entering the competition is that entrants must complete and register a design before the ANES data are released. Many leading academic journals have agreed to review scholarly articles that include these research plans and to review them before the data are available or results are known.
(more…)
Sep 1, 2016 | APSA, CLEA, Innovative Methodology, International
Post developed by Catherine Allen-West in coordination with Diogo Ferrari

Diogo Ferrari, PhD Candidate, University of Michigan, Ann Arbor
ICYMI (In Case You Missed It), the following work was presented at the 2016 Annual Meeting of the American Political Science Association (APSA). The presentation, titled “The Indirect Effect of Income on Preferences for Centralization of Authority,” was a part of the session “Devolution, Fragmented Power, and Electoral Accountability” on Thursday September 1, 2016.
One of the primary activities of any elected government is to decide how to allocate public funds for policies like health care and education. In countries that adopted a federal system – like the United States, Canada, Australia, Germany, and others – the central government usually has some policies that promotes distribution of fiscal resources among different jurisdictions, like among states or cities. Take Australia for example. The federal government collects taxes that are funneled to local governments in accordance with their needs. This diminishes the inequality between different Australian sub-national governments in their capacity to invest and provide public services. Brazil is another example. Brazil has a huge federal program that transfers resources from rich to poor states and whose goal is to reduce regional inequality. These federal governments can only continue to operate in this way, that is, promoting interregional redistribution, if the power to control fiscal resources is centralized. Therefore, there is a connection between interregional redistribution and centralization of authority.
Now, voters have different preferences about how the government should spend the fiscal resources. They have different opinions, for instance, to which degree taxes collected in one region should be invested in another region. Do voters that support interregional redistribution also prefer that the fiscal authority is concentrated in the hands of the federal government as opposed to the sub-national ones? Which characteristics determine the preference of voters regarding interregional redistribution and centralization of authority? How those preferences are connected?
(more…)
Sep 1, 2016 | APSA, Conflict, Current Events, Foreign Affairs, International
Post developed by Catherine Allen-West in coordination with Michael Robbins.
ICYMI (In Case You Missed It), the following work was presented at the 2016 Annual Meeting of the American Political Science Association (APSA). The presentation, titled “Passive Support for the Islamic State: Evidence from a Survey Experiment” was a part of the session “Survey and Laboratory Experiments in the Middle East and North Africa” on Thursday, September 1, 2016.
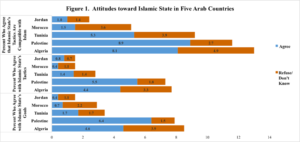
On Thursday morning at APSA 2016, Michael Robbins, Amaney Jamal and Mark Tessler presented work which explores levels of support for the Islamic State among Arabs, using new data from the Arab Barometer. The slide set used in their presentation can be viewed here: slides from Robbins/Jamal/Tessler presentation
Their results show that among the five Arab countries studied (Jordan, Morocco, Tunisia, Palestine and Algeria) there is very little support for the tactics used by Islamic State.
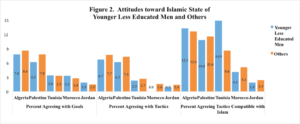
Furthermore, even among Islamic State’s key demographic – younger, less-educated males – support remains low.
For a more elaborate discussion of this work and the above figures, please see their recent post in the Washington Post’s Monkey Cage blog, “What do ordinary citizens in the Arab world really think about the Islamic State?”
Mark Tessler is the Samuel J. Eldersveld Collegiate Professor of Political Science at the University of Michigan. Michael Robbins is the director of the Arab Barometer. Amaney A. Jamal is the Edwards S. Sanford Professor of Politics at Princeton University and director of the Mamdouha S. Bobst Center for Peace and Justice.