A Visual History of the American National Election Studies
The American National Election Studies (ANES) is the definitive study of American political attitudes and behavior, recognized for setting “the gold standard” in survey research in political science. The project has surveyed American citizens before and after every presidential election since 1948. With a time series of core questions asked continuously across many elections, these surveys provide a window onto the sweep and the pivot points of historic change in American public opinion. In recent studies, new questions comprise about 30 percent of each survey, allowing users to understand contemporary issues that might be driving American political dynamics. Funded by the National Science Foundation since 1977, the ANES is both national scientific infrastructure and a touchstone of political science research.
The Beginning (1948-1952)
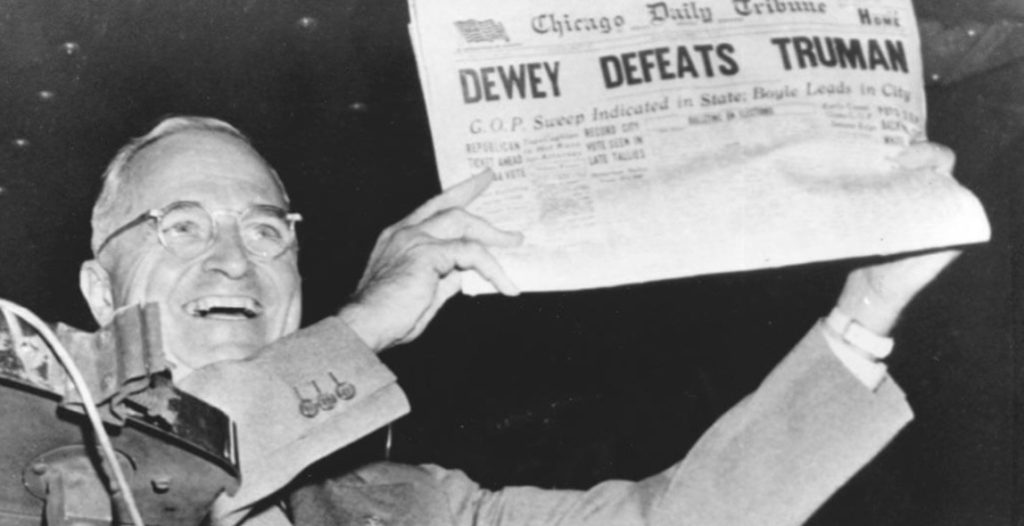
In 1948, under the direction of Angus Campbell and Robert Kahn, the Survey Research Center carried out what is viewed as a pilot study of the national electorate. Fortuitously, the study pioneered survey sampling methods that outperformed commercial polls in predicting the presidential race that year. The “Dewey Defeats Truman” debacle– when the Chicago Daily Tribune famously ran the incorrect banner headline on its front page following Truman’s upset victory– provoked an inquiry into election survey methodology. on matters such as sampling and personal interviewing that helped set a new standard for scientifically valid surveys, market research, and public opinion polling. The first Michigan monograph, The People Elect a President, by Robert Kahn and Angus Campbell, was based on pre- and post-election interviews of 662 respondents: and those original survey responses are still available from ICPSR.
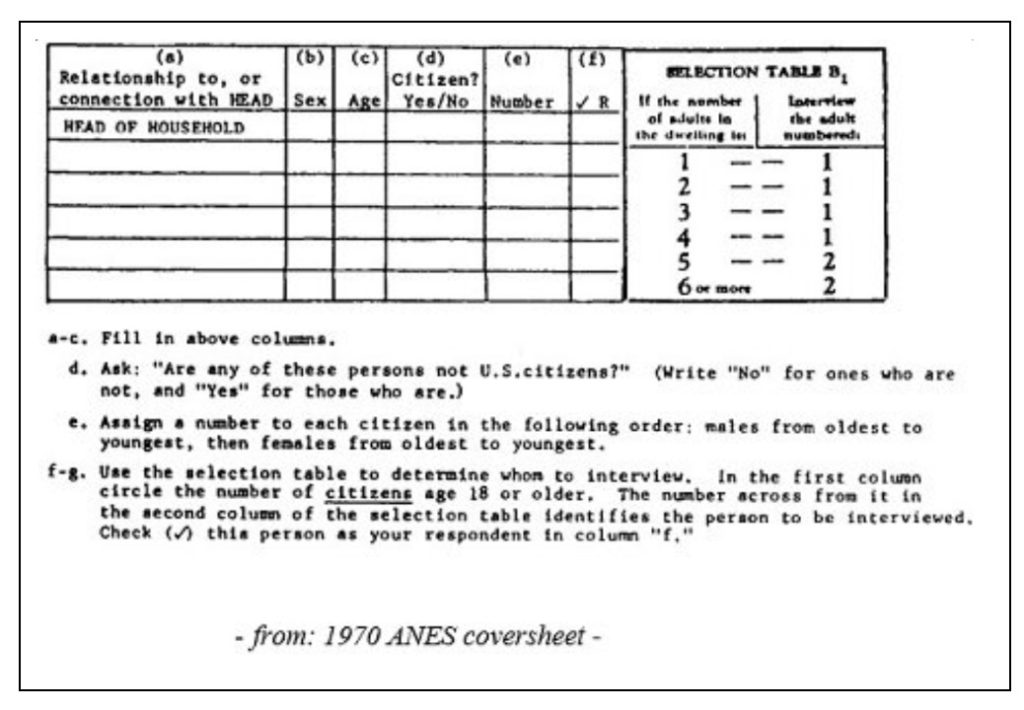
Since the early days of the study, a central goal has been to develop and implement the newest and best methods for conducting survey research. For example, the 1948 survey introduced the Kish grid, a method for randomly choosing household respondents, pictured below. As John Aldrich wrote in the ANES’s 2017 board report, the statistician Leslie Kish was also responsible for the “multi-stage cluster sampling approach that still defines the current backbone of the ANES study design.”
The Michigan Election Studies (1952-1976)
When Warren Miller was hired as the assistant study director of the Survey Research Center, his dissertation proposed a project that was adopted almost in its entirety in the 1952 election study, and used for planning further studies that became known as “the Michigan Election Studies” located at the University of Michigan Institute for Social Research (ISR). The Michigan studies would cover all 13 presidential and midterm elections between 1952 and 1976.
The Fifties
It’s worth pausing to imagine the intellectual environment of ISR in its early years. As former ANES PI Virginia Sapiro wrote in remarks on the ANES’s 50th anniversary, ISR’s formation in 1948 was based on a series of connections that brought founders of the blossoming new field of social psychology together with an interdisciplinary group of social scientists. This included psychologists such as Dorwin Cartright, Jack French, and Robert Zajonc at the Research Center for Group Dynamics, whose work on “ego strength” influenced concepts of “personal competence” and “political efficacy” that first appeared in the 1952 Michigan election study. In the years after World War II, there was wide interest in the study of authoritarianism and democratic norms. The election study benefited from this new force of social scientists at ISR, trained in new methodologies, many out of the Department of Agriculture and the wartime Office of Strategic Services. ISR had technical and mechanical resources, such as punch card machines, to code and analyze data, and teemed with opportunities for intellectual collaboration. For the election studies, Sapiro wrote, this period was marked by “the initiation of creative expansion of the research program that ultimately transformed it into one of the most influential social science projects of the post-World War II era.”
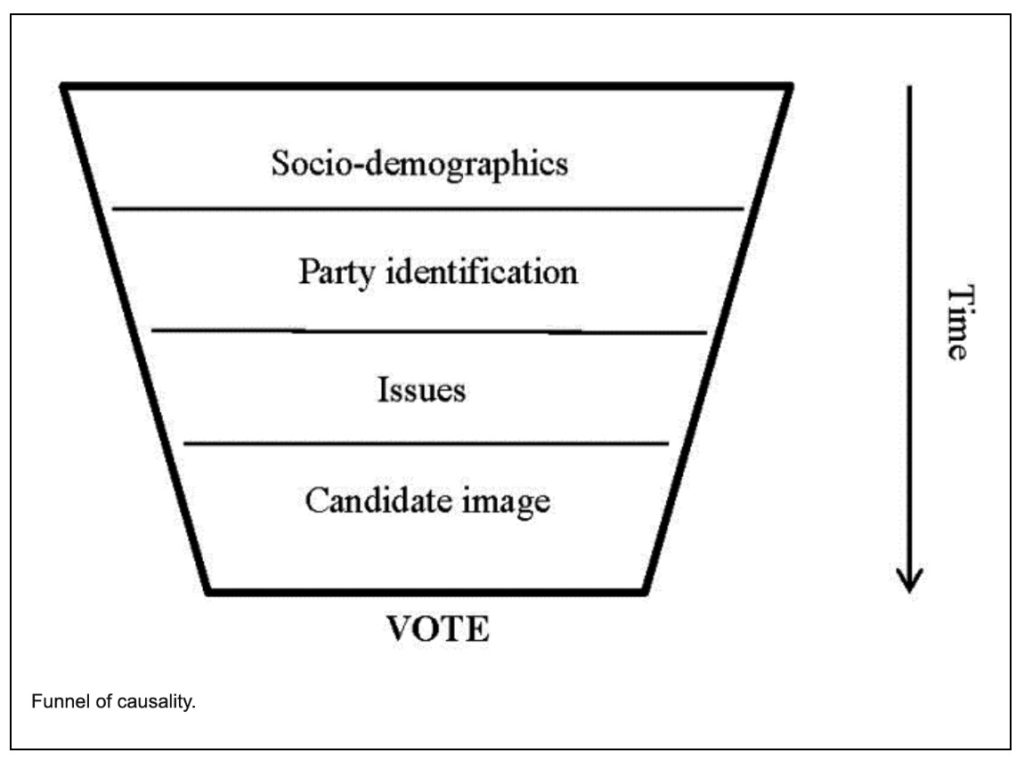
Over its first decade, the Michigan collaborators developed what’s known as the “Michigan model,” a theory of how voters make choices based on a “funnel of causality” involving sociodemographic factors, party identification, and, shorter-term, issue orientations and candidate evaluation.
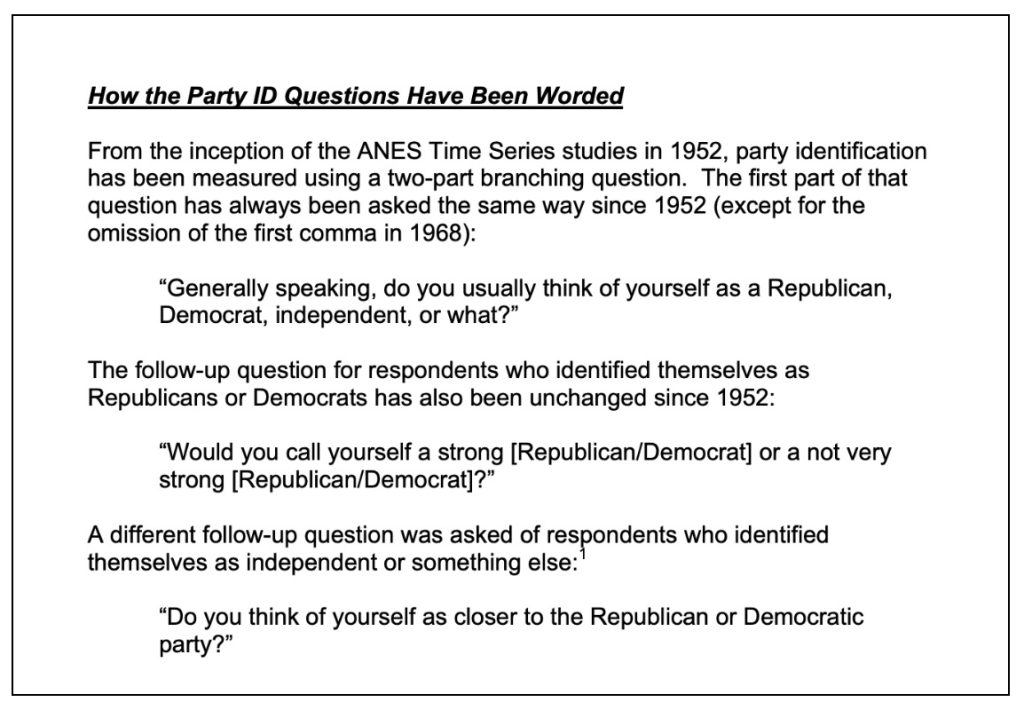
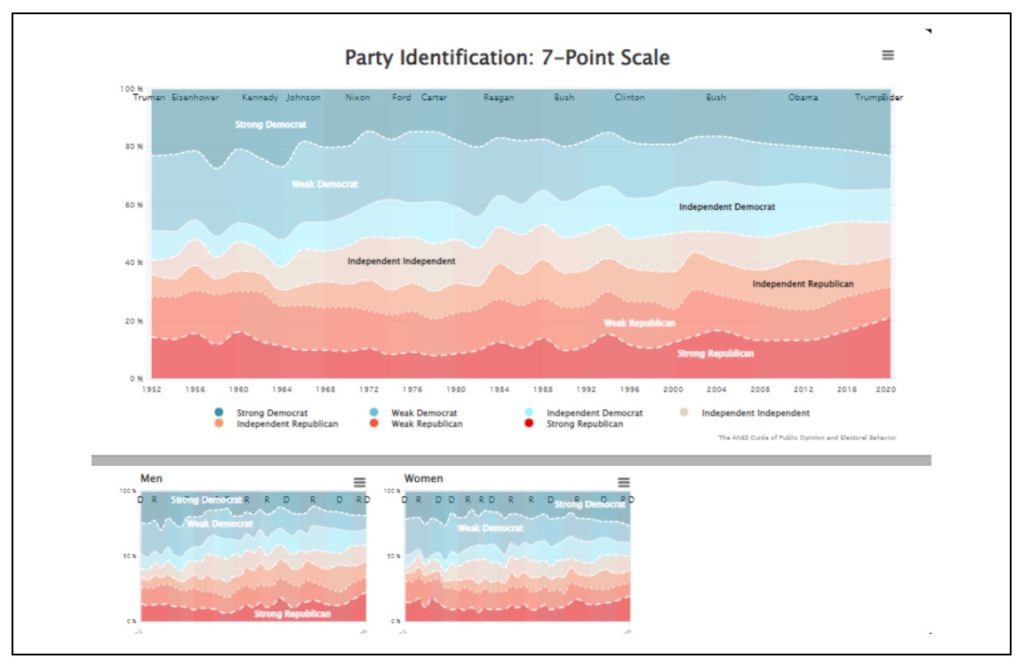
The 1952 ANES survey introduced the new measure of “party identification” to assess whether voters possessed deep psychological attachments to one of the parties. The idea that people acquire long and stable affinities for specific parties that transcended feelings about candidates and issues in any one election, then novel, has become central to our understanding of how people vote. Most scholars of political science now see this as the core predisposition shaping political beliefs and behavior.
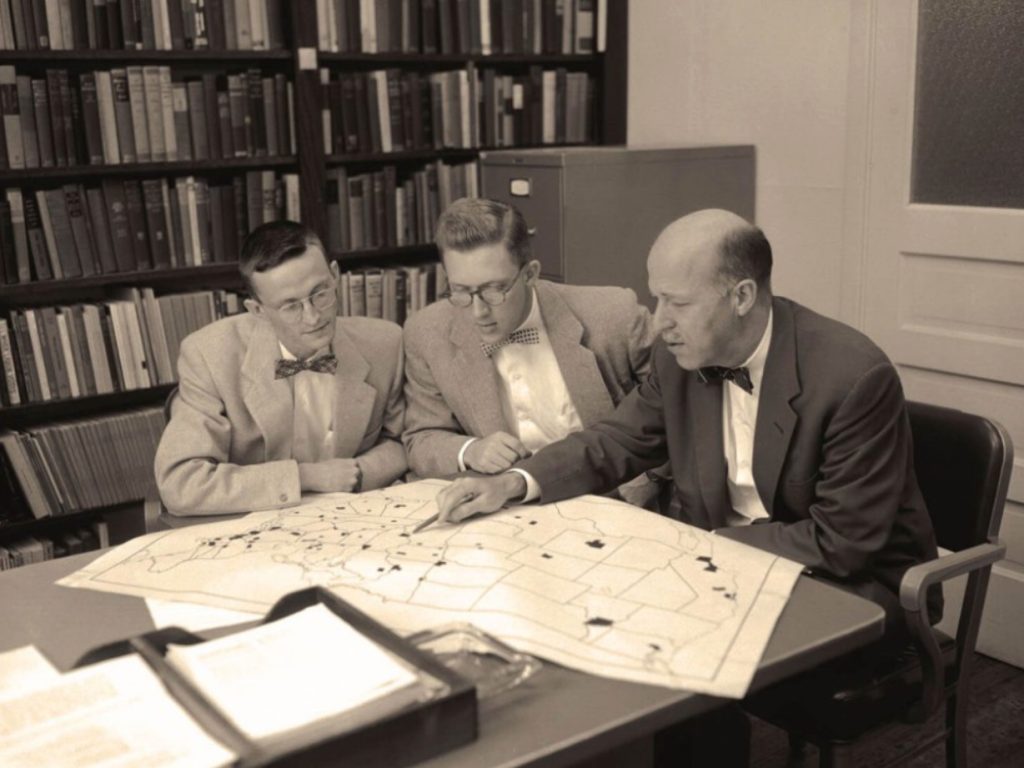
Pictured in this photograph from the Bentley Historical Library, from left to right are Philip E. Converse, Warren E. Miller, and Angus Campbell, circa 1956, as they review the sampling design of their new survey. Philip E. Converse and Donald E. Stokes, then promising graduate students, also joined the team that year.
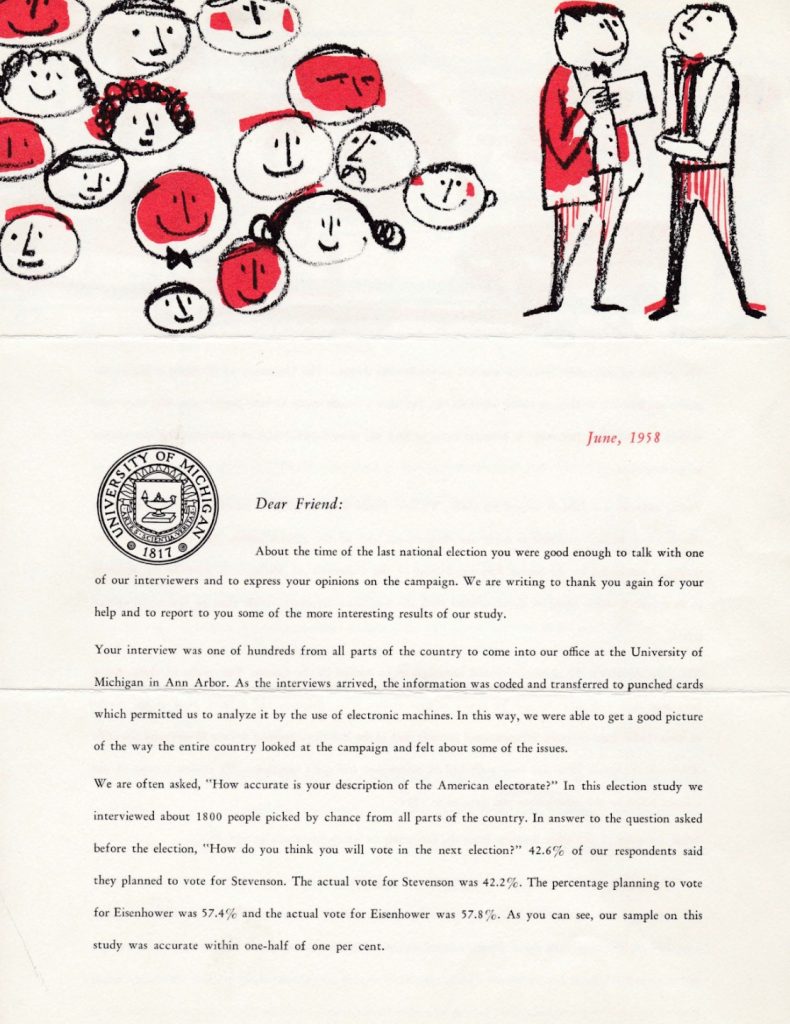
In the pictured letter, we see an example of a respondent letter mailed to survey participants after each election. This example, from 1958, describes the punch card system used to analyze interview content and the accuracy of the results. (The 1958 election study found the percentage planning to vote for Eisenhower was 57.4%. The actual vote was 57.8%.) This letter was sent by Angus Cambell, PI of the study from 1948 to 1960, to respondents who participated in the 1956 Time Series survey. (Find more about the history of the ANES principal investigators here).
The Sixties
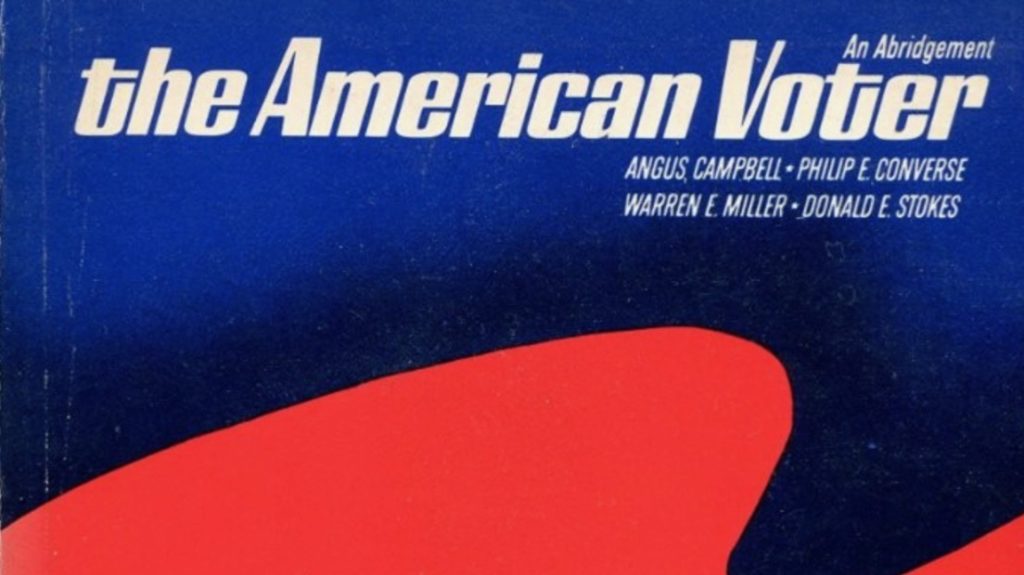
Capping the work of the prior decade, The American Voter, written by Campbell, Converse, Miller, and Stokes, was a seminal study based on ANES data, published in 1960. It launched a new field of research into the beliefs and attitudes that shape voter decision making.
The studies of the 1960s were responsive to changing national political circumstances. In 1960, for example, new questions emphasized the role of religion and helped capture the extent to which anti-Catholic sentiment reduced Kennedy’s margin of victory. In 1964, the study added a special sample to better understand the politics of Black Americans. In 1968, the survey addressed militarism, racism, and as Warren Miller phrased it, “[issues] having to do with the rather unique appeal of George Wallace to the older voter.”
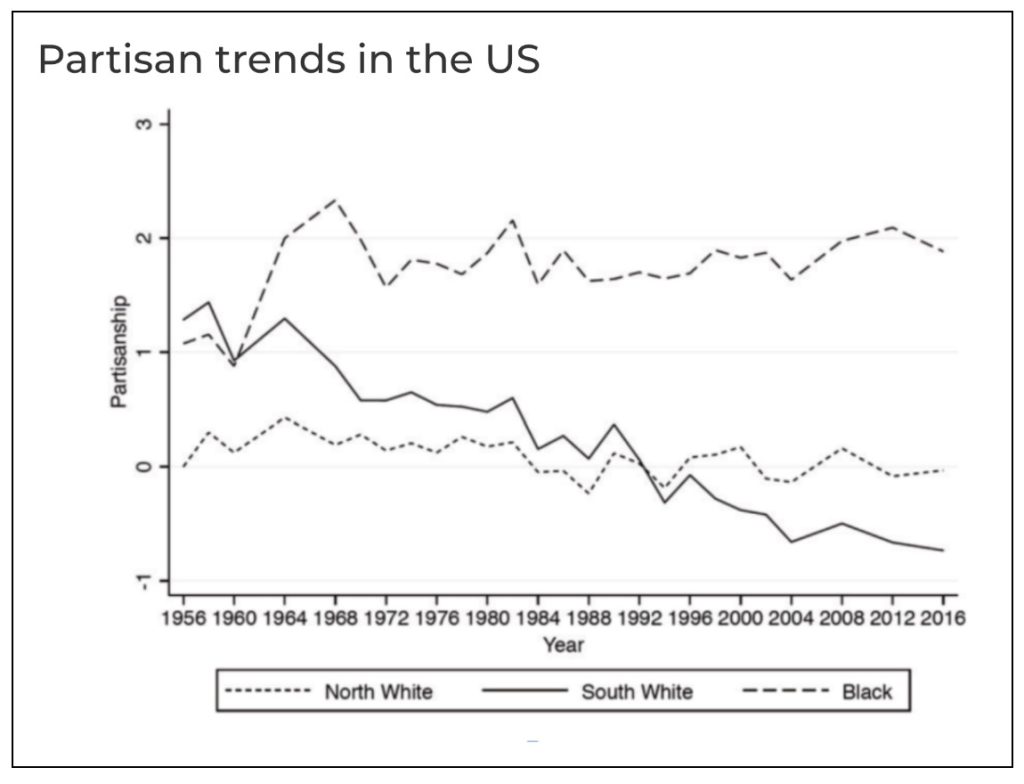
The 1960s also occasioned what may be the most dramatic shift in American electoral history this century. As described by Rutgers Professor Richard Lau, the Michigan studies captured “the major realignment of the American party system that occurred mostly during the 1960s because of the civil rights movement, desegregation, and busing.”
The graph below from Dynamic Partisanship: How and Why Voter Loyalties Change by Ken Kollman and John E. Jackson plots partisanship among three groups of the U.S. electorate– northern whites, southern whites, and Black voters– from 1956 to 2016, with Democratic partisanship increasing along the y axis. Northern white partisanship is particularly stable; Southern white partisanship shows a graduate shift from “moderately Democratic” to “weakly Republican” over six decades. But the 1964 election stands out as a critical turning point in African American partisanship, making a dramatic leap and remaining consistently high on the Democratic scale after the passage of the Civil Rights Act.
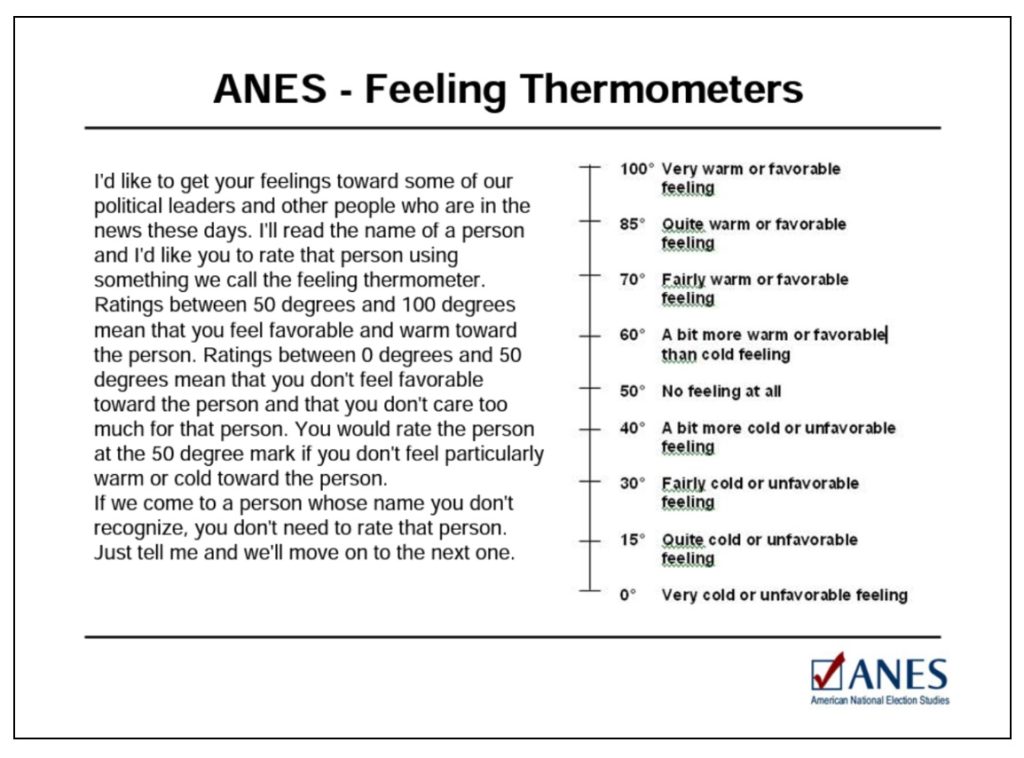
The introduction of the “feeling thermometer” in 1964 was a key innovation in measurement that has helped to capture “affective polarization”– the shifting feelings people hold toward political parties– over time. The feeling thermometer remains a widely used tool for measuring how voters feel about a specific person or group.
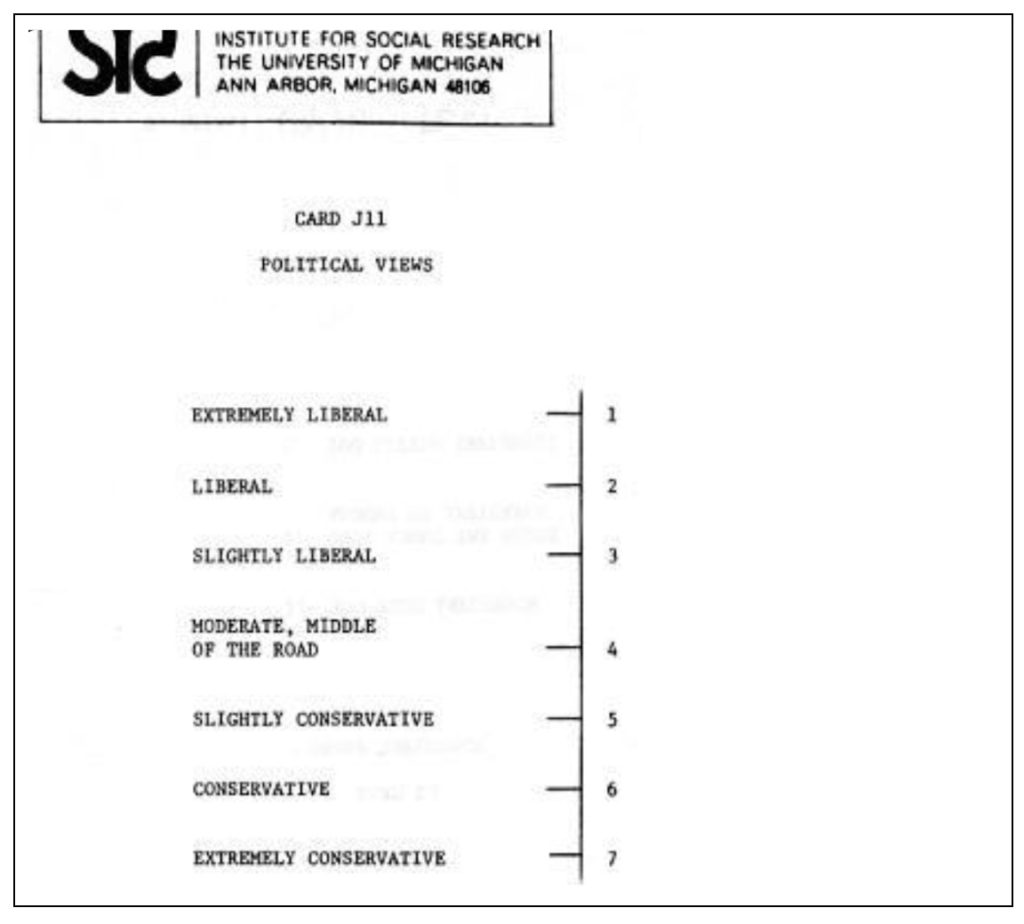
The other major innovation in measurement dating back to the 1960s was the “seven-point Likert scale,” introduced in 1968 and now omnipresent in survey measurement. The invention of this scale came out of the work of Richard Brody and Sidney Verba in a study of attitudes toward the Vietnam War.
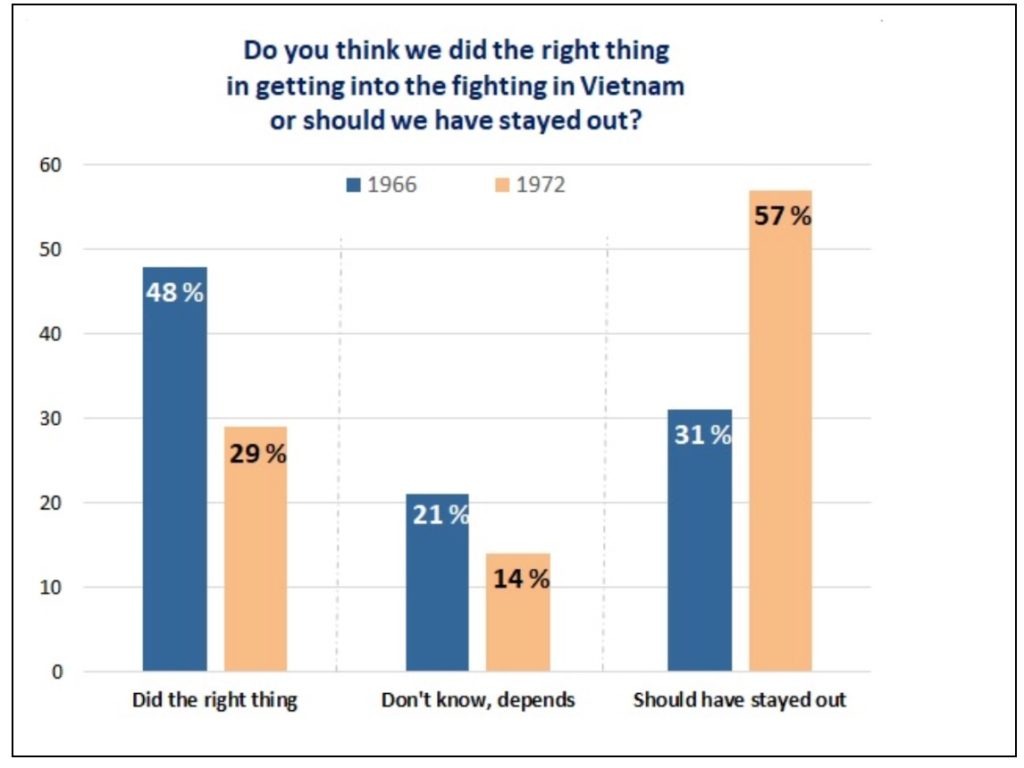
The project began asking Americans in 1966 if the US “did the right thing in getting into the fighting in Vietnam.” The 1972 survey results documented the shifting tide of public opinion. While 48% of respondents in 1966 thought the US had “done the right thing in getting into the fighting,” that number by 1972 had dwindled to 29%.
The Seventies
In 1970 the principal investigator for the election studies became the newly founded Center for Political Studies (CPS) at ISR. By this time, ANES historians note that the studies had become an extraordinary resource for large segments of the social science research community: “Placed in the public domain by the archival and data dissemination facilities of the Inter-University Consortium for Political and Social Research (ICPSR), the Michigan studies provided the quantitative data base for a very large number of important investigations in several disciplines, supporting social research carried out by scores of investigators, and utilized by hundreds of teachers and thousands of students.”
In the words of Warren Miller, the 1970s was also the occasion for “systematic attempts to broaden the input of the user community in the specification of Michigan election study content.”
A new area of focus for the study, dating to 1974, was the impact of mass media on electoral behavior– an area that has become a discipline in itself.
It’s fair to say the election studies were also impacting mass media by providing not only information but key concepts for analytical methods used to understand public opinion. Warren Miller helped various networks to develop their election coverage, and as a consultant for ABC News, Miller coined the term “projection” that remains in use today to describe estimated election outcomes.

Photo source: Chance Magazine, courtesy of Jack Moshman. Mike Traugott, Jerrold Rusk, and Warren Miller with members of the ABC News team. Circa 1968.
Questions about trust in government have been asked since the very early days of the election studies. The vast majority in early years believed that “not many” or “hardly any” in government were crooked. After Watergate evidence was released to the public in 1974, the percentage fell by 9 points. (Trust in government would again diminish over time after 2000).
The National Election Studies (1977-2005)
In 1977, the National Science Foundation (NSF) designated the National Election Studies (NES) as “a national research resource.” Its governing board that year referred to the NES as a “national resource for the social sciences analogous to high energy accelerators, telescopes, or oceanographic laboratories.”
Its mission was extending the time series collection of core data, and developing instrumentation and study designs to facilitate the testing of new theories of voting and public opinion. The principal investigator of the National Election Studies would now be supervised by an NSF-appointed board, whose charge included identifying the broad interests of the national and international research communities served by the survey.
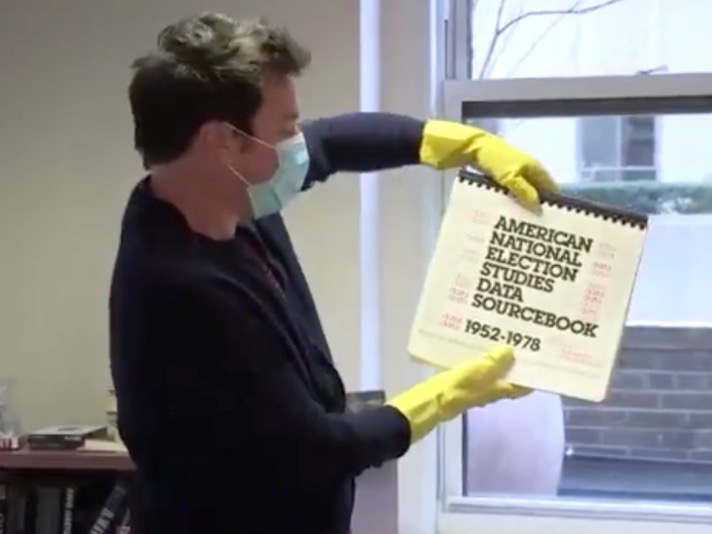
In 1979, Harvard published the ANES Data Sourcebook 1952-1978. Providing tabular percentages across years for measures repeated comparably over the multiple Time Series studies, the sourcebook was a predecessor to the online ANES Guide to Public Opinion and Electoral Behavior. The ANES’s Time Series Cumulative Data File would later become the most downloaded dataset in the ANES archive. Pictured below in a 2021 Tonight Show segment, Jimmy Fallon picks up a copy of the Sourcebook found while cleaning out the MSNBC office of political analyst Steve Kornacki.
The Millennial Shift
Technological changes at the turn of the millennium influenced the collection, development and distribution of the NES data. In 1980, the first phone interviews were conducted by NES administrators who recorded responses on paper questionnaires. Computer-assisted telephone interviewing (CATI) and personal interviewing (CAPI) techniques were used and compared against face-to-face interviewing techniques in the 1982 Methods Comparison Study. The subsequent growth of the internet radically altered communication with NES’s user community and the distribution of its data. In the late 1990s, the NES distributed data through its FTP site and released a CD-ROM that contained the data and supporting documents of all the studies it had mounted to date. The advent of the internet also made new sampling techniques available, supplementing the NES resource that remains unique today in its sampling and measurement quality.
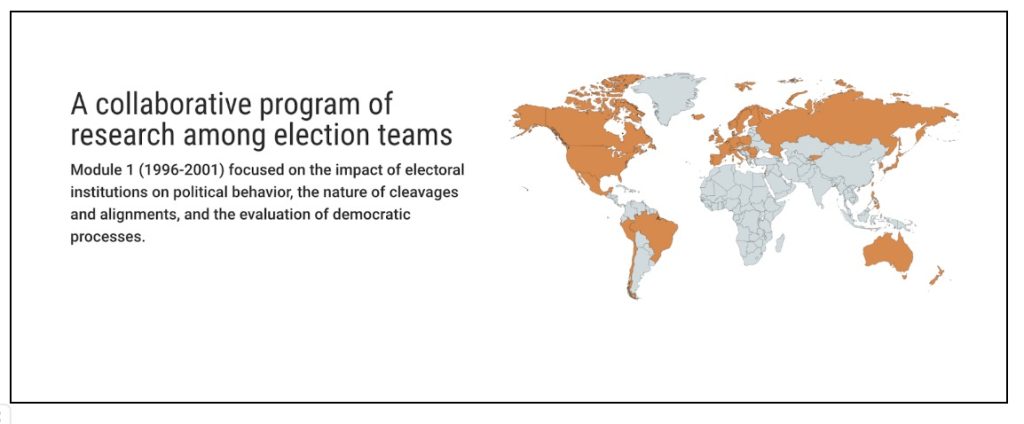
This period was also pivotal for the NES moving from national barometer to global participant. The NES had long been a model for the development of election studies around the world. Then in the early 1990s, the NES was a founding member of the most significant comparative study of democratic politics, the Comparative Study of Electoral Systems (CSES). Every five years, election studies participating in CSES collaborate on developing a new module of questions that is then included in post-election surveys globally, enabling analyses that compare citizen attitudes and behaviors across countries and different electoral contexts. The NES incorporated the CSES for the first time in its 1996 data collection; the year 2024 will be the seventh time that the CSES has been included in the NES.
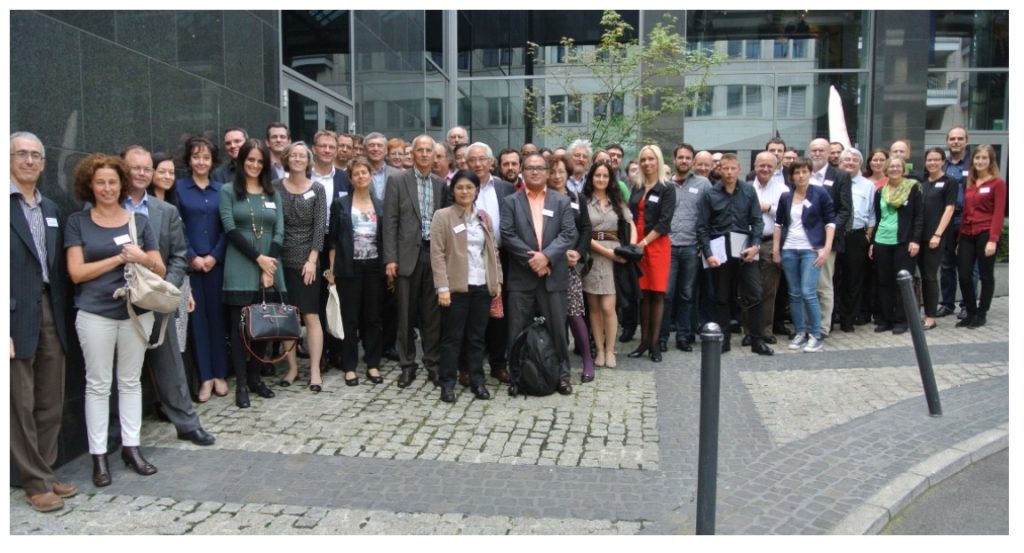
Pictured below: attendees of the 2014 CSES Conference and Plenary Session in Berlin, organized by the Wissenschaftszentrum Berlin für Sozialforschung (WZB) and supported by the Center for Political Studies.
The American National Election Studies, 2005-present
In 2005, the ANES began a collaborative effort between the Institute for Social Research at the University of Michigan and the Institute for Research in the Social Sciences at Stanford University.
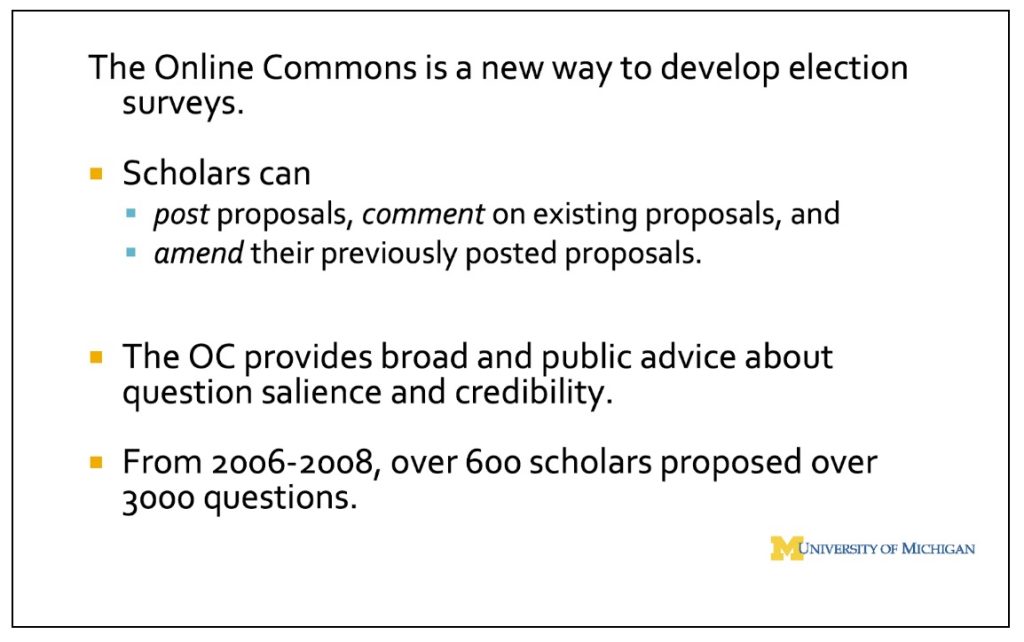
In 2006, PI’s Arthur Lupia and Jon Krosnick opened the “Online Commons,” a forum for the research community and the public to submit new ideas for future studies. From 2006-2008, over 600 scholars proposed over 3,000 questions.
In 2010, the NSF included the ANES in its “Sensational 60,” a list of advancements that have had a large impact on every American’s life.
Recent History
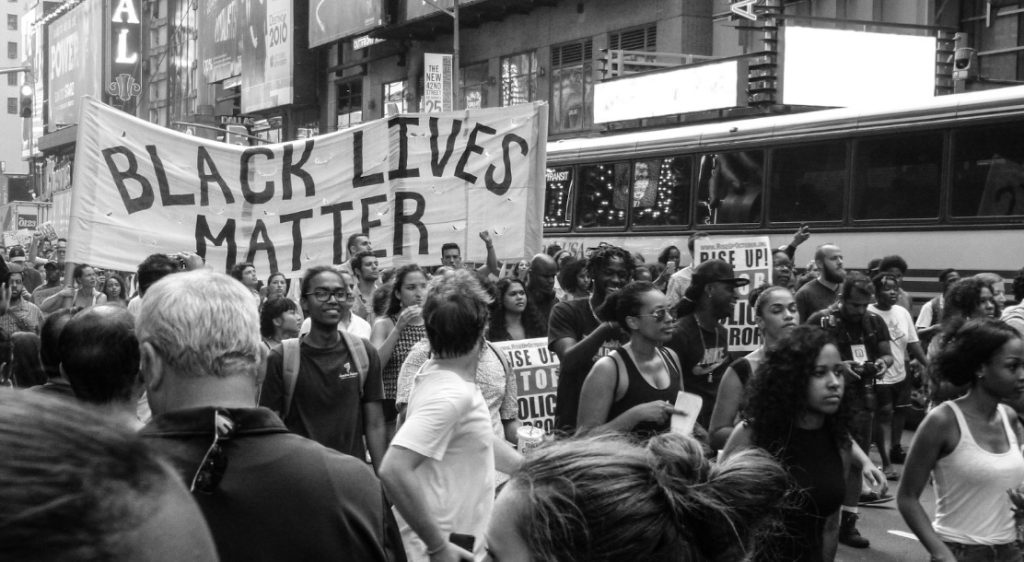
Photo source: Nicole Baster, via Unsplash
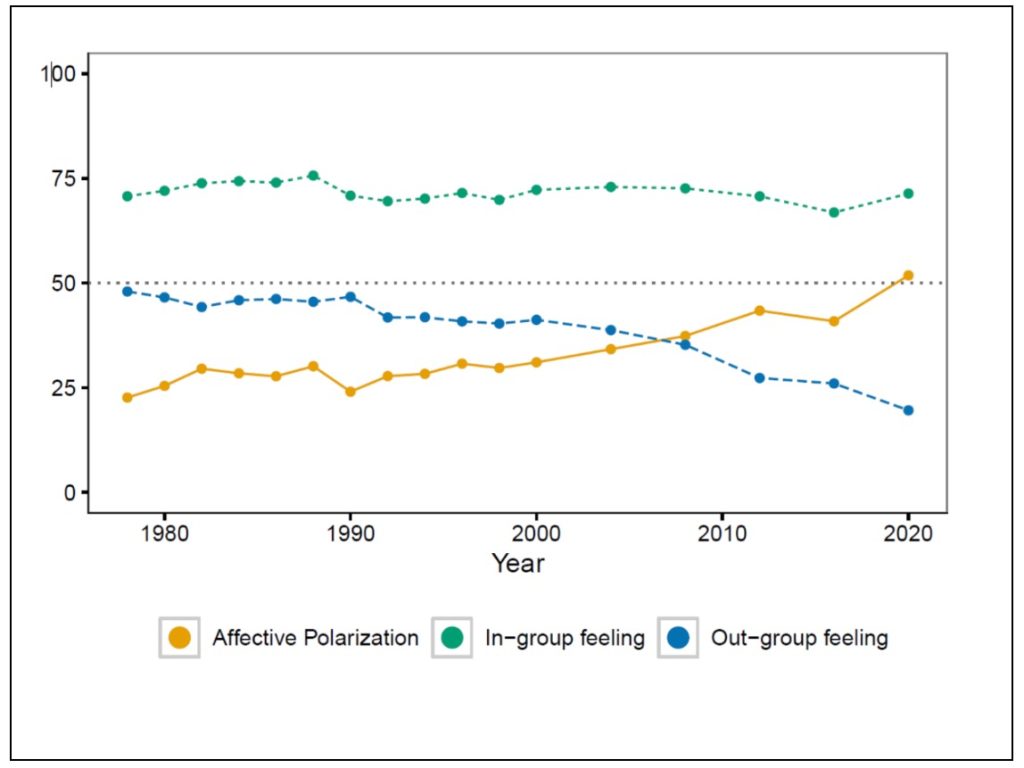
Perhaps the most important trends captured in the past decade of the ANES have been decreasing trust in government and increasing affective polarization, or animosity across party lines.
“The unparalleled ANES time series data have made possible the discovery of an entirely new subfield of American politics – the phenomenon of affective polarization,” writes ANES PI Shanto Iyengar. “[The documentation of] a significant increase over time in partisans’ hostility toward their opponents, first published in 2012, has since generated more than 350 published papers (with the term affective polarization in the title) and approximately 12,000 citations (from Google Scholar).”
The 2016 study introduced new questions on trade, immigration, economic inequality, LGBT issues, outsourcing, policing, and social mobility. That same year, the ANES tested the collection of high-quality Internet samples, comparing these to in-person interviews.
This year also inaugurated the 3-wave panel (2016-2024), interviewing more than 2,000 people from a high-quality, representative sample over three presidential elections for the first time in ANES’s history.
Conducted between 2018 and 2022, a massive scanning project funded by the NSF added 5 million pages of content to the ANES’s digital archive.
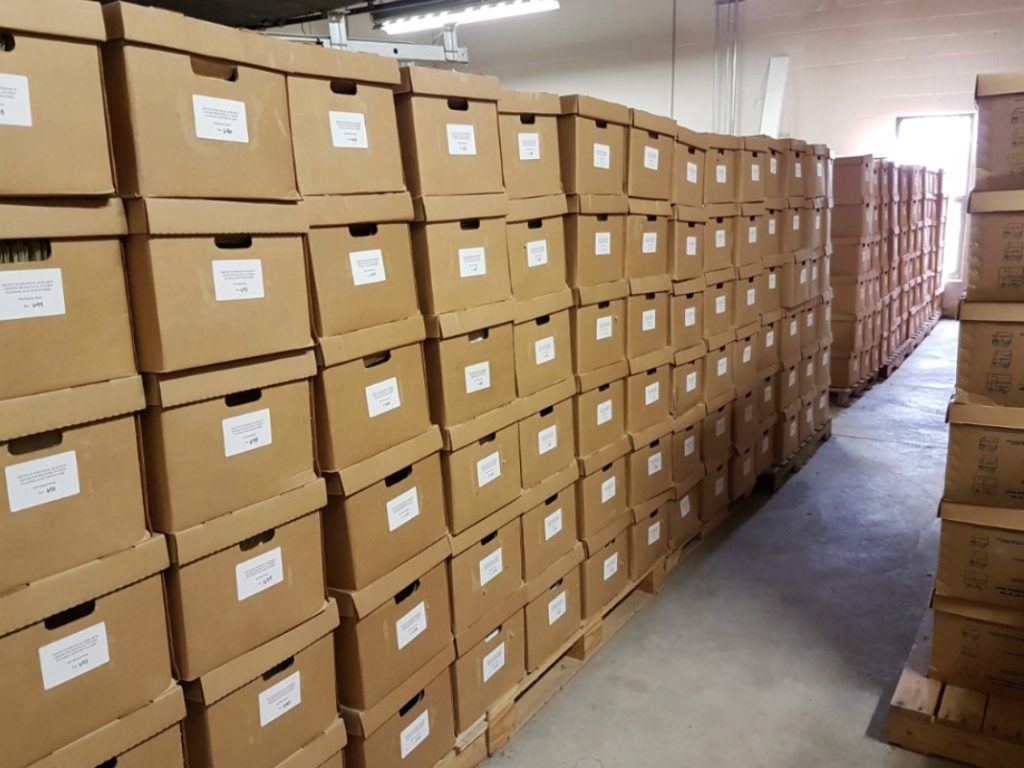
(Photo courtesy of ANES staff)
The 2020 Time Series study was designed by the Principal Investigators Ted Brader and Shanto Iyengar with help from Associate PI’s Nicholas Valentino, Sunshine Hillygus, Daron Shaw, an experienced staff, and with input from the ANES Advisory Board and user community. The ANES added questions about Black Lives Matter and police conduct, and initiated its Social Media Study, the first nationally representative data set linking social media use to political behaviors.

In 2022, the beta version of the ANES Guide to Public Opinion and Electoral Behavior was released with improved formatting, visualizations, and interactivity.
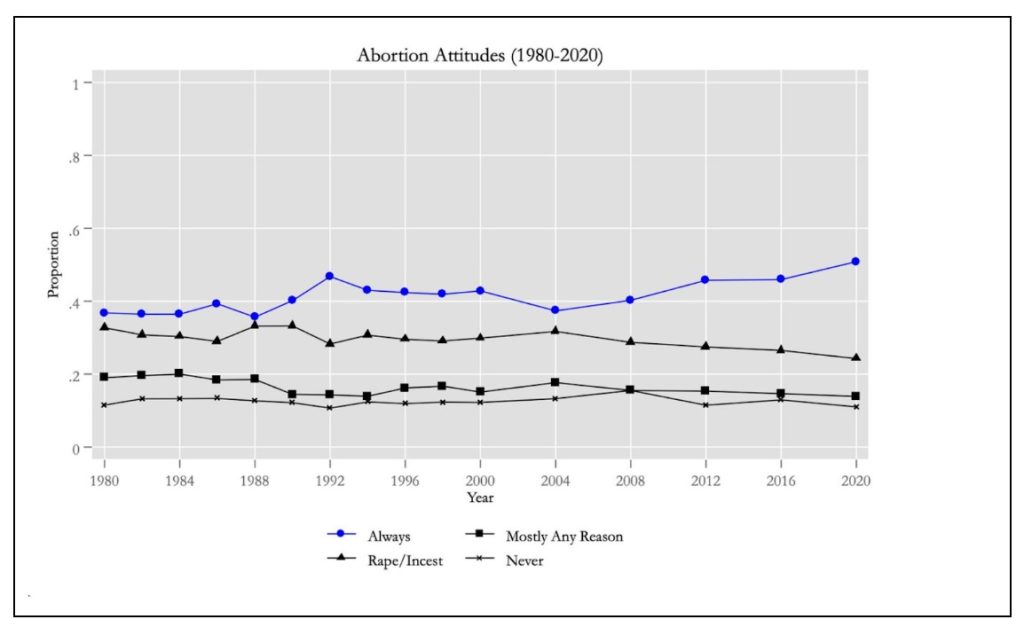
Following the Supreme Court’s decision in Dobbs, overturning Roe vs Wade, the 2022 ANES pilot study began beta testing new questions on abortion. Pictured here: A graph of election studies’ data on abortion attitudes, posted to Twitter/X by political scientist Ian Shapiro, shows an increase in support for the option that by law, a woman should “always” be able to obtain an abortion as a matter of personal choice.
The Future of the ANES (2024-)
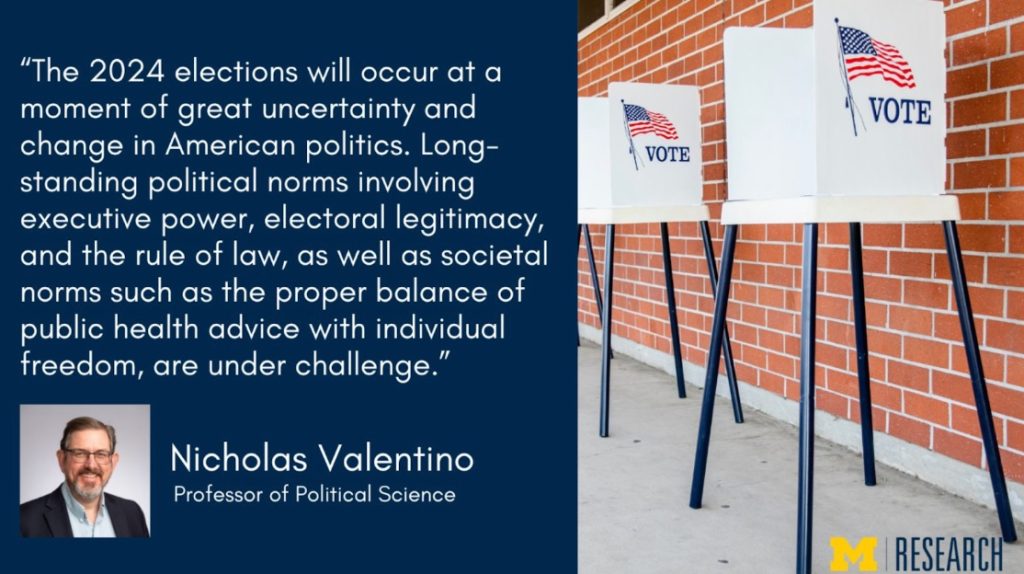
In 2022, the NSF awarded $14m to the ANES to study 2024 elections to a PI team including Sunshine Hillygus, Shanto Iyengar, Daron Shaw and Nicholas Valentino. In 2024, the ANES will complete its 3-wave panel interviewing the same respondents over three presidential elections for the first time in the ANES’s history. Valentino notes that the 2024 elections will occur “at a moment of great uncertainty and change in American politics. Long-standing political norms involving executive power, electoral legitimacy, and the rule of law…are under challenge.” Trust in government is at an all-time low; polarization in America is at its most venomous. Without the ANES, we would not be able to know where these trends began, and so long as the ANES remains funded, we will have a national resource that shows us where we’ll have gone from here.
The ANES is currently a collaboration of Duke University, the University of Michigan, Stanford University, and the University of Texas at Austin, with funding from the National Science Foundation.
Its current principal investigators are Shanto Iyengar, Professor of Political Science and Director of the Political Communication Laboratory at Stanford University, and Nicholas Valentino, Professor of Political Science at the University of Michigan and a Research Professor affiliated with the Center for Political Studies at the Institute for Social Research. The Associate PIs are D. Sunshine Hillygus, Professor of Political Science and Public Policy and director of the Initiative on Survey Methodology at Duke University, and Daron Shaw, Distinguished Teaching Professor and the Frank C. Erwin, Jr. Chair of State Politics at the University of Texas at Austin.
Sources and Further Reading
- John Aldrich, “The American National Elections Study as ‘Gold Standard’ for Survey Research in the Twenty-First Century,” Board Report, 2017.
- Nancy Burns, “The Michigan, then National, then American National Election Studies,” 2006.
- The ANES (electionstudies.org) history, previous principal investigators, and timeline.
- Warren E. Miller, “An Organizational History of the Intellectual Origins of the American National Election Studies,” European Journal of Political Research 25: 247-265, 1994.
- Virginia Sapiro, “Fifty Years of the National Election Studies: A Case Study in the History of ‘Big Social Science,’’ delivered at the Annual Meeting of the American Political Science Association, Atlanta, 1999.
- Herbert F. Weisberg, “Reflections: The Michigan Four and their Study of American Voters: A Biography of a Collaboration,” American Political Science Association, 2016.
This post was developed by Tevah Platt.