Victor Orbán, Prime Minister of Hungary for sixteen years (2010-26), has conceded the election to Peter Magyar and his opposition Tisza party. This is an enormous defeat for the right-wing populist leader and his right-wing populist Fidesz party and a landslide victory for the democratic opposition.
Parliamentary Supermajority for the Opposition Provides Lever to Rebuild Democracy
By winning more than 135 seats in the 199-seat legislative body, Magyar’s Tisza party has not just secured a majority but a supermajority in the Hungarian parliament. Orbán’s Fidesz party has held a parliamentary supermajority for four consecutive terms, which he has used to rewrite the constitution to consolidate his own power and to undermine democracy and the rule of law in Hungary.
Many of the tactics he used are part of the authoritarian playbook that is by now all too familiar—eliminating checks and balances on executive authority, taking control over media outlets, and reengineering the electoral system to disadvantage the opposition. Regaining control will enable the opposition to amend the constitution, reverse many of these changes, and rebuild institutions that promote democracy and the rule of law.
Yet, the landslide victory is not only a triumph for Hungary’s democratic opposition and the country’s future trajectory; it is also a major win for Europe, the European Union (EU), Ukraine, and the US.
Hope for a Strong and United Europe
The defeat of Orbán and his nationalist agenda signals to Europe, and to Europeans, that the rise of right-wing populism is not irreversible. Although not yet the dominant trend across the continent, far-right parties such as Orbán’s Fidesz have been gaining ground in Europe since the 2000s and appeared to be building momentum. Moreover, Orbán himself has become an iconic figure among them, exemplifying the success of illiberal democracy. The sweeping electoral victory of the liberal opposition in Hungary has countered this trend and diminished Orbán’s appeal as a model for Europe’s future. Instead, he is a cautionary tale.
Second, Orban’s defeat signals that Hungarians have not rejected either Europe or European values, including liberal democracy. As many European leaders stated following the election results, there is renewed hope for a strong and united Europe.
The primary beneficiary of this reunion—at least in the short run—is Ukraine. Among the many ways in which Orbán has undermined the EU is his refusal to support either further assistance to Ukraine or stricter sanctions against Russia following Russia’s full-scale invasion of Ukraine in February 2022. As part of his electoral campaign, Magyar pledged to rebuild Hungary’s relationship with the EU. He made good on this promise following his victory by agreeing to unblock critical aid in the form of a 90-billion-euro ($103-billion) loan to Ukraine.
Takeaways for the US
The cautionary tale of Orbán’s defeat also suggests a prescriptive one for the United States. Both the large turnout and the substantial margins made the Tisza party’s electoral win too decisive for even Orbán to contest. But neither the size of the turnout nor the landslide victory happened overnight. Albeit weakened by Orban’s policies, Hungarian civil society continued to mobilize undaunted, and Hungarian citizens increasingly took to the streets to show Orban, his loyalists, and most importantly, their fellow citizens that they would not tolerate an autocratic takeover.
The road ahead will be difficult. Orbán not only succeeded in dismantling democratic institutions and the rule of law. He also used his unchecked authority to institute a system of crony capitalism, rewarding loyalists with control over key economic sectors and lucrative development contracts, and destroying Hungary’s economy in the process. In fact, the protests that amalgamated in the opposition’s massive victory focused on anti-corruption and pocket-book issues. So too did Magyar’s electoral campaign, signifying that this is a winning electoral strategy. The new government will have to both rebuild and restore confidence in democratic institutions and the rule of law while actively combating the corrupt practices that have fueled inflation and slowed economic recovery.
This post was written by Pauline Jones, Research Professor and Director of the University of Michigan Center for Political Studies. Pauline Jones is a Professor of Political Science and the Edie N. Goldenberg Endowed Director for the Michigan in Washington Program. She is an expert on politics in the former Soviet Union (including Kazakhstan, Kyrgyzstan and Russia) and on assessing the impact of mass protest in authoritarian regimes. She regularly teaches PoliSci140: Introduction to Comparative Politics and recently shared her insights on US democratic decline in global perspective. Dr. Jones is currently a fellow of the Center for Advanced Study in the Behavioral Sciences (CASBS) at Stanford University.
The 2026 midterm elections are less than a year away, and they will have a powerful influence on the future of American politics. Currently, the Republican party has a “trifecta,” meaning they control the presidency, the House, and the Senate. This suggests they should be able to be able to implement their policy agenda through concerted action.
However, their majorities are slim, and there is a very good chance that the Democrats will gain control of the House after the midterm elections. Republicans currently hold a three-seat majority in the House; if the Democrats gain the majority, there will be increased scrutiny of Trump administration activities through the hearing process, with a high probability of another impeachment of Donald Trump, even if it is unlikely to result in a conviction in the Senate.
How the Midterms Work
Every two years all 435 seats in the House, and one-third of the seats in the Senate, are up for election. Political scientists have developed two distinct models for estimating the outcome of the midterms, based upon evaluations of the current president and the quality of the candidates contesting the election. It is important to note that the participation of incumbents remains unclear in all cases; while 47 House members have indicated they plan to retire so far, for example, there is still time for others to get out. There are slightly more Republicans than Democrats in this group. There are also 11 incumbent Senators who have announced their retirement or intent to run for another office as well (PBS Newshour Analysis).
While there are 435 seats in the House, not all of them are at risk of flipping. Because of redistricting, most districts are safe for one party or the other. In fact, only 36 seats are considered competitive (typically decided by 10 percentage points or less), with half of these considered tossups (New York Times Midterm Elections House Maps). Because of mid-decade redistricting efforts in some states, there are 26 districts with new boundaries and no prior electoral history, although only 11 are considered likely to be competitive.
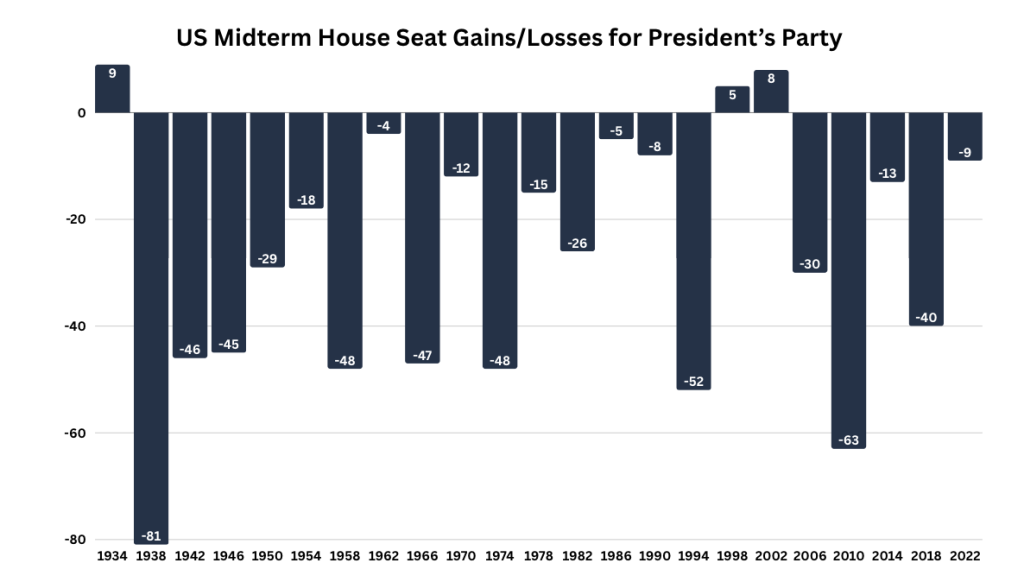
History Disfavors Incumbent Parties
The historical pattern in the House is that the incumbent president’s party loses seats in the midterm election. There have been 20 midterm elections in the post-World War II period, and the president’s party has lost seats in 18 of them. The exceptions were in 1998 when Bill Clinton was being impeached and 2002 after the 9/11 attacks when George W. Bush was in office. The range of losses was from 4 in 1962 in John F. Kennedy’s presidency after the Cuban missile crisis to 63 in 2010 during Barack Obama’s second term, after dissatisfaction with the economy and the debates and passage of the Affordable Care Act. In the 2018 midterm election during Donald Trump’s first term, the Republican party lost 40 seats in the House.
Forecasting
Lewis-Beck and Tien (2025) have developed a model for estimating House seat losses in a midterm election based upon the president’s net approval rating in a Gallup poll (% Approving – % Disapproving) and the change in personal disposable income from the Bureau of Economic Analysis in the previous six months. When this calculation is made in August of the election year, it provides a good estimate of the seat losses in November. Lewis-Beck and Tien made an estimate in October of last year for a seat loss of 28. Since then, Donald Trump’s approval rating has declined, and the model in February now suggests a seat loss of 49. August is still six months away, and both Trump’s approval rating and Americans’ personal disposable income could increase. But it is virtually certain that the Democrats will gain control of the House.
Michael Traugott is a political scientist who studies campaigns and elections, voting behavior, and the impact of mass media on American politics He is the interim director of the Center for Political Studies (CPS) and the author of A Voter’s Guide to the Election Polls, now in its 6th edition. CPS communications manager Tevah Platt assisted in the development of this post.
Democrats had a big night last week, sweeping key elections and winning by unexpected margins up and down the ballot. Voters showed up in high numbers for an “off” election year and sided with Democrats in the elections’ four major contests: The mayor’s race in New York City, the governors’ races in Virginia and New Jersey, and the redistricting measure Prop 50 in California.
Tyler Simko is an Assistant Professor of Political Science at the University of Michigan, and an affiliate of the Center for Political Studies at the Institute for Social Research. Simko specializes in U.S. state and local politics, political geography, and computational social science. He is applying this expertise as an elections analyst for CBS, and he shared with us about the experience of doing this work and the major takeaways from the 2025 elections.
Expert Q&A with CBS Elections Analyst Tyler Simko
The content has been lightly edited for length and clarity.
1. What were your top takeaways from the 2025 elections?
Two specific trends stick out to me.
First, this was a stronger performance for Democrats than many people expected.
The election outcomes were not especially surprising. For all four major races, the expected result going into election day happened—for example, most polls before election day saw Mamdani, Sherrill, Spanberger, and “yes” on Proposition 50 as the clear frontrunners.
However, the final margins in favor of Democrats were larger than many people expected. For example, most polls placed Mikie Sherrill as the favorite, but polling averages showed a lead of around 3-5 percentage points. The ultimate election was a blowout, with Sherrill ahead with a final margin around thirteen points. Abigail Spanberger won the governor’s race in Virginia by even more.
The second major takeaway for me was that early analysis suggests that some of the “red shift” we saw in 2024 among groups like Latinos may have reverted back toward Democrats.
For example, high-Latino communities in New Jersey saw huge reversals toward Sherrill from the way residents in those same places voted in 2024 for Harris.
Results like these suggest that some of the shifts we saw in 2024 may not be set in stone. Charles Stewart III, another election analyst on the team and a Professor at MIT, has suggested this might be evidence that 2024 was a “deviating election,” rather than a new normal, citing research originally developed at the University of Michigan in the 1960s.
2. Was there anything notable about turnout for this election?
Turnout was unusually high in nearly every race on Tuesday night. In some ways, this is surprising because 2025 is an “off” election year without presidential or congressional midterm elections.
However, this high turnout reflects just how salient politics is for many Americans right now.
For example, early voting and election day turnout in the NYC mayoral election eclipsed the last election in 2021. This continued the trend we saw in the primary, where early voting more than doubled turnout in the last primary that elected Eric Adams. Turnout in other races was high as well, like California’s Proposition 50 measure on redistricting.
Further, it’s especially interesting to see where turnout was higher compared to past elections.
Patterns in turnout changes can offer insight into where voters are particularly energized right now.
For example, I wrote for CBS that many Democratic-leaning areas in New Jersey saw huge surges in turnout (some nearly 40% higher than the last gubernatorial election in 2021). This suggests that Democrats are particularly politically motivated right now, a trend that party leaders will hope continues into next year’s midterm elections.
3. What do you do as an Election Analyst on the CBS News Data Desk?
For this past election night on November 4th, I worked in the CBS Office in New York City alongside a team of other analysts to predict and analyze the elections for NYC Mayor, NJ/VA Governor, and California’s Prop. 50 redistricting referendum.
On election night the Data Desk is focused on forecasting voter turnout and predicting election results. We analyze data like exit polls and election returns as they come in, and look for interesting patterns. As with any network, one of our primary roles is to “call” the election winners.
But beyond calling the races, we’re also actively monitoring other data beyond vote shares. For example, the NYC Board of Elections frequently updates their “check-in” turnout numbers throughout the day. We use these records to help improve our turnout forecasts, which help us identify patterns early in the night. For example, even before election night, strong early voting in New Jersey’s Democratic-leaning areas suggested it would be a good night for Mikie Sherrill.
Finally, a good deal of work happens both before and after the elections too. For example, some members of the team prepare products like the CBS Exit Polls in preparation for election day.
Similarly, after election day there is a ton of new data to analyze. For example, the morning after election day, Kabir Khanna (Director, Election Analytics & Technical Systems at CBS) and I wrote an article for CBS News demonstrating how high turnout in Democratic-leaning counties strongly favored Sherrill. We’ll continue conducting this kind of analysis in the coming weeks.
4. What are the goals of this work, and how do your expertise and skills meet the needs of delivering election results and analysis?
Predicting election results (before they happen) and analyzing returns (after they happen) require knowledge of both electoral systems and statistics. At the University of Michigan, I teach courses on American Politics and Political Methodology in the Political Science department and research topics in political institutions and computational social science, so this kind of work is right up my alley. You know, I used real data from election night for an interactive prediction activity in my graduate-level Machine Learning course this past week.
Calling election results is a classic prediction problem. You don’t have complete information before election night is over, but you would like to use statistical “signals” to make data-driven predictions about what is going to happen. Often, we use statistical models because we want to detect patterns over the course of election night that may not be clear from simply counting returns as they come in.
For example, imagine a hypothetical situation where votes for NYC Mayor from Staten Island all come in first, early on election night. A simple “counting” approach would predict Andrew Cuomo had a large lead in the mayoral election because he had strong support in Staten Island, while in reality Mamdani clearly won overall. Statistical models help account for these patterns like geographic segregation in candidate support. Training in both political science and statistics/data science helps.
5. What are the future implications of the 2025 election results?
I think this set of results has two important implications:
First, this strong Democratic win will change the political dynamics over the next year as we head into the midterms. In the meantime, these results also give national Democrats more leverage in ongoing debates like the government shutdown.
We also might see these results change political rhetoric over the next few months. For example, Mamdani’s campaign focused on affordability and we have already seen Trump adopting this language in recent interviews.
The second major signal comes from the strong passage of California’s Proposition 50. This result greenlights Democratic efforts to push back against the new Texas redistricting plan that made their existing gerrymander even more extreme.
Republicans currently have the lead in this redistricting “war” because they have aggressively gerrymandered maps in several states. But, Prop. 50 will likely embolden Democrats in states like Virginia to try gerrymandering their own favorable plans.
Some of my own research helps clarify the consequences of gerrymanders. My co-authors and I at the ALARM Project—a research group focused on political geography and public policy—have shown that gerrymandering makes congressional elections less competitive and less responsive to the will of voters. Our research also shows that these other states could learn from Michigan, as our independent redistricting commission helps ensure redistricting plans are more fair and less biased.
Tyler Simko is an Assistant Professor of Political Science at the University of Michigan, and an affiliate of the Center for Political Studies at the Institute for Social Research. This post was developed by Tyler Simko and Tevah Platt, communications manager for the Center for Political Studies.
Americans have a system of government that is specifically designed so that one guy can’t screw the whole thing up. It hasn’t worked out that way.
Over the last hundred-plus years, we’ve centralized more and more power in the hands of the president, and the success of our system depends more and more on the judgment and character of one man. If the judgment and character of that person is lacking, they can make a big mess very quickly.
If you’re a Republican, you were probably keenly aware of that a couple of years ago, and if you’re a Democrat, you’re probably keenly aware right now.
Who should we blame for runaway presidential power? Well, if you take our founding documents seriously, you shouldn’t blame the presidents. Chief executives are natural predators. Grasping for more power is simply in their nature. If you want to keep them from getting stronger and stronger, then someone has to go out and stop them.
Congress: ‘Your Primary Suspect’
The Constitution sets up several such someones to stop the president, but the big one is Congress, and if you’re going to blame someone for screwing up, Congress has to be your primary suspect, because it has a lot of the best tools for constraining the president.
The president needs the Senate’s consent to appoint most of the major officers in the executive branch. Congress can investigate what the executive is doing and potentially embarrass the president with what it finds. Congress can kick the president out of office if half of the House and two-thirds of the Senate are on board. And, most importantly of all, Congress has the right to make laws that tell the president what he must do, what he can do, and what he can’t do.
The problem is that Congress’s trump card of passing laws is not as not effective as it looks on paper. When Congress passes a law to rein in the president, the president can veto it. And to override that veto, you need 2/3 of the Senate and 2/3 of the House. Remember, impeaching the president requires only 2/3 of the Senate and half of the House. So, mechanically, it’s actually easier to kick the president out of office than to pass a law that reins in his power.
For practical purposes, this means that if the president makes a power grab, Congress can’t stop him unless there is a broad, bipartisan consensus. Members of the president’s own party need to be willing to tangle with him, and the problem with that is that it’s political suicide.
Also Responsible: Voters who Tune Out Congress
The president is the face of the party. Most voters have only a dim idea of who their member of Congress is and what they’re doing. Pop quiz: Do you know the name of the person who represents you in the House of Representatives? Can you name or describe any bill that that person introduced or cosponsored? Probably the biggest vote in the 2023-2024 cycle was the Fiscal Responsibility Act, the bill that made spending cuts in exchange for raising the debt ceiling. Do you know how your representative voted on that bill?
Congressional elections are rarely decided based on how voters feel about that member of Congress, because they usually don’t know enough to have strong feelings.
The only politician that they really know is the president, so insofar as their decision about whether to vote and who to vote for is at all predicated on what’s happening in Washington, it’s usually predicated on how they feel about the president.
If the president is popular and successful, members of Congress from their party will do well too. And if the president is going down, a lot of the party’s congresspeople are going down with him.
If you want a great illustration, just look at the last time a party took on their president in a sustained and serious way. In the wake of the Watergate scandal, congressional Republicans joined with Democrats to force Richard Nixon to resign and pass landmark legislation that seriously curbed presidential power. Then, in the 1974 elections, voter outrage over Watergate produced one of the biggest Democratic landslides in history. Ironically, but maybe not surprisingly given how little voters know about what their members are doing, this landslide swept away quite a few Republicans who had played important roles in getting rid of Nixon.
So you can’t really take a swing at a president from your party without hurting yourself and your whole party. And I think that’s why you see a lot of people who clearly don’t like what the president is doing keep quiet and don’t do anything to stop him.
Mitch McConnell, Paul Ryan, John Thune, and a lot of other senior, powerful congressional Republicans pretty obviously never cared for Trump. But I think they calculated that an open conflict between Trump and congressional Republicans would sink the whole party and hand the country over to the Democrats, and they weren’t willing to do that. If you want to know why congressional Democrats continued to insist that Biden was fit to lead even when it was obvious that he wasn’t, same deal.
I understand the appeal of blaming American political dysfunction on Congress. But I don’t think that gets at the root causes. They’re responding to the political incentives that we the voters create.
The Founding Fathers assumed that the people would feel more connected with their member of Congress than with the president. We don’t. We’re not interested. Our fixation on the president has put Congress in a tough spot.
If you want to understand how we’ve moved to this system where we depend so much on the judgment and character of one man and how we can get out of it, I think you have to consider that the problem is us.
This expert opinion piece by Christian Fong is based on his presentation at the second 2025 teach-in organized by University of Michigan faculty examining “US Democracy in Peril: National and Global Implications.” The event was held March 19, 2025, in the U-M Chemistry Building. Dr. Fong specializes in the study of the United States Congress. Before coming to Michigan, he was an American Political Science Association Congressional Fellow, where he served as an economic policy advisor to Senator Mike Lee. Tevah Platt of the Center for Political Studies contributed to the development of this post. Read more on the recent teach-ins from the CPS Blog.
Faculty from the University of Michigan offered their expertise on these issues at a February “teach-in” panel at Angell Hall to help students understand how recent policy changes have been made and why they matter for democracy.
So how did we get to this point? And where do electoral politics go from here?
At the February teach-in, political scientist Robert Mickey highlighted the role of America’s history of white supremacy and focused on the story of party elites, and the evolution of the Republican Party “from the mainstream, conservative party committed to democracy, into something very different.”
Republican Radicalization
Robert Mickey’s account began with the observation that US democracy is young, given its slow, historical turn to secure voting rights for all adults and the civil rights and liberties needed to make elections free and fair. Following the Civil War, efforts to build a biracial democracy were eventually turned back, with Jim Crow segregation in much of the country underwritten by state-sponsored violence. As Mickey describes in his book, Paths Out of Dixie: The Democratization of Authoritarian Enclaves in America’s Deep South, 1944-1972, the 11 states of the Confederacy remained enclaves of authoritarian rule, sustained by the federal democracy and the national Democratic Party, with Democrats “maintaining a stranglehold on nearly every elected office in the region for seven decades.” America’s history of racist and xenophobic appeals to white voters should make the current wave of party-led democratic backsliding less surprising, said Mickey.
The rooster icon and banner, “White Supremacy for the Right,” served as the emblem of the Alabama Democratic Party from 1904 to 1966.
The current threat to American democracy has links to the authoritarianism of the preceding century but with novel features. Focusing on the last one-half century of stable democratic rule, Mickey argued that three trends have combined in recent decades to lead us to today’s challenging moment.
The first is elite polarization. The move of culturally conservative Southern whites to the Republican Party in the 1970s widened partisan disagreement, and that party’s members of Congress have become much more extreme over time. Following their elites, growing numbers of voters have viewed the opposing party with increasing social antipathy, hatred, and distrust. And with Congress passing fewer bills every year, voters have become more tolerant of antidemocratic behavior by their own party’s politicians, Mickey said.
Second, increasing economic inequality over recent decades has motivated the rich to defend their wealth, principally through massive campaign contributions. This “wealth defense” has transformed the Republican party; its mega-donors have demanded radical cuts to the regulation of business, the decimation of popular government programs, and the nomination of judges who support these goals.
Neither of these trends alone necessarily threaten democracy, said Mickey, but they have dangerously combined with “a growing panic about the country’s ‘ownership’ among millions of white Americans.” That panic is worsened by the country’s approaching “majority minority” milestone and the “reaction of many whites to the mere fact of Obama’s presidency.”
The result: Republicans, constrained by their donors from changing their economic appeals to white voters, have opted to invoke cultural issues. The precursor to MAGA is the Tea Party revolt of grassroots conservatives more than a decade ago who “talked a good game about being upset about budget deficits and debt” but were actually much more united on and energized by the issue of immigration, said Mickey.
“These trends have combined to radicalize the Republican Party into an organization that’s no longer committed to democracy,” said Mickey. “Right now, it’s an uneasy combination of white nationalism and libertarianism.”
We now see evidence that the party is backing away from democracy in several ways: Since 2000, state-level Republicans have worked to make it harder to vote, Mickey said. Second, a large majority of House Republicans refused to certify Biden’s election, even after the invasion of the Capitol. Third, Republicans now in Congress have refused to conduct oversight of the executive when their own party leader occupies the White House.
Where Do We Go From Here?
Looking ahead, Mickey closed on the point that an organizationally “hollow” Democratic party – in his view, a “feckless gerontocracy” that failed to strengthen even modestly the Voting Rights Act in 2022 – can’t save U.S. democracy. Even more important, in a two-party system, both parties have to be committed to democratic rule. As political scientist Adam Przeworski tells us, democracy is “a system in which parties lose elections.” For Przeworski, democracies remain stable only when its major parties accept the results of elections, content to pursue office another day.
“Republican [candidates] who lose their races are increasingly likely not to concede,” said Mickey. “Thus, the Republican party has to remake itself for American democracy to be safe.”
“That will probably require multiple defeats to reset their incentives,” said Mickey. A party committed to democracy must be strong enough internally “to push out their extremists: The Nazis, the Kanyes, the Jewish-space-laser believers, and they need to take their oversight responsibility seriously…. Democracy-loving conservatives don’t have the party home that they deserve, and they need to rebuild one immediately.”
Robert Mickey is an associate professor in the Department of Political Science at the University of Michigan. Vincent Hutchings is the Hanes Walton Jr. Collegiate Professor in Political Science and Afroamerican and African Studies. Both are affiliated with the Center for Political Studies at the University of Michigan Institute for Social Research.
This post is part of a series that focuses on the 2025 teach-in held at Angell Hall that also marked the 60th anniversary of the first teach-in convened in the United States, held at the University of Michigan during the Vietnam War protests of 1965. Recordings of the talks are available on YouTube.
This post was written by Tevah Platt of the Center for Political Studies, with contributions from Robert Mickey. The second of two complimentary posts on this topic, Vincent Hutchings shared the key insight in Pt. 1 that U.S. election outcomes often hinge on attitudes toward salient social groups, and, especially, Black Americans.
Faculty from the University of Michigan offered their expertise on these issues at a “teach-in” panel at Angell Hall this month. The aim was to help students understand how recent policy changes have been made and, in the words of organizer Josh Pasek, “why those processes matter for whether or not we remain a democracy.”
So how did we get to this point?
This is the first of two posts that will answer this question.
Teach-in presentations by political scientists Vincent Hutchings and Robert Mickey gave complimentary accounts: Speaking on American public opinion, Hutchings shared the key insight that U.S. election outcomes often hinge on attitudes toward salient social groups, and, especially, Black Americans.
Mickey’s talk, the subject of our forthcoming post (Part 2), focused on the story of party elites, and the evolution of the Republican Party “from the mainstream, conservative party committed to democracy, into something different.”
The Racial Divide
Decades of research on American public opinion may help us to understand the results of this election and others, Hutchings said, by correcting a common assumption that Americans pay attention to politics and cast votes based on ideology and policies.
“American voters are woefully uninformed about politics,” Hutchings said. Only about 20% of voters are familiar with the ideological terms ‘liberal’ and ‘conservative,’ and a significant minority – maybe even a majority, depending on how you count– don’t know which party is the more conservative party. “You might think that is hyperbole,” said Hutchings. “I assure you, it is not.”
The perspective they do employ, said Hutchings, is one that focuses on “salient social groups.”
(Of note, the American National Election Studies, which has surveyed voters in every election since 1948, is a leading source of what we know about the U.S. electorate; Hutchings was a former principal investigator on the project.)
Politicians play to grievances, fears, and stereotypes, leveraging divisions based on race, religion, gender, and sexuality to build coalitions.
“Perhaps the most salient social group– certainly the most persistent and consistent in terms of its political impact– has been racial groups: In particular, attitudes about Black Americans,” said Hutchings. “It is, after all, the issue around which we had the bloodiest war in American history, the Civil War. It’s the group around which we had the largest social movement in the 20th century: The Civil Rights Movement. And it’s the issue around which we had the largest social movement of the 21st century: Black Lives Matter.”
“The racial divide is the biggest divide in American politics,” said Hutchings. It is the foundation of our current party system that, since the 1960s, has pitted one party that was “mostly the champion of civil rights, sometimes reluctantly,” against the party that was not.
“I’m not here to make a moral claim,” said Hutchings, “but I am here to make a factual claim that race is the chief dividing point in American politics. …If we want to get a sense of how we arrived at this point we’re at now in our political collective lives, we can’t ignore race.”
Where Do We Go From Here?
To win future elections, Democrats would need to mobilize non-white voters without alienating white voters, while Republicans will confront the “diminishing number of angry white men,” said Hutchings. We can expect politicians to continue to prey on social divisions in the electorate: “They’re going to keep doing it as long as you keep responding to it,” he said.
Vincent Hutchings is the Hanes Walton Jr. Collegiate Professor in Political Science and Afroamerican and African Studies. Robert Mickey is an associate professor in the Department of Political Science at the University of Michigan. Mickey, Hutchings, and Pasek are all affiliated with the Center for Political Studies at the University of Michigan Institute for Social Research.
This post is part of a series that focuses on the 2025 teach-in held at Angell Hall that also marked the 60th anniversary of the first teach-in convened in the United States, held at the University of Michigan during the Vietnam War protests of 1965. Recordings of the talks are available on YouTube.
This post was written by Tevah Platt of the Center for Political Studies, with contributions from Vincent Hutchings and Robert Mickey.


 Michael Traugott is a political scientist who studies campaigns and elections, voting behavior, and the impact of mass media on American politics He is the interim director of the Center for Political Studies (CPS) and the author of


 This expert opinion piece by Christian Fong is based on his presentation at the second 2025 teach-in organized by University of Michigan faculty examining “US Democracy in Peril: National and Global Implications.” The event was held March 19, 2025, in the U-M Chemistry Building.

