Mar 30, 2017 | ANES, Elections
Post developed by Catherine Allen-West, Megan Bayagich and Ted Brader
 The initial release of the 2016 American National Election Studies (ANES) Time Series dataset is approaching. Since 1948, the ANES- a collaborative project between the University of Michigan and Stanford University- has conducted benchmark election surveys on voting, public opinion, and political participation. This year’s polarizing election warranted especially interesting responses. Shanto Iyengar, one of the project’s principal investigators and Stanford professor of political science, noted, “The data will tell us the extent to which Trump and Clinton voters inhabit distinct psychological worlds.”
To learn more about the study, we asked Ted Brader (University of Michigan professor of political science and one of the project’s principal investigators) a few questions about this year’s anticipated release.
When was the data collected?
The study interviewed respondents in a pre-election survey between September 7 and November 7, 2016. Election day was November 8. The study re-interviewed as many as possible of the same respondents in a post-election survey between November 9 and January 8, 2017.
The ANES conducted face-to-face and internet interviews again for 2016. How are these samples different from 2012? What are the sample sizes and the response rates?
The study has two independently drawn probability samples that describe approximately the same population. The target population for the face-to-face mode was 222.6 million U.S. citizens age 18 or older living in the 48 contiguous states and the District of Columbia, and the target population for the Internet mode was 224.1 million U.S. citizens age 18 or older living in the 50 U.S. states or the District of Columbia. In both modes, the sampling frame was lists of residential addresses where mail is delivered, and to be eligible to participate, a respondent had to reside at the sampled address and be a U.S. citizen age 18 or older at the time of recruitment.
The response rate, using the American Association for Public Opinion Research (AAPOR) formula for the minimum response rate on the pre-election interview, was 50 percent for the face-to-face component and 44 percent for the Internet component. The response rate for the face-to-face component is weighted to account for subsampling during data collection; due to subsampling for the face-to-face mode, the unweighted response rate would not be meaningful.
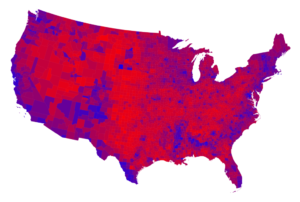
Photo Credit: Mark Newman (University of Michigan)
The re-interview rate on the post-election survey was 90 percent for the face-to-face component and 84 percent for the Internet component.
Are there any other aspects of the design that you think are particularly important?
I’d emphasize the effort to collect high quality samples via both in-person and online interviews for the whole survey as obviously the most important design aspect of the 2016 study, helping us to learn more about the trade-offs between survey mode and potential benefits of mixed mode data collection.
Are there any new questions that you think users will be particularly interested in?
Along with many previous questions that allow researchers to look at short and long term trends, we have lots of new items related to trade, outsourcing, immigration, policing, political correctness, LGBT issues, gender issues, social mobility, economic inequality, campaign finance, and international affairs.
What do you think some of the biggest challenges were for the 2016 data collection?
 With increasing levels of polarization and a highly negative campaign, some Americans were much more resistant to participating in the survey. Many seemed to feel alienated, distrustful, and sick of the election. Under these circumstances, we worked hard with our partners at Westat to overcome this reluctance and are pleased to have recruited such a high quality sample by Election Day.
What are you most excited about when you think of the 2016 ANES?
The 2016 contest was in many ways a particularly fascinating election, even for those of us who usually find elections interesting! The election ultimately centered on two highly polarizing candidates, and people of many different backgrounds felt a lot was at stake in the outcome. Thus, not surprisingly, there was energetic speculation throughout the year about what voters were thinking and why they supported Clinton or Trump. The 2016 ANES survey provides an incredibly rich and unparalleled set of data for examining and testing among these speculations. I expect it will take some time to arrive at definitive answers, but I’m excited to release this wealth of evidence so the search for the truth can begin in earnest.
Is there anything else you’d like to share?
I would note that future releases will include redacted open-ended comments by respondents, numerical codings of some of the open-ended answers, and administrative data (e.g., interviewer observations, timing, etc.).
For more information about ANES please visit electionstudies.org and follow ANES on Twitter @electionstudies
Mar 17, 2017 | Current Events, Foreign Affairs, International
by Christopher Fariss and Kristine Eck

Christopher Fariss, University of Michigan and Kristine Eck, Uppsala University
Debate persists inside and outside of Sweden regarding the relationship between immigrants and crime in Sweden. But what can the data actually tell us? Shouldn’t it be able to identify the pattern between the number of crimes committed in Sweden and the proportion of those crimes committed by immigrants? The answer is complicated by the manner in which the information about crime is collected and catalogued. This is not just an issue for Sweden but any country interested in providing security to its citizens. Ultimately though, there is no information that supports the claim that Sweden is experiencing an “epidemic.”
In a recent piece in the Washington Post, we addressed some common misconceptions about what the Swedish crime data can and cannot tell us. However, questions about the data persist. These questions are varied but are related to two core issues: (1) what kind of data policy makers need to inform their decisions and (2) what claims can be supported by the existing data.
Who Commits the Most Crime?
Policymakers need accurate data and analytical strategies for using and understanding that data. This is because these tools form the basis for decision-making about crime and security.
When considering the reports about Swedish crime, certain demographic groups are unquestionably overrepresented. In Sweden, men, for example, are four times more likely than women to commit violent crimes. This statistical pattern however has not awoken the same type of media attention or political response as other demographic groups related to ethnicity or migrant status.
Secret Police Data: Conspiracy or Fact?
In the past, the Swedish government has collected data on ethnicity in its crime reports. The most recent of these data were analyzed by the Swedish National Council for Crime Prevention’s (BRÅ) for the period 1997-2001. The Swedish police no longer collect data on the ethnicity, religion, or race of either perpetrators or victims of crime. There are accusations that these data exist but are being withheld. Such ideas are not entirely unfounded: in the past, the Swedish police have kept secret—and illegal—registers, for example about abused women or individuals with Roma background. Accusations about a police conspiracy to suppress immigrant crime numbers tend to center around the existence of a supposedly secret criminal code used to track this data. This code is not secret and, when considered, reveals no evidence for a crime epidemic.
For the period of November 11, 2015 through January 21, 2016 the Swedish police attempted to gauge the scope of newly arrived refugees involvement in crime, as victims, perpetrators, or witnesses. It did so by introducing a new criminal code—291—into its database. Using this code, police officers could add to reports in which an asylum seeker was involved in an interaction leading to a police report. Approximately 1% of police reports filed during this period contained this code. It is important to note here that only a fraction of these police incident reports actually lead to criminal charges being filed.
The data from these reports are problematic because there are over 400 criminal codes in the police’s STORM database, which leads to miscoding or inconsistent coding. Coding errors occur because the police officers themselves are responsible for determining which codes to enter in the system. The police note that there was variation in how the instructions for using this code were interpreted. The data show that 60% of the 3,287 police reports filed took place at asylum-seeker accommodation facilities, and that the majority of the incidents contained in these reports took place between asylum seekers. Are these numbers evidence of a crime epidemic?
Is there any Evidence for Crime Epidemic in Sweden?
If asylum-seekers are particularly crime-prone, then we would expect to see crime rates in which they are overrepresented relative to how many are living in Sweden. Sweden hosted approximately 180,000 asylum-seekers during this period and the population of Sweden is approximately 10 million. Therefore, asylum-seekers make up approximately 1.8% of the people living in Sweden, while 1% of the police reports filed in STORM were attributed to asylum-seekers.
While the Code 291 data are problematic because of issues discussed above, the data actually suggests that asylum seekers appear to be committing crime in lower numbers than the general population and does not provide support for claims of excessive criminal culpability. There were four rapes registered with code 291 for the 2.5 month period, which we find difficult to interpret as indicative of a “surge” in refugee rape. We in no way want to minimize the impact that these incidents had on the individual victims, but considering wider patterns, we consider a rate of four reports of rape over 76 days for a asylum-seeking population of 180,000 as not convincing evidence of an “epidemic” perpetrated by its members.
There is no doubt that crime occurs in Sweden. This is a problem for Swedish society and an important challenge for the government to address. It is a problem shared by all other countries. There is also no doubt that refugees and immigrants have committed crimes in Sweden, just as there is no doubt that Swedish-born citizens have committed crimes in Sweden as well. But if policy initiatives are to focus on particular demographic groups who are overrepresented in crime statistics, then it is essential that the analysis of the crimes committed by members of these groups be based on careful data analysis rather than anecdotes used for supporting political causes.
The Government of Sweden’s Facts about Migration and Crime in Sweden: http://www.government.se/articles/2017/02/facts-about-migration-and-crime-in-sweden/
Christopher Fariss is an Assistant Professor of Political Science and Faculty Associate at the Center for Political Studies at the University of Michigan. Kristine Eck is Associate Professor at the Department of Peace and Conflict Research at Uppsala University.