If Rick Snyder weren’t the Governor of Michigan, Donald Trump would probably have 16 fewer electoral votes. I say this not because I think Governor Snyder did anything improper, but because Michigan law provides a small electoral benefit to the Governor’s party in all statewide elections; candidates from that party are listed first on the ballot.
Yesterday, Donald Trump was declared the winner in Michigan by a mere 10,704 votes, out of nearly 5 million presidential votes cast. Although this is not the smallest state margin in recent history – President Bush won Florida and the election by 537 votes and Al Franken won his senate seat in Minnesota by 225 (after the result flipped in a recount) – it represented a margin of 0.22%. The best estimate of the effect of being listed first on the ballot in a presidential election is an improvement of the first-listed individual’s vote share of 0.31%. Thus, we would expect Hillary Clinton to have won Michigan by 0.4% if she were listed first and about 0.09% if neither candidate were consistently listed in the first position.
It may seem surprising to suggest that anyone’s presidential vote would hinge on the order of candidates’ names, but the evidence is strong. In a paper I published with colleagues in Public Opinion Quarterly in 2014, we looked at name order effects across 76 contests in California – one of the few states that rotates the order of candidates on the ballot – to estimate the size of this benefit. We later replicated the results in a study of North Dakota. Both times, we found that first-listed candidates received a benefit and that the effect was present, though smaller, at the presidential level.
There are many reasons that voters might choose the first name, even if they started their ballots without a predetermined presidential candidate. Some individuals might have been truly ambivalent and selected the first name they had heard of (in this case, “Trump”), others may have instead checked the first straight party box – listed in a similar order – without intending to select our new President-elect. Regardless of the cognitive mechanisms involved, the end result is clear – the “will” of the voters can be diverted by seemingly innocuous features of ballot design.
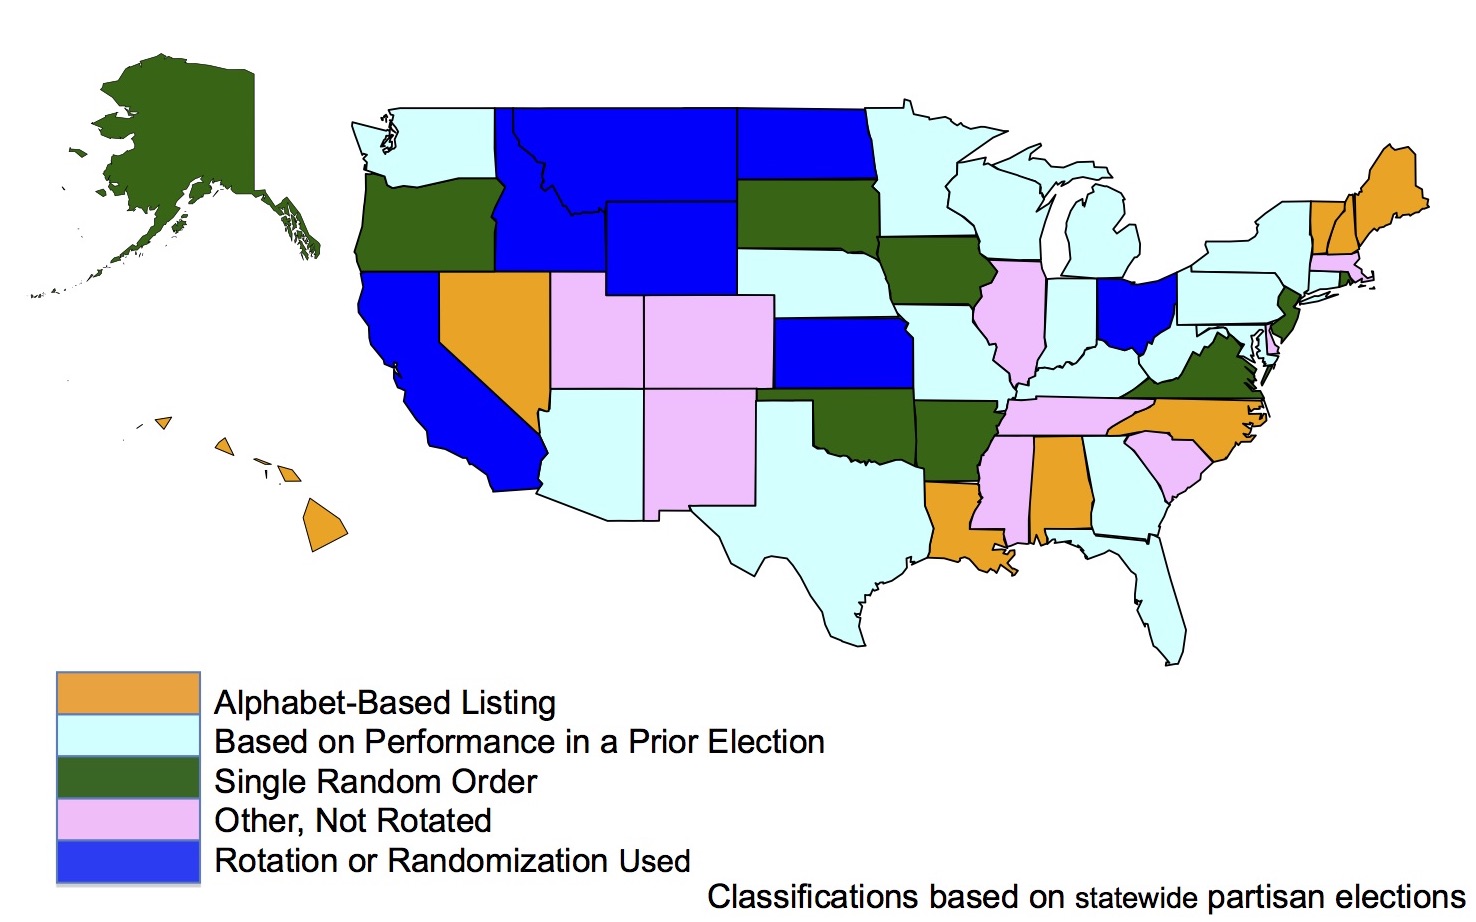
How broadly is this first-position benefit a problem? Across the country, only seven states vary the order of candidate names across precincts. Another nine choose a single random order for listing candidates in each contest, but use that same order across the entire state. And the rest generally use some combination of alphabetic ordering or a listing based on who won in prior elections at the state level. Michigan’s system – prioritizing the candidate who last won the Governor’s office – is among the most common methods.
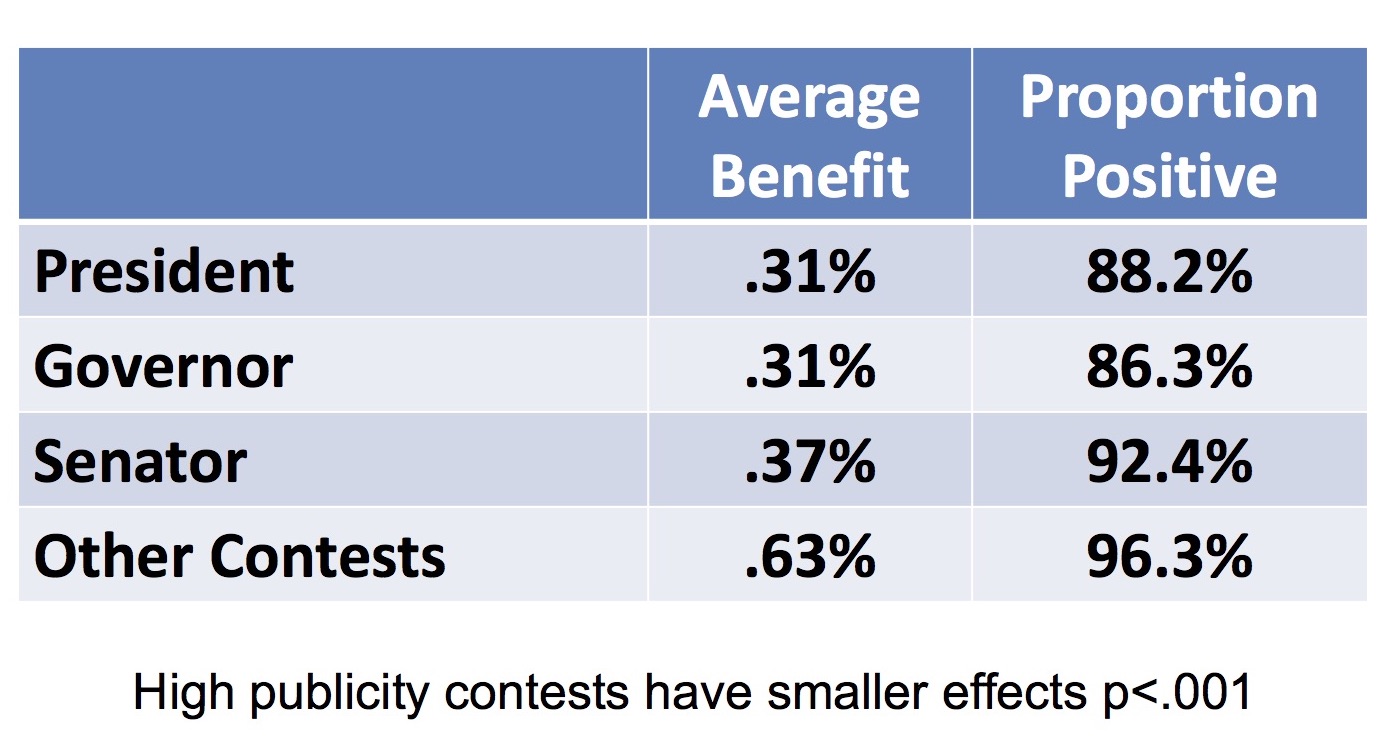
Given the control that Republicans currently hold over governorships, this bias likely helps Republicans maintain their dominance over many state legislatures. And the effects of being listed first only grow as you move down the ballot. In our study of California, we found the average benefit for a Governor was also 0.31 percent*, Senators gained 0.37 percentage points of additional votes, and candidates for other statewide offices gained an average of 0.63 percentage points.
Source: Prevalence and moderators of the candidate name-order effect evidence from statewide general elections in California Pasek J., Schneider D., Krosnick J.A., Tahk A., Ophir E., Milligan C. (2014) Public Opinion Quarterly, 78 (2) , pp. 416-439.
For a better answer, we might look to the strategy adopted by Michigan’s neighbor to the South. Ohio produces a unique ballot for each precinct where the ordering of candidates’ names is rotated. Although it is too late to prevent this effect from altering the 2016 election, it may have less of an impact if everyone were not filling out ballots with the same candidates listed first.
*this would likely be larger if California did not elect its Governors in non-presidential years.
With the U.S. Presidential Election just a day away, both campaigns have amped up their rhetoric to solidify support among their bases. Hillary Clinton is making her case for bringing America together and Donald Trump is using his platform to rally against a rigged system.
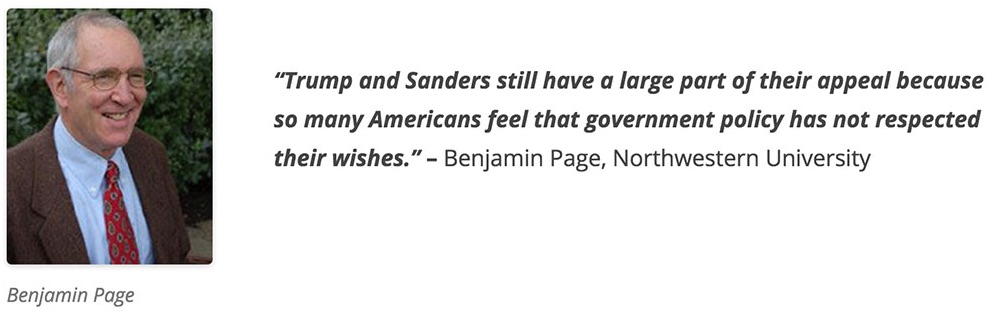
Trump’s claims of a rigged, or out-of-touch, political system seems to resonate with his base, a group of Americans that feel ignored and underrepresented by their current leaders. These sentiments are not just unique to Republicans. During the primaries, Bernie Sanders gained mass appeal with progressive Democrats as he trumpeted the idea that wealthy donors exert far too much influence on the U.S. political system.
The enthusiasm for both Trump and Sanders’ messages about the influence of money in politics brings up an important question: Is policy driven by the rich, or does government respond to all? Political scientists have long been interested in identifying to what degree wealth drives policy, but not all agree on it’s impact.
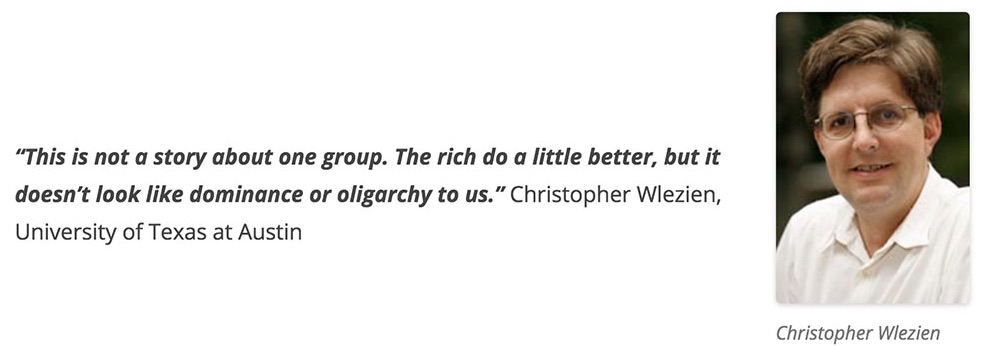
Benjamin Page, Northwestern University Professor of Decision Making, and Christopher Wlezien, Professor of Government at the University of Texas at Austin, have both conducted illuminating research on the influence of affluent Americans on policy change. Recently, Page and Wlezien discussed their latest findings at the University of Michigan’s Center for Political Studies. The two scientists drew on results from their own work as well as analysis of data from Martin Gilens. The Gilens data is unique, in that, it documents public opinion on 1,800 issues from high, middle and low income groups over a long period of time (1964-2006).
Page and Wlezien looked at the same data but the results of their analyses produced two opposite viewpoints. Page contends that when it comes to policy change, average citizens are being thwarted by America’s “truly affluent”- multi-millionaires and billionaires- who are much more likely to see their preferences reflected in policy decisions. By comparison, Wlezien suggests that there isn’t pervasive disagreement or major inequality of representation between groups and that a large driver of policy change is the convergence of preferences between groups. In other words, when groups agree on an issue, policy change is most successful.
Affluence and Influence
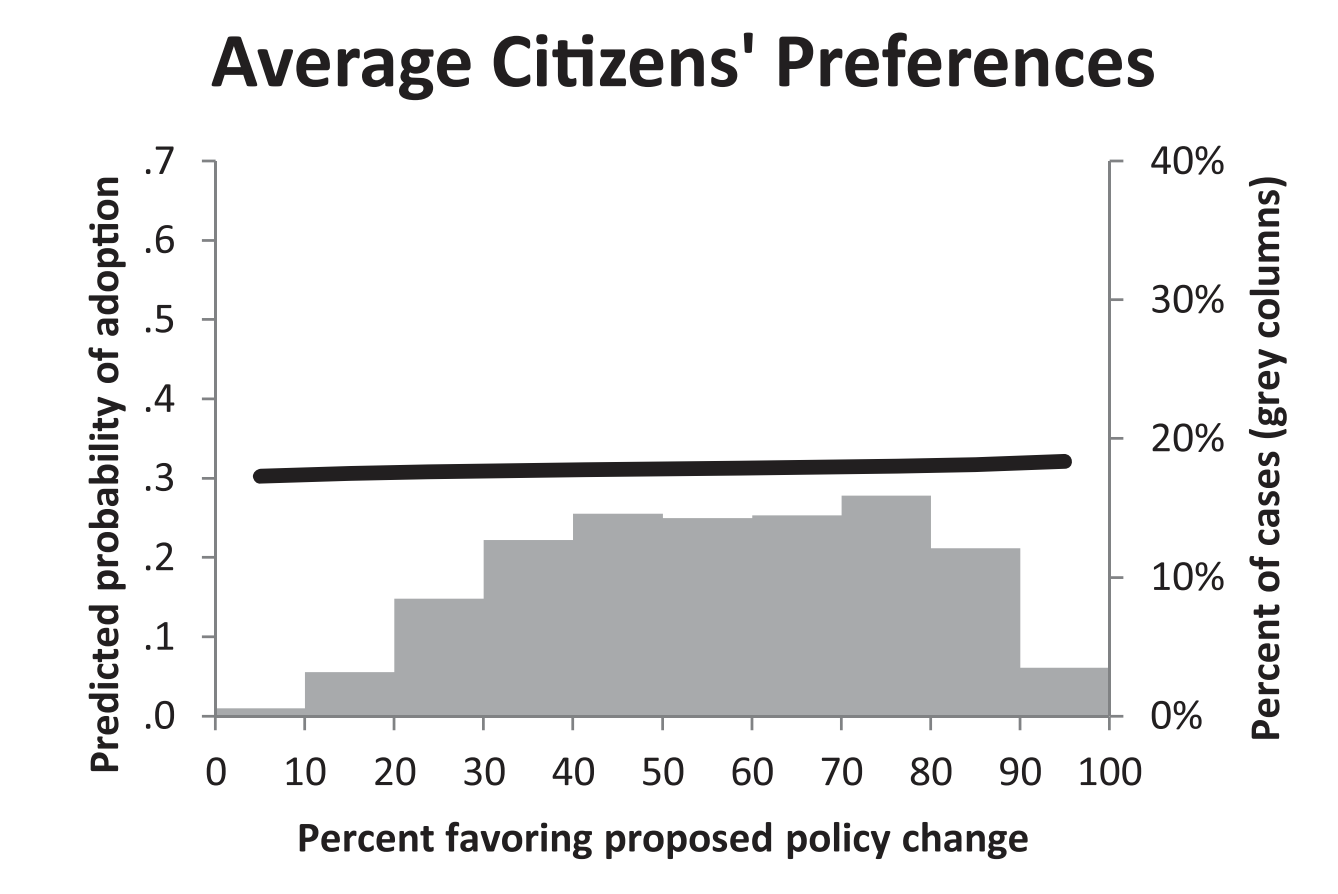
First, it’s important to know what the Gilens data says about how much influence an average American has on policy. According to Page, average citizens have little influence even when a policy is clearly supported by a majority of Americans. He illustrated his point with the graph below. Even when 80% of average Americans favor a policy change, they’re only getting it about 40% of the time.
Predicted probability of policy adoption (dark lines, left axes) by policy disposition; the distribution of preferences (gray columns, right axes). Source: Gilens, M. and Page, B.I. (2014) ‘Testing Theories of American Politics: Elites, Interest Groups, and Average Citizens’, Perspectives on Politics, 12(3), pp. 564–581. doi: 10.1017/S1537592714001595.
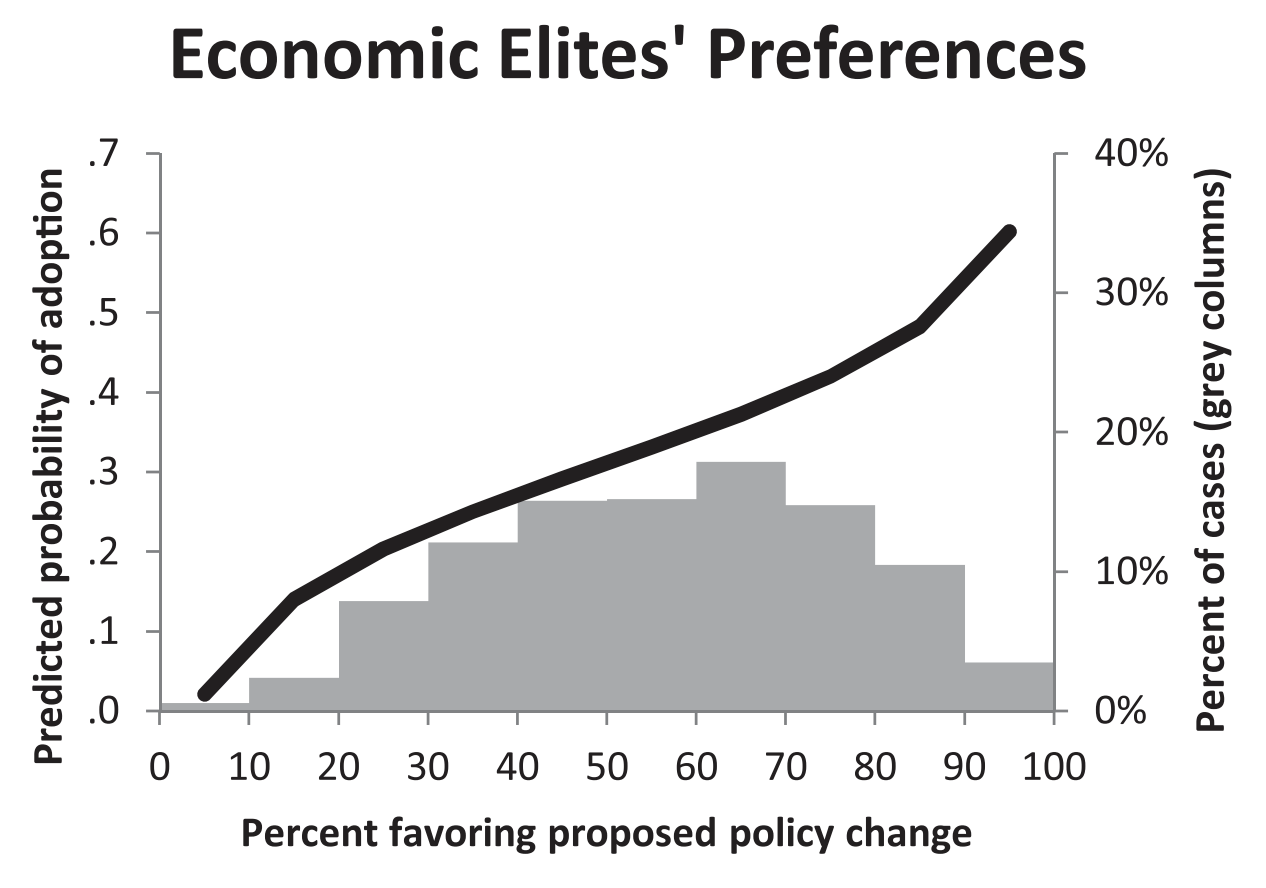
This is extremely important, Page says, because “in a changing world when policy change, in many people’s minds, is really needed on a whole bunch of areas” the public’s influence is being thwarted in a major way. Furthermore, Page argues that a small group of top income earners in America are more likely to see their preferences reflected in policy change, by a large margin.
Source: Gilens, M. and Page, B.I. (2014) ‘Testing Theories of American Politics: Elites, Interest Groups, and Average Citizens’, Perspectives on Politics, 12(3), pp. 564–581. doi: 10.1017/S1537592714001595.
Wlezien’s analysis paints a different picture.
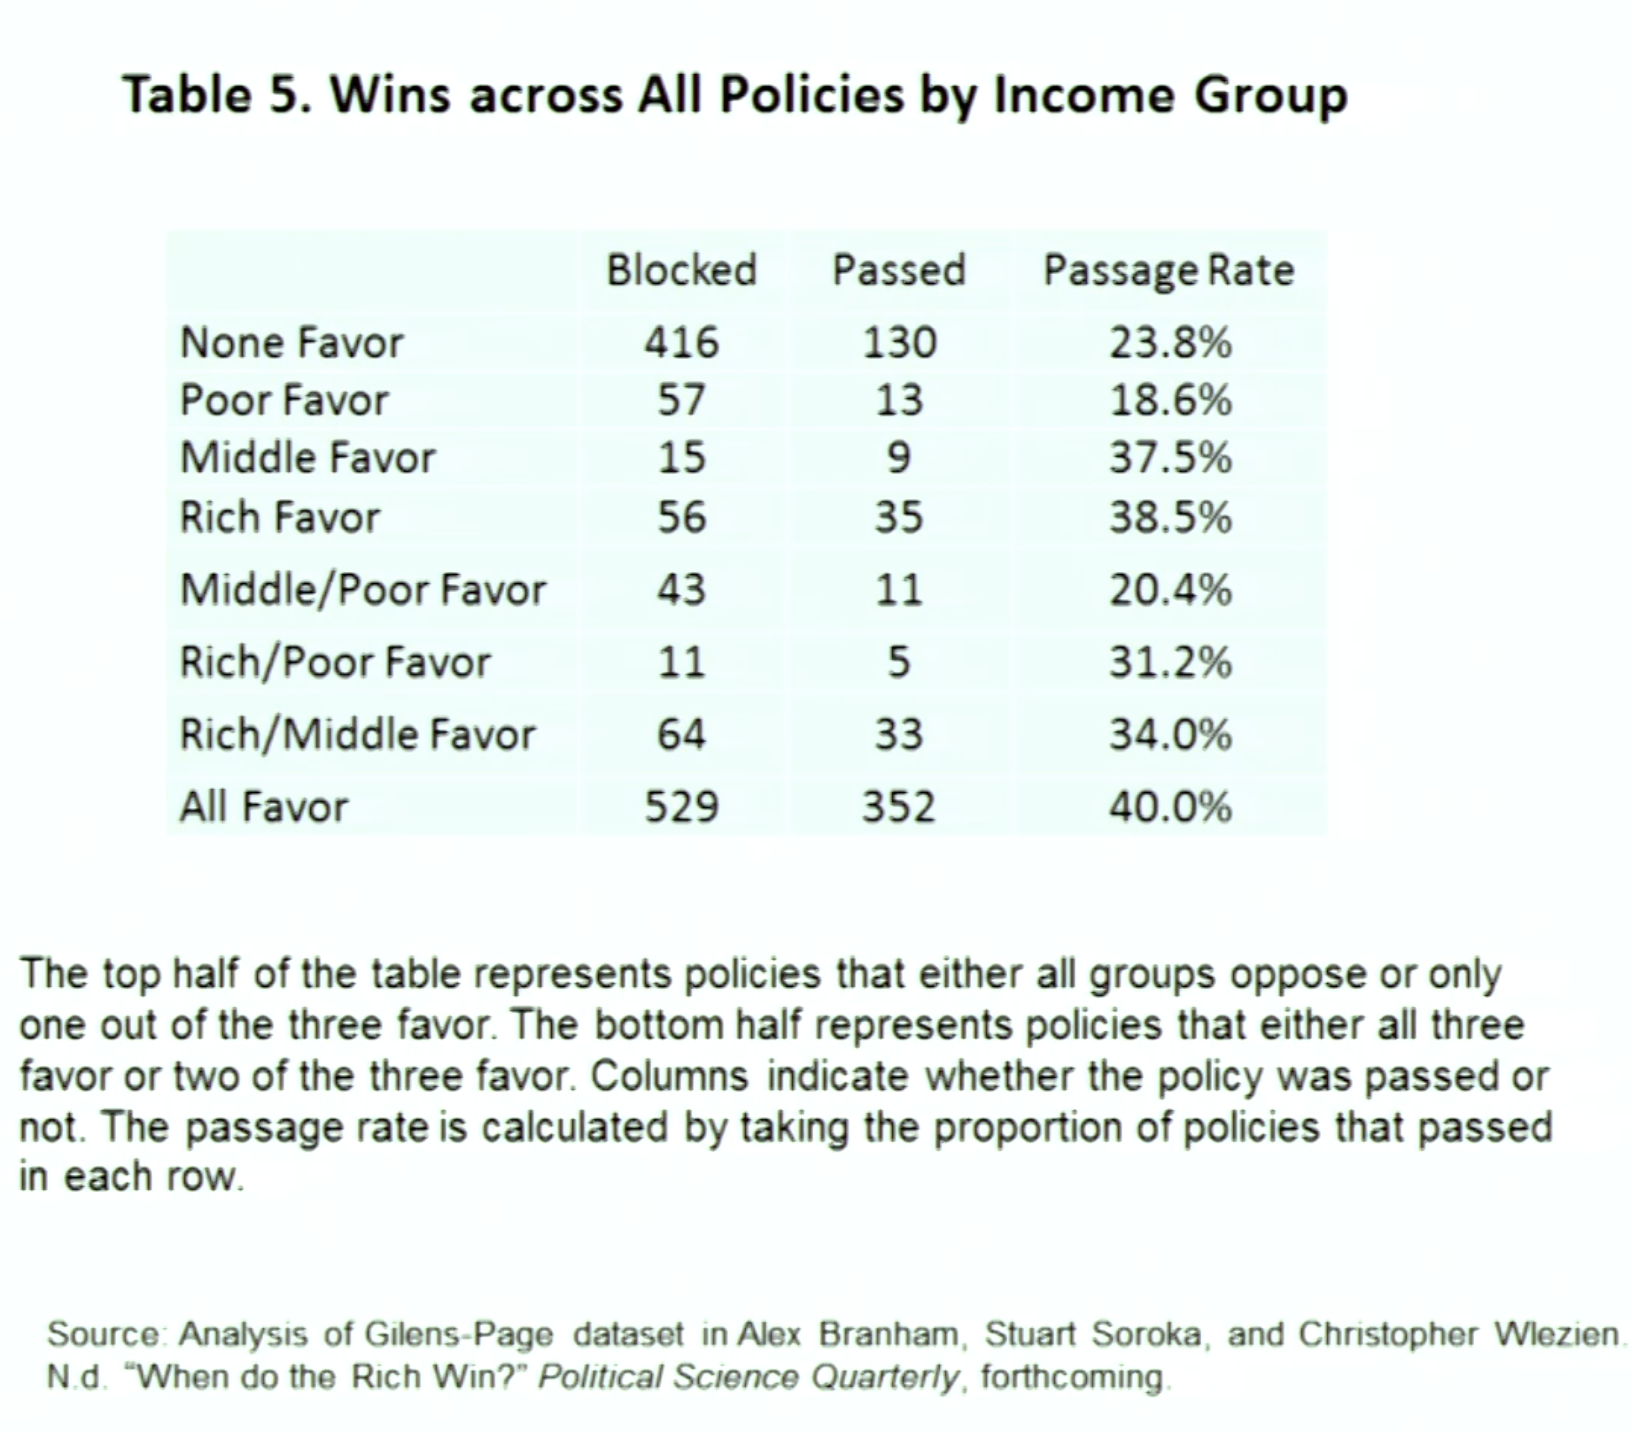
Wlezien used Gilens’ data (in When do the Rich Win?) to assess congruence between policy decisions and preferences for that policy across income groups. His results show that when the rich want something, the middle and the poor are more likely to want it as well, reiterating his claim that policy change does not favor one income group over another in a significant way. Additionally, even when the middle and high income groups disagree, Wlezien contends that “it’s still a coin flip as to whether the policy passes or not.”
Policy Support for High and Middle Income Groups: Wlezien found, that across all of the issues from the Gilens data, there is little disagreement or inequality between group preferences reflected in policy change.
That’s not to say there’s total equality among all income groups. According to Wlezien’s analysis, it’s the poor who are losing out most of the time when it comes to their preferences being reflected in policy change. In fact, when the poor by themselves favor a policy, it has the lowest rate of success at 18.6%. To put that in perspective, when NO ONE favors a policy, the policy still has a 23.8% passing success rate.
This is a recurring theme. As Wlezien points in the clip above, middle and high income group policy preferences are relatively similar most of the time, the real difference is between those two groups and the lower income group.
Democracy by Coincidence
If it’s the case the average Americans agree with affluent Americans a majority of the time, maybe their lack of influence doesn’t matter that much. If ordinary Americans are getting what they want a good amount of the time, should they care if the affluent truly do wield more influence?
Page says yes, they should absolutely care.
Furthermore, Page argues that what “the truly wealthy”- multi-millionaires and billionaires -want from government policy is quite different from what average people do.
While Page and Wlezien clearly offer two different takeaways from this data, they both agree that the influence of money in politics deserves further research to parse out who, if anyone, is being thwarted by the current political process and to identify the ways all citizens can ensure that the government responds equally to their needs.
WATCH: Benjamin Page and Christopher Wlezien Discuss Research on Policy Responsiveness to Average Americans
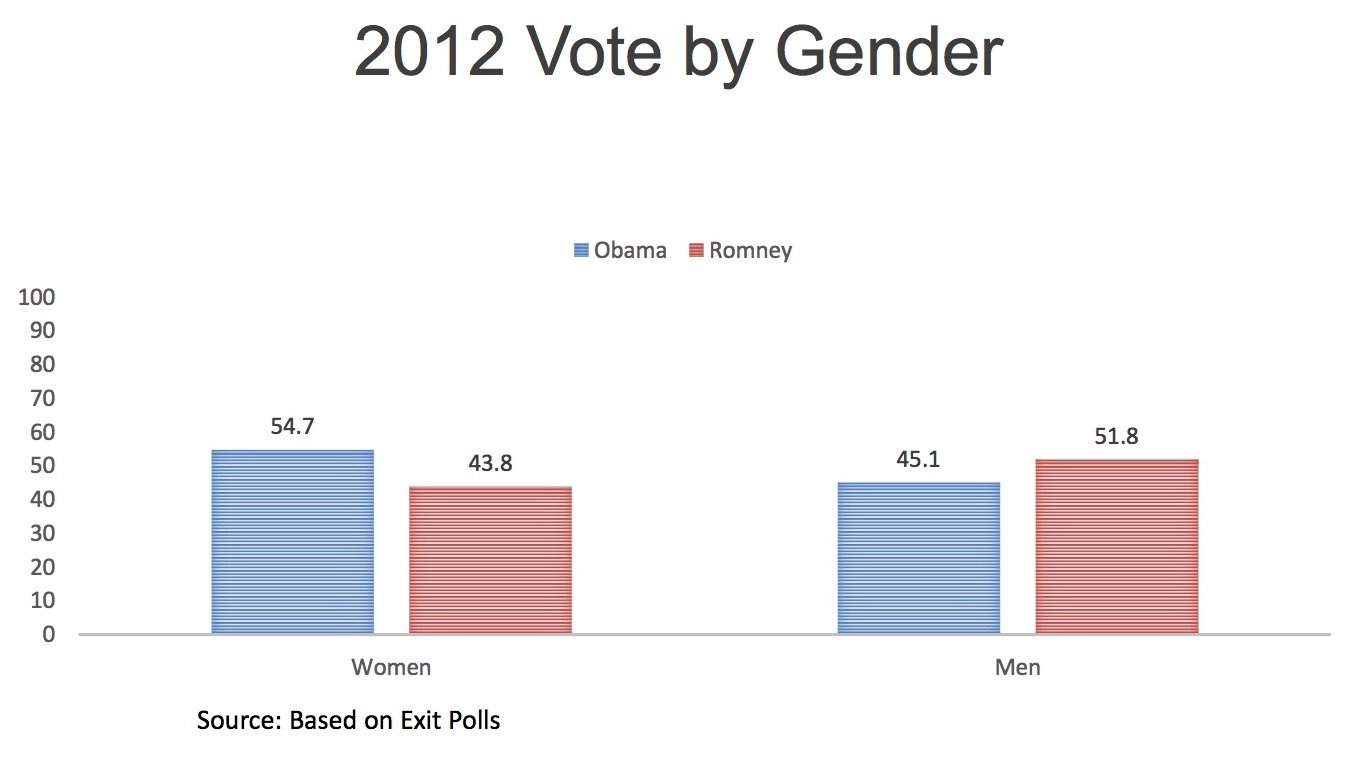
As of October, the latest national polls, predicted that the 2016 Election results will reflect the largest gender gap in vote choice in modern U.S. history. Today, according to NPR, “An average of three recent national polls shows that women prefer Clinton by roughly 13 points, while men prefer Trump by 12, totaling a 25-point gap.” If these polls prove true, the 2016 results would indicate a much larger gender gap than what was observed in 2012, where women overwhelmingly supported Barack Obama over Mitt Romney.
2012 vote by gender based on national exit poll conducted by Edison Media Research.
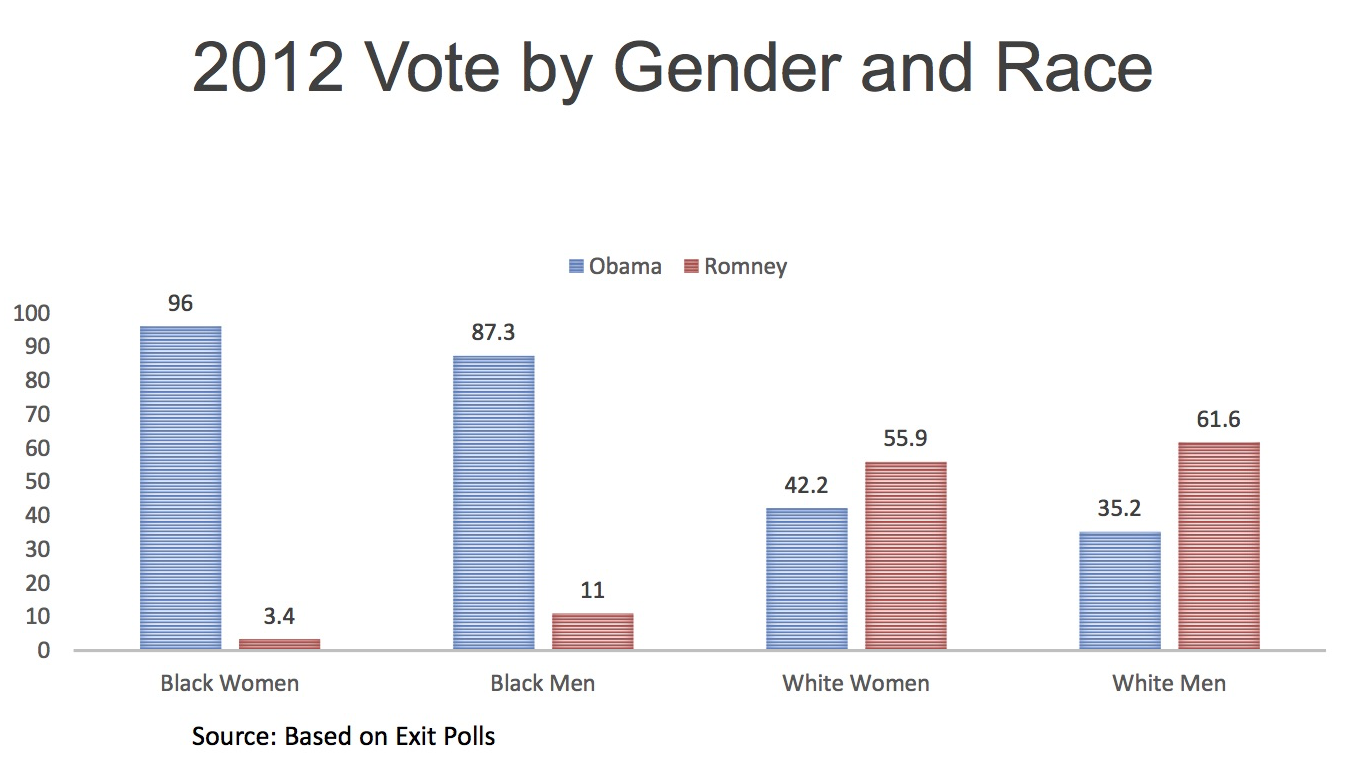
University of Texas at Austin Professor Tasha Philpot argues that what really may be driving this gap to even greater depths, is race. For instance, here’s the same data from the 2012 Election, broken down by gender and race.
2012 vote by gender and race based on national exit poll conducted by Edison Media Research.
Often overlooked in the discussion of the gender gap, race figures prominently into many American’s political identities.
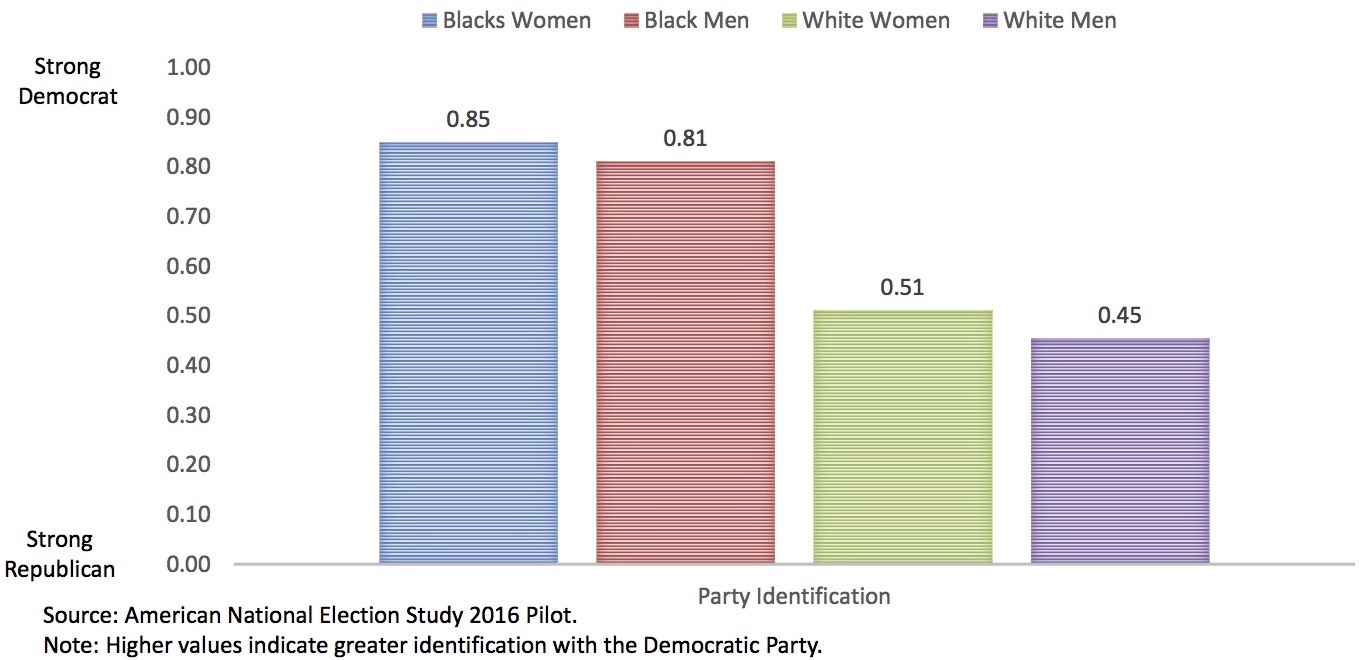
2016 Gender Gap in Party Identification
2016 Gender Gap in Party Identification.
Philpot recently participated in the panel “What We Know So Far About the 2016 Elections” at the University of Michigan’s Center for Political Studies. In her talk, “Race and the Gender Gap in the 2016 Election,” Philpot outlined the potential sources for the gender gap and emphasized the role that race is playing in widening the gap.
Using data from the ANES 2016 Pilot Study, Philpot compared opinions from white and black men and women on several issues such as government spending, inequality and discrimination, and evaluations of the economy. While there were noticeable differences strictly between men and women, the real story became clear when Philpot sorted the results by gender and race. Small gender gaps exist among both whites and blacks, but the most remarkable difference of opinions on all issues is between black women and white men.
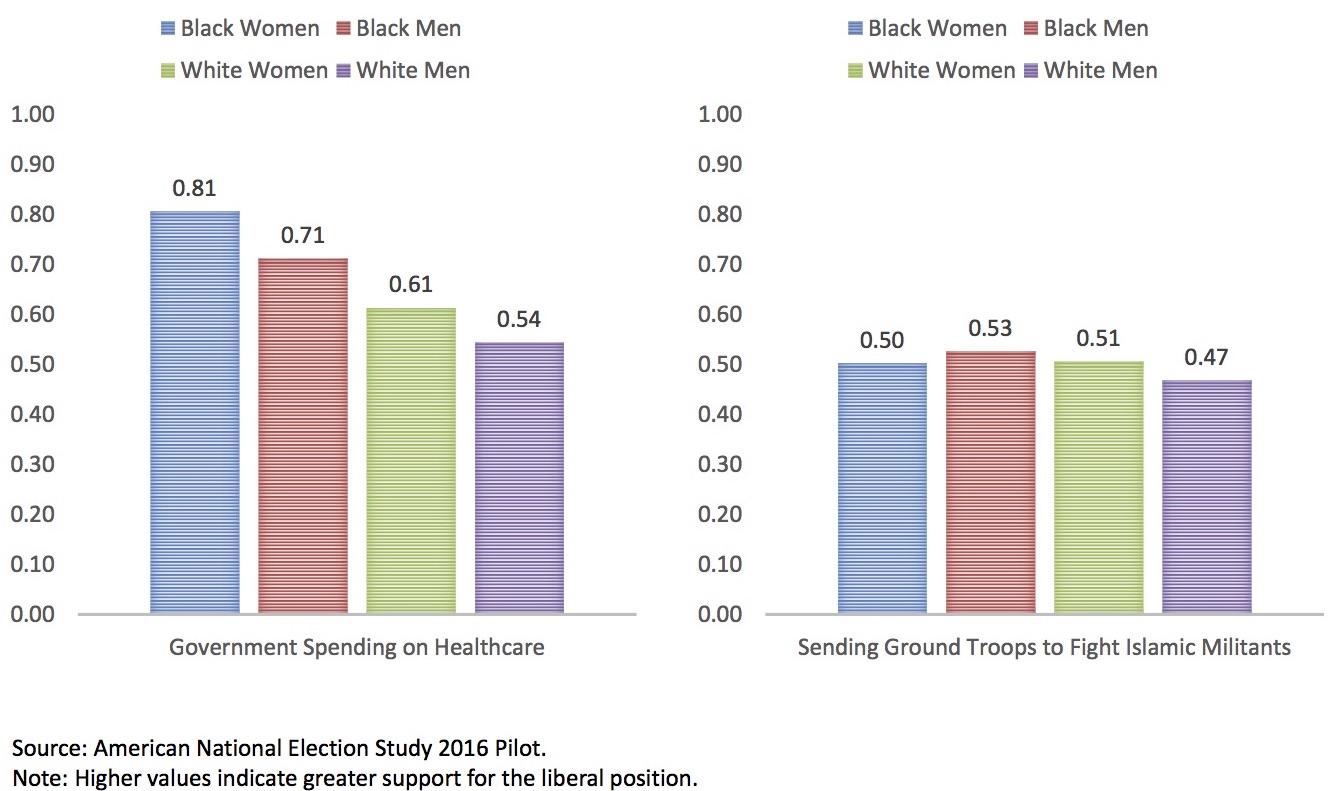
SPENDING ON HEALTH CARE AND DEFENSE
2016 Gender Gap in Spending on Healthcare and Defense.
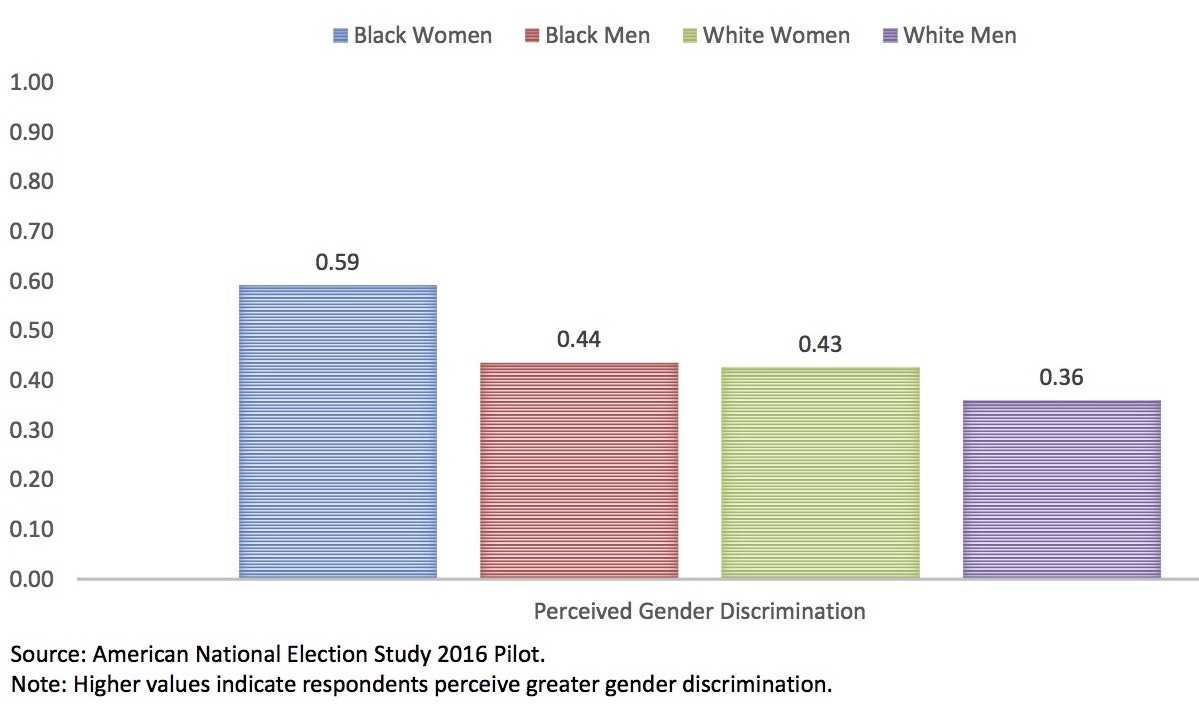
Perceived Gender Discrimination
2016 Gender Gap in Perceived Discrimination Based on Gender
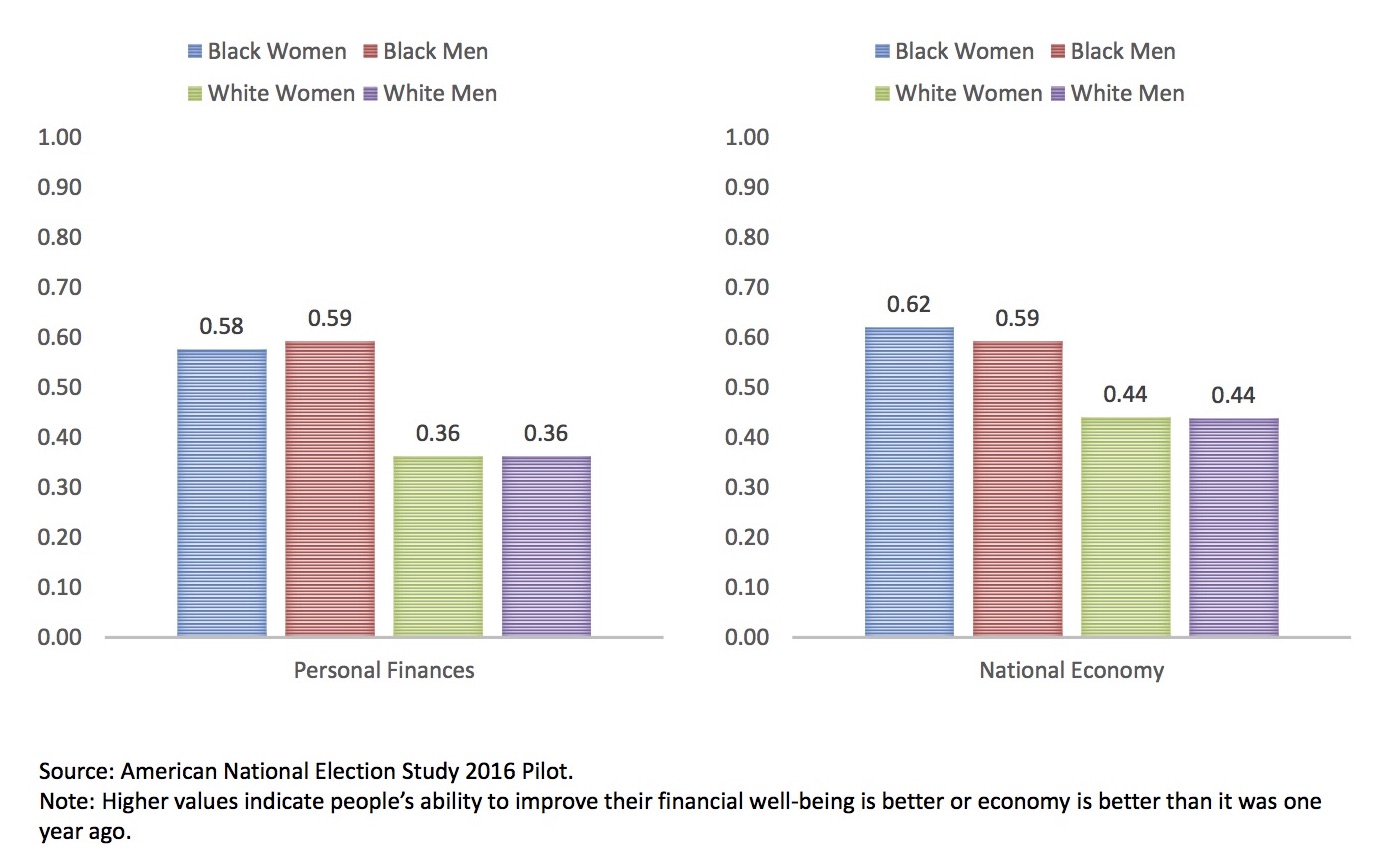
Evaluations of the Economy
2016 Gender Gap in Economic Evaluations.
On most issues, black women and white men fall on opposite sides of the political spectrum. Philpot concludes that it’s an oversimplification to consider the gender gap as merely a gap between men and women, when, in reality, the observed gender gap is largest between white men and black women.
What We Know So Far About the 2016 Elections, was held on October 5, 2016 at the Center for Political Studies, University of Michigan. The panel also included the following talks:
Stuart Soroka: Read, Seen or Heard: A Text-Analytic Approach to Campaign Dynamics Nicholas Valentino: The Underappreciated Role of Sexism in the 2016 Presidential Race Michael Traugott: Pre-Election Polls in the 2016 Campaign