Dec 16, 2014 | ANES, ANES 65th Anniversary, Innovative Methodology
Post developed by Katie Brown in coordination with Darrell Donakowski.
This is the last in a series of posts celebrating the 65th anniversary of the American National Election Studies (ANES). The posts have sought to highlight some of the many ways in which the ANES has benefited scholarship, the public, and the advancement of science.
As part of the 65th anniversary of the American National Election Studies (ANES), the ANES team created an interactive timeline. The timeline charts the history of the project with annotated notable dates and historic photographs. Here, we highlight three of the many entries.

1948 – The Very Beginning
The timeline begins with the inception of ANES. In 1948, social psychologists Angus Campbell and Robert Kahn and the University of Michigan’s Survey Research Center (SRC) surveyed the national electorate. The 1948 survey served as a pilot study for, and many consider to be the first implementation of, the ANES.
1964 – The Feeling Thermometer
The 1964 wave of the study pioneered the feeling thermometer. This unique question format asks respondents to gauge their feelings on a scale from “cold” to “warm”. Feeling thermometers have since been included in all ANES waves, with their use spreading globally and to all academic fields
1996 – Comparative Study of Electoral Systems
The independent Comparative Study of Electoral Systems (CSES) project coordinates the inclusion of common sets of questions in post-election surveys around the world. ANES first incorporated CSES questions in its 1996 wave, moving from national barometer to global participant in the process.
Please consider further exploring the interactive timeline to be reminded of some of the many significant moments throughout the history of this important scientific resource. And if you have ideas for additions to the ANES timeline, the study team would welcome your suggestions by email to: [email protected]
Dec 11, 2014 | ANES, ANES 65th Anniversary, National
Post developed by Katie Brown.
This post is part of a series celebrating the 65th anniversary of the American National Election Studies (ANES). The posts will seek to highlight some of the many ways in which the ANES has benefited scholarship, the public, and the advancement of science.
University of Michigan political scientists Angus Campbell, Philip E. Converse, Warren E. Miller, and Donald E. Stokes published The American Voter in 1960. The American Voter takes root in a time of changing notions about individuals and decision-making. In the 1940s, Paul Lazarsfeld and the Columbia school placed a new emphasis on demographic factors in responses to media and support for President Franklin D. Roosevelt.
 In The American Voter, Campbell, Converse, Miller, and Stokes became part of this behavioral revolution as they considered audience traits in the context of politics. The main argument of the book holds that most American voters cast their ballots on the basis of party identification. Specifically, voter decisions pass through a funnel. At the opening of the funnel is party identification. With this lens, voters process issue agenda. They then narrow down to evaluate candidate traits. Finally, at the small end of the funnel is vote choice. This understanding of voters encompasses the “Michigan Model.”
In time, the Michigan Model was revised. The original Michigan Model held party identification as king. This thesis maps onto the strong post-World War II Democratic party, strengthened by Roosevelt. In the next few decades, party identification weakened. More recently, party identification reemerged stronger than ever due to a variety of factors, including changing campaign strategy and polarization.
So while these new generations of scholars find different balances between party identification and other factors influencing vote choice, The American Voter provided a bar against which this change could be measured.
The American Voter also enabled the tools of measurement with ANES. The American Voter utilized early waves of what would become the American National Election Studies (ANES), which Miller himself facilitated. The ANES developed into a multi-wave, decade-spanning project offering continuous data on the American electorate since 1948.
Cited over 6,500 times to date, the book remains a seminal text in political science.
Dec 9, 2014 | Innovative Methodology, International, Profile
Post developed by Katie Brown.
Growing up in Palestine during a period of political tension, Khalil Shikaki became fascinated with politics. After completing a BA in Political Science at the American University of Beirut, Shikaki pursued these questions with a PhD in Political Science from Columbia University. Two core questions drive his research: What direction is Palestinian society taking? How do Palestinians view the relationship with Israel?
After finishing in 1985, he began teaching at An-Najah National University in the Northern part of the West Bank. Shikaki designed and taught his first course (the same course he is teaching here this semester): Palestinian Politics & Society. At that time, he realized there were no data to support and test theories. Even politicians relied on word of mouth to gauge public opinion.
So Shikaki set out to collect this data with Palestine’s first survey. But he faced a major roadblock. At the time, Palestine was under Israel occupation, and the Israeli military forbid the proposed survey. After the Madrid Peace Conference in 1991, things started to calm, which created an opening for data collection. In 1992, Shikaki started training survey administers and opened the Palestinian Center for Policy and Survey Research (PCPSR) in Nablus (PCPSR moved to Ramallah in 2000). And the first survey ran in 1993. Results of the survey, which explored public attitudes toward the Oslo agreement, were published in the same day the agreement was officially signed in Washington DC.
If the first challenge to data collection was Israeli occupation, the second was building trust with Palestinians. In particular, Shikaki and his team had to convince citizens that they could trust the interviewers enough to speak their mind. The initial response rate to a pilot study came in at just 50%. The team underwent additional training over the course of a year to project and inspire confidence and did not enter the field officially until this dropped to 10%. Once out in the field they found the opposite of their initial fear: if anything, people wanted to talk too much.
The surveys rolled out in both the West Bank and Gaza. When Hamas took over Gaza in 2007, the researchers faced some new issues as Hamas now wanted to control the data. But the survey continued. And while some field workers have faced arrest, they are usually released the same day.
Data collection also becomes difficult when battles rage with Israel. This past summer, the survey stopped in areas under bomb and rocket attack. But the day before the ceasefire, interviewers tackled the embattled regions. Aside from timing, the researchers also had to adjust for areas now decimated by war, citizens displaced. This allowed for timely and valuable data on opinions about how the latest fighting impacted Palestinian views.
With more than 20 years experience investigating his driving questions — What direction is Palestinian society taking? How do Palestinians feel about the relationship with Israel? – Shikaki sees a few trends. Over the first ten years, the Palestinian public was moving in a politically moderate direction with greater support for diplomacy and compromise with Israel. The most recent decade, though, has witnessed greater support for Islamists and violence with Israel. The fate embodied in these questions are linked. Shikaki remains hopeful, as a change in either would enact change in the other.
We are extremely pleased to have Khalil Shikaki in residence at the Center for Political Studies (CPS). During his time at CPS, he has also been continuing his collaborations with the Arab Barometer, the Aggression Research Program, and Scott Atran.
Dec 4, 2014 | ANES, Elections, Innovative Methodology, National
Post developed by Katie Brown and Shanto Iyengar.
The inaugural Michigan Political Communication Workshop welcomed renowned political science and communication scholar Shanto Iyengar from Stanford University. Iyengar presented a talk entitled “Fear and Loathing across Party Lines.”
Iyengar began by considering the current polarized state of American politics. Both parties moving toward ideological poles has resulted in policy gridlock (see: government shutdown, debt ceiling negotiations). But does this polarization extend to the public in general? To answer this question, Iyengar measured individual resentment with both explicit and implicit measures.
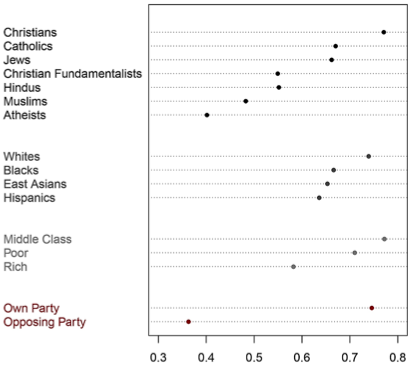
2008 ANES: Party vs Other Divisions
For an explicit measure, Iyengar turned to survey evidence. The American National Election Studies (ANES) indeed illustrates a significant decline in ratings of the other party based on feeling thermometer questions. Likewise, social distance between parties has increased over time, as measured by stereotypes of party supporters and marriage across party lines. In fact, this out-group animosity marks a deeper divide than other considerations, even race (see graph below).
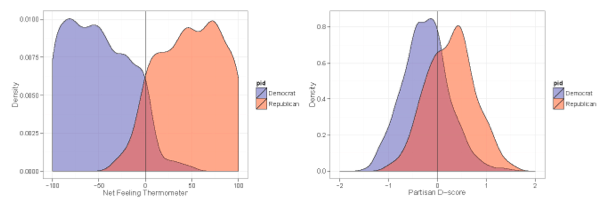
But these surveys gauge animosity at the conscious level. Iyengar also believes mental operations concerning out-party evaluations occur outside of conscious awareness. So, along with Sean J. Westwood, Iyengar pioneered implicit measures of out-party animosity. Specifically, Iyengar and Westwood adapted the Implicit Association Test— originally used to capture racism – to political parties. Interestingly, the IAT also captured this animosity, although the polarization was more pronounced with the explicit survey measures. The chart on the left shows the starker divide between Democrats and Republicans using the feeling thermometer; the chart on the right shows the difference with the IAT.
Comparing Implicit with Explicit Affect
Iyengar also adapted classic economic games to test implicit out-party animosity. Both games allow the participant to share a proportion of money provided by the researchers. Interestingly, participants gave less to out-party opponents. Iyengar cites this as evidence of implicit out-party bias.
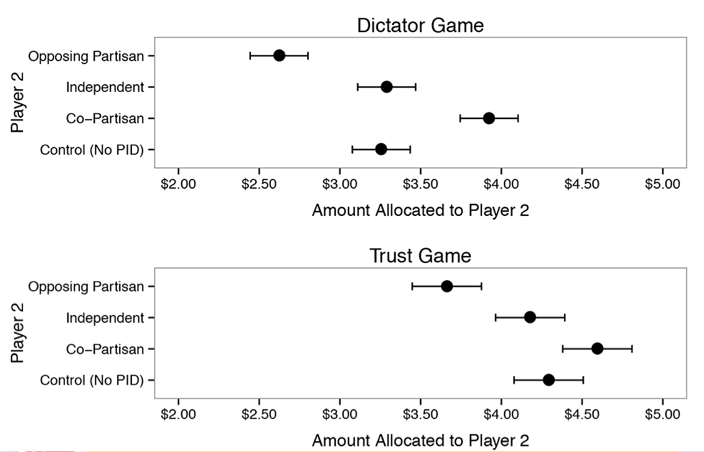
Economic Game Results by Party
Together, these results suggest marked party polarization. The hostility is so strong that politicians running on a bipartisan platform are likely to be out of step with public opinion.