May 4, 2026 | 2025 Analysis, Current Events, expert analysis, National, Race
When we think about how political beliefs are formed, conventional wisdom points to parents as the primary teachers—passing down party loyalties, civic values, and political knowledge to their children from an early age. But what happens when parents themselves are navigating an unfamiliar political landscape?
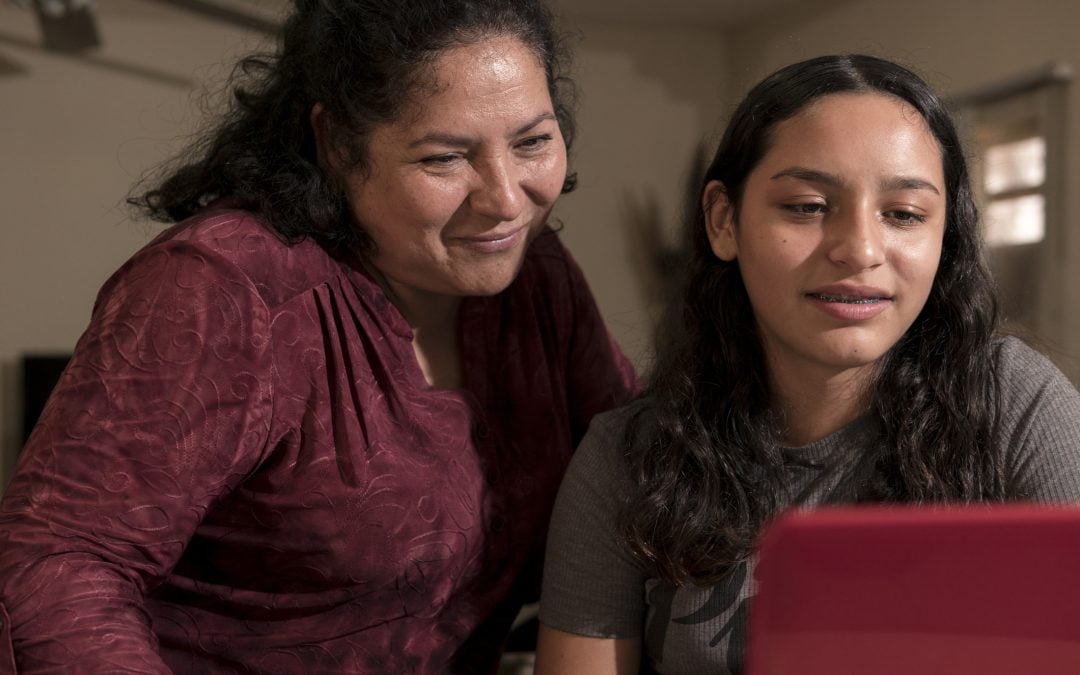
In his forthcoming book Information Brokers: Political Socialization in Latino Immigrant Families (University of Chicago Press, July 2026), political scientist Roberto F. Carlos upends traditional assumptions by investigating a reversal of roles that unfolds in many Latino immigrant households: It is the children who teach the parents about American politics.
When children influence political engagement
“Young children, particularly in immigrant households, often help their parents navigate life in the United States by acting as key sources of information,” writes Carlos, who rigorously provides evidence that this responsibility grants children influence over their parents’ political engagement, “with children shaping their immigrant parents’ political perspectives and decisions.”
These dynamics may be key to understanding political engagement and disengagement among Latinos, the largest ethnic minority group in the United States. Two-thirds of this population are either immigrants or the children of immigrants.
Carlos’s previous research examined the “prolonged partisan socialization process” experienced by second-generation Americans; in his 2018 article “Late to the Party,” he demonstrated that children of immigrants often grow up without the parental partisan transmission that mainstream theories take for granted. Because many immigrant parents arrive in the United States without deep familiarity with the American party system—hindered by language barriers, economic pressures, fear of deportation, and lingering ties to the politics of their home countries—they are frequently unable to map their values onto U.S. political parties early enough to pass a partisan identity along to their children. Information Brokers asks what happens to children who lack parental political guidance, but also what happens when those children become the guides themselves.
‘Information brokers’
The book’s central argument is that children of Latino immigrants function as “information brokers”—active agents who translate, interpret, and mediate the American political world for their parents. As immigrant parents navigate unfamiliar institutions, they often turn to their U.S.-educated children for help with everything from understanding government paperwork to making sense of elections and civic engagement. This brokering role places unique responsibilities on young people, granting them an unusual degree of influence over major household decisions, including political ones. When children advocate, explain, or intervene on behalf of their parents, Carlos argues, they are engaging in politically consequential behavior that shapes the attitudes and actions of both generations.
Carlos’s research draws on six original surveys and multiple survey experiments; he also gives a descriptive account of two young Latina women brokering information in response to the imminent passage of the Texas Senate Bill 4, which targeted undocumented immigrants for deportation in 2017. Their experiences illustrate how “information, obligation, and agency, often working in tandem, can serve as catalysts for immigrant households’ participation in the political sphere.” Often, the children of immigrants step up to fill an important informational void, out of necessity.
Political Implications
Countering a narrative that portrays lower rates of partisan identification and voter turnout as signs of apathy or disengagement, Carlos’s research suggests these patterns reflect a socialization process that unfolds differently—and often more slowly—in immigrant communities. Children who broker political information for their families are not disengaged; they are learning politics through direct, high-stakes experience. This could be a valuable insight for activities, politicians, and party strategists who can direct their attention to mobilizing the second generation, says Carlos. “I believe this book provides a significant cause for optimism when it comes to engaging the Latino community.”
This book also says something about today’s political climate as it relates to immigration and the way it is enforced. As Carlos recently noted in the Midwest Political Science Association (MPSA) town hall roundtable on rising authoritarianism in the U.S., children– especially those with mixed-status families– are forced to learn politics because they are helping their parents manage risk. They learn how state power works because they are the ones explaining it, translating it, and sometimes trying to protect their families from it. “That is political socialization under conditions of enforcement,” said Carlos. “It is not civics as we usually imagine it. It is not learning about voting or Congress or the three branches of government in a classroom. It is learning that the state can enter your family’s life through a traffic stop, a workplace raid, a court notice, a school absence, or a rumor that ICE is nearby. It is learning that politics is not distant. It is not abstract. It is protection or vulnerability.”
Carlos provides two striking statistics citing Vox journalist Christian Paz: One out of five people living in the United States is Latino, and every 30 seconds, a member of the Latino community becomes eligible to vote. As the 2026 midterm elections loom, Carlos’s new book provides a fresh perspective on a powerful voting bloc whose engagement could play a decisive role in election outcomes.
 Roberto Carlos is an Assistant Professor in the Department of Political Science at the University of Michigan, and an affiliate of the Center for Political Studies at the Institute for Social Research. His research lies at the intersection of race, ethnicity, and politics, focusing on Latinx political behavior, immigration, and political socialization.
This post was developed by Tevah Platt, who manages communications for the Center for Political Studies.
Apr 13, 2026 | 2025 Analysis, Current Events, Elections, expert analysis, International
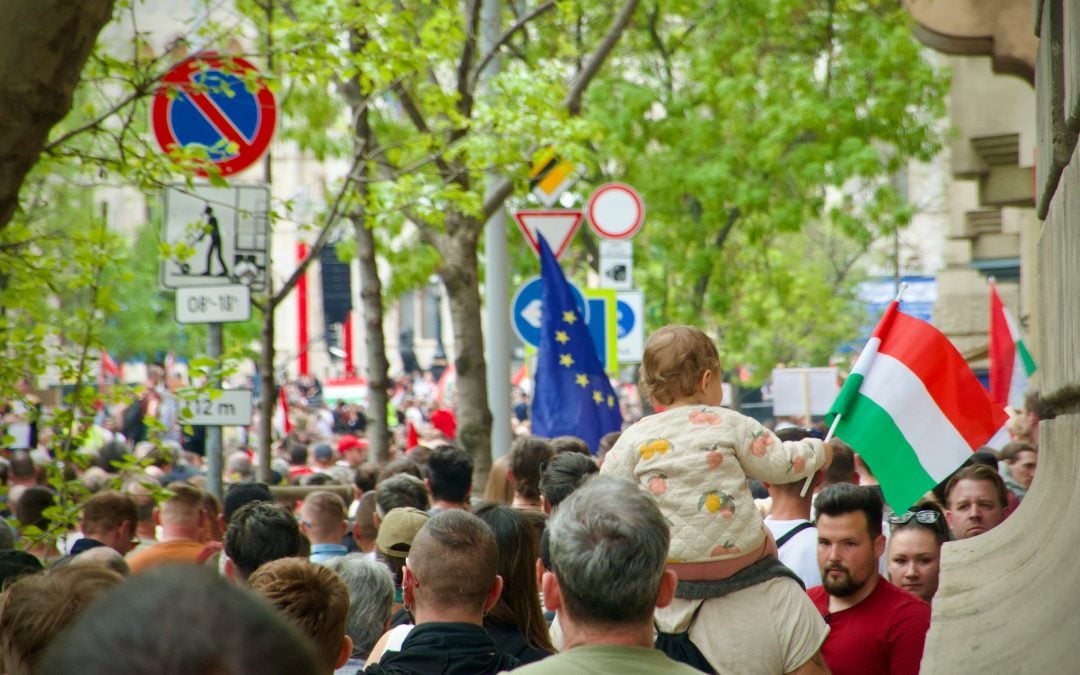
Victor Orbán, Prime Minister of Hungary for sixteen years (2010-26), has conceded the election to Peter Magyar and his opposition Tisza party. This is an enormous defeat for the right-wing populist leader and his right-wing populist Fidesz party and a landslide victory for the democratic opposition.
Parliamentary Supermajority for the Opposition Provides Lever to Rebuild Democracy
By winning more than 135 seats in the 199-seat legislative body, Magyar’s Tisza party has not just secured a majority but a supermajority in the Hungarian parliament. Orbán’s Fidesz party has held a parliamentary supermajority for four consecutive terms, which he has used to rewrite the constitution to consolidate his own power and to undermine democracy and the rule of law in Hungary.
Many of the tactics he used are part of the authoritarian playbook that is by now all too familiar—eliminating checks and balances on executive authority, taking control over media outlets, and reengineering the electoral system to disadvantage the opposition. Regaining control will enable the opposition to amend the constitution, reverse many of these changes, and rebuild institutions that promote democracy and the rule of law.
Yet, the landslide victory is not only a triumph for Hungary’s democratic opposition and the country’s future trajectory; it is also a major win for Europe, the European Union (EU), Ukraine, and the US.
Hope for a Strong and United Europe
The defeat of Orbán and his nationalist agenda signals to Europe, and to Europeans, that the rise of right-wing populism is not irreversible. Although not yet the dominant trend across the continent, far-right parties such as Orbán’s Fidesz have been gaining ground in Europe since the 2000s and appeared to be building momentum. Moreover, Orbán himself has become an iconic figure among them, exemplifying the success of illiberal democracy. The sweeping electoral victory of the liberal opposition in Hungary has countered this trend and diminished Orbán’s appeal as a model for Europe’s future. Instead, he is a cautionary tale.
Second, Orban’s defeat signals that Hungarians have not rejected either Europe or European values, including liberal democracy. As many European leaders stated following the election results, there is renewed hope for a strong and united Europe.
The primary beneficiary of this reunion—at least in the short run—is Ukraine. Among the many ways in which Orbán has undermined the EU is his refusal to support either further assistance to Ukraine or stricter sanctions against Russia following Russia’s full-scale invasion of Ukraine in February 2022. As part of his electoral campaign, Magyar pledged to rebuild Hungary’s relationship with the EU. He made good on this promise following his victory by agreeing to unblock critical aid in the form of a 90-billion-euro ($103-billion) loan to Ukraine.
Takeaways for the US
The cautionary tale of Orbán’s defeat also suggests a prescriptive one for the United States. Both the large turnout and the substantial margins made the Tisza party’s electoral win too decisive for even Orbán to contest. But neither the size of the turnout nor the landslide victory happened overnight. Albeit weakened by Orban’s policies, Hungarian civil society continued to mobilize undaunted, and Hungarian citizens increasingly took to the streets to show Orban, his loyalists, and most importantly, their fellow citizens that they would not tolerate an autocratic takeover.
The road ahead will be difficult. Orbán not only succeeded in dismantling democratic institutions and the rule of law. He also used his unchecked authority to institute a system of crony capitalism, rewarding loyalists with control over key economic sectors and lucrative development contracts, and destroying Hungary’s economy in the process. In fact, the protests that amalgamated in the opposition’s massive victory focused on anti-corruption and pocket-book issues. So too did Magyar’s electoral campaign, signifying that this is a winning electoral strategy. The new government will have to both rebuild and restore confidence in democratic institutions and the rule of law while actively combating the corrupt practices that have fueled inflation and slowed economic recovery.

This post was written by Pauline Jones, Research Professor and Director of the University of Michigan Center for Political Studies. Pauline Jones is a Professor of Political Science and the Edie N. Goldenberg Endowed Director for the Michigan in Washington Program. She is an expert on politics in the former Soviet Union (including Kazakhstan, Kyrgyzstan and Russia) and on assessing the impact of mass protest in authoritarian regimes. She regularly teaches PoliSci140: Introduction to Comparative Politics and recently shared her insights on US democratic decline in global perspective. Dr. Jones is currently a fellow of the Center for Advanced Study in the Behavioral Sciences (CASBS) at Stanford University.
Feb 5, 2026 | Elections, expert analysis, National
The 2026 midterm elections are less than a year away, and they will have a powerful influence on the future of American politics. Currently, the Republican party has a “trifecta,” meaning they control the presidency, the House, and the Senate. This suggests they should be able to be able to implement their policy agenda through concerted action.
However, their majorities are slim, and there is a very good chance that the Democrats will gain control of the House after the midterm elections. Republicans currently hold a three-seat majority in the House; if the Democrats gain the majority, there will be increased scrutiny of Trump administration activities through the hearing process, with a high probability of another impeachment of Donald Trump, even if it is unlikely to result in a conviction in the Senate.
How the Midterms Work
Every two years all 435 seats in the House, and one-third of the seats in the Senate, are up for election. Political scientists have developed two distinct models for estimating the outcome of the midterms, based upon evaluations of the current president and the quality of the candidates contesting the election. It is important to note that the participation of incumbents remains unclear in all cases; while 47 House members have indicated they plan to retire so far, for example, there is still time for others to get out. There are slightly more Republicans than Democrats in this group. There are also 11 incumbent Senators who have announced their retirement or intent to run for another office as well (PBS Newshour Analysis).
While there are 435 seats in the House, not all of them are at risk of flipping. Because of redistricting, most districts are safe for one party or the other. In fact, only 36 seats are considered competitive (typically decided by 10 percentage points or less), with half of these considered tossups (New York Times Midterm Elections House Maps). Because of mid-decade redistricting efforts in some states, there are 26 districts with new boundaries and no prior electoral history, although only 11 are considered likely to be competitive.
History Disfavors Incumbent Parties
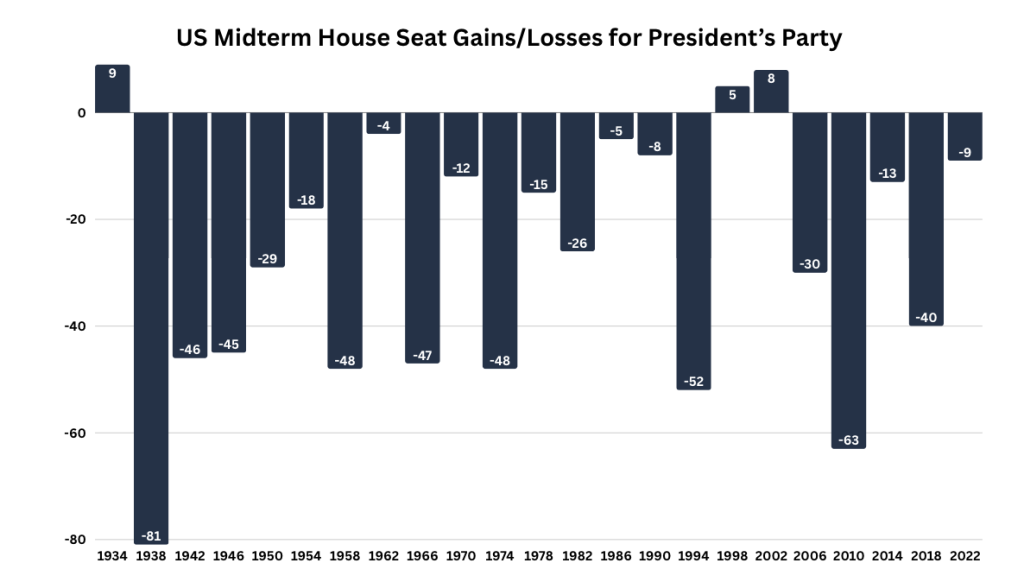
The historical pattern in the House is that the incumbent president’s party loses seats in the midterm election. There have been 20 midterm elections in the post-World War II period, and the president’s party has lost seats in 18 of them. The exceptions were in 1998 when Bill Clinton was being impeached and 2002 after the 9/11 attacks when George W. Bush was in office. The range of losses was from 4 in 1962 in John F. Kennedy’s presidency after the Cuban missile crisis to 63 in 2010 during Barack Obama’s second term, after dissatisfaction with the economy and the debates and passage of the Affordable Care Act. In the 2018 midterm election during Donald Trump’s first term, the Republican party lost 40 seats in the House.
Forecasting
Lewis-Beck and Tien (2025) have developed a model for estimating House seat losses in a midterm election based upon the president’s net approval rating in a Gallup poll (% Approving – % Disapproving) and the change in personal disposable income from the Bureau of Economic Analysis in the previous six months. When this calculation is made in August of the election year, it provides a good estimate of the seat losses in November. Lewis-Beck and Tien made an estimate in October of last year for a seat loss of 28. Since then, Donald Trump’s approval rating has declined, and the model in February now suggests a seat loss of 49. August is still six months away, and both Trump’s approval rating and Americans’ personal disposable income could increase. But it is virtually certain that the Democrats will gain control of the House.
 Michael Traugott is a political scientist who studies campaigns and elections, voting behavior, and the impact of mass media on American politics He is the interim director of the Center for Political Studies (CPS) and the author of A Voter’s Guide to the Election Polls, now in its 6th edition. CPS communications manager Tevah Platt assisted in the development of this post.

Nov 11, 2025 | 2025 Analysis, Current Events, Elections, expert analysis, National
Democrats had a big night last week, sweeping key elections and winning by unexpected margins up and down the ballot. Voters showed up in high numbers for an “off” election year and sided with Democrats in the elections’ four major contests: The mayor’s race in New York City, the governors’ races in Virginia and New Jersey, and the redistricting measure Prop 50 in California.
Tyler Simko is an Assistant Professor of Political Science at the University of Michigan, and an affiliate of the Center for Political Studies at the Institute for Social Research. Simko specializes in U.S. state and local politics, political geography, and computational social science. He is applying this expertise as an elections analyst for CBS, and he shared with us about the experience of doing this work and the major takeaways from the 2025 elections.
Expert Q&A with CBS Elections Analyst Tyler Simko
The content has been lightly edited for length and clarity.
1. What were your top takeaways from the 2025 elections?
Two specific trends stick out to me.
First, this was a stronger performance for Democrats than many people expected.
The election outcomes were not especially surprising. For all four major races, the expected result going into election day happened—for example, most polls before election day saw Mamdani, Sherrill, Spanberger, and “yes” on Proposition 50 as the clear frontrunners.
However, the final margins in favor of Democrats were larger than many people expected. For example, most polls placed Mikie Sherrill as the favorite, but polling averages showed a lead of around 3-5 percentage points. The ultimate election was a blowout, with Sherrill ahead with a final margin around thirteen points. Abigail Spanberger won the governor’s race in Virginia by even more.
The second major takeaway for me was that early analysis suggests that some of the “red shift” we saw in 2024 among groups like Latinos may have reverted back toward Democrats.
For example, high-Latino communities in New Jersey saw huge reversals toward Sherrill from the way residents in those same places voted in 2024 for Harris.
Results like these suggest that some of the shifts we saw in 2024 may not be set in stone. Charles Stewart III, another election analyst on the team and a Professor at MIT, has suggested this might be evidence that 2024 was a “deviating election,” rather than a new normal, citing research originally developed at the University of Michigan in the 1960s.
2. Was there anything notable about turnout for this election?
Turnout was unusually high in nearly every race on Tuesday night. In some ways, this is surprising because 2025 is an “off” election year without presidential or congressional midterm elections.
However, this high turnout reflects just how salient politics is for many Americans right now.
For example, early voting and election day turnout in the NYC mayoral election eclipsed the last election in 2021. This continued the trend we saw in the primary, where early voting more than doubled turnout in the last primary that elected Eric Adams. Turnout in other races was high as well, like California’s Proposition 50 measure on redistricting.
Further, it’s especially interesting to see where turnout was higher compared to past elections.
Patterns in turnout changes can offer insight into where voters are particularly energized right now.
For example, I wrote for CBS that many Democratic-leaning areas in New Jersey saw huge surges in turnout (some nearly 40% higher than the last gubernatorial election in 2021). This suggests that Democrats are particularly politically motivated right now, a trend that party leaders will hope continues into next year’s midterm elections.
3. What do you do as an Election Analyst on the CBS News Data Desk?
For this past election night on November 4th, I worked in the CBS Office in New York City alongside a team of other analysts to predict and analyze the elections for NYC Mayor, NJ/VA Governor, and California’s Prop. 50 redistricting referendum.
On election night the Data Desk is focused on forecasting voter turnout and predicting election results. We analyze data like exit polls and election returns as they come in, and look for interesting patterns. As with any network, one of our primary roles is to “call” the election winners.
But beyond calling the races, we’re also actively monitoring other data beyond vote shares. For example, the NYC Board of Elections frequently updates their “check-in” turnout numbers throughout the day. We use these records to help improve our turnout forecasts, which help us identify patterns early in the night. For example, even before election night, strong early voting in New Jersey’s Democratic-leaning areas suggested it would be a good night for Mikie Sherrill.
Finally, a good deal of work happens both before and after the elections too. For example, some members of the team prepare products like the CBS Exit Polls in preparation for election day.
Similarly, after election day there is a ton of new data to analyze. For example, the morning after election day, Kabir Khanna (Director, Election Analytics & Technical Systems at CBS) and I wrote an article for CBS News demonstrating how high turnout in Democratic-leaning counties strongly favored Sherrill. We’ll continue conducting this kind of analysis in the coming weeks.
4. What are the goals of this work, and how do your expertise and skills meet the needs of delivering election results and analysis?
Predicting election results (before they happen) and analyzing returns (after they happen) require knowledge of both electoral systems and statistics. At the University of Michigan, I teach courses on American Politics and Political Methodology in the Political Science department and research topics in political institutions and computational social science, so this kind of work is right up my alley. You know, I used real data from election night for an interactive prediction activity in my graduate-level Machine Learning course this past week.
Calling election results is a classic prediction problem. You don’t have complete information before election night is over, but you would like to use statistical “signals” to make data-driven predictions about what is going to happen. Often, we use statistical models because we want to detect patterns over the course of election night that may not be clear from simply counting returns as they come in.
For example, imagine a hypothetical situation where votes for NYC Mayor from Staten Island all come in first, early on election night. A simple “counting” approach would predict Andrew Cuomo had a large lead in the mayoral election because he had strong support in Staten Island, while in reality Mamdani clearly won overall. Statistical models help account for these patterns like geographic segregation in candidate support. Training in both political science and statistics/data science helps.
5. What are the future implications of the 2025 election results?
I think this set of results has two important implications:
First, this strong Democratic win will change the political dynamics over the next year as we head into the midterms. In the meantime, these results also give national Democrats more leverage in ongoing debates like the government shutdown.
We also might see these results change political rhetoric over the next few months. For example, Mamdani’s campaign focused on affordability and we have already seen Trump adopting this language in recent interviews.
The second major signal comes from the strong passage of California’s Proposition 50. This result greenlights Democratic efforts to push back against the new Texas redistricting plan that made their existing gerrymander even more extreme.
Republicans currently have the lead in this redistricting “war” because they have aggressively gerrymandered maps in several states. But, Prop. 50 will likely embolden Democrats in states like Virginia to try gerrymandering their own favorable plans.
Some of my own research helps clarify the consequences of gerrymanders. My co-authors and I at the ALARM Project—a research group focused on political geography and public policy—have shown that gerrymandering makes congressional elections less competitive and less responsive to the will of voters. Our research also shows that these other states could learn from Michigan, as our independent redistricting commission helps ensure redistricting plans are more fair and less biased.

Tyler Simko is an Assistant Professor of Political Science at the University of Michigan, and an affiliate of the Center for Political Studies at the Institute for Social Research. This post was developed by Tyler Simko and Tevah Platt, communications manager for the Center for Political Studies.

Jun 24, 2025 | Current Events, expert analysis, National
In recent years, global crises have increasingly come to define the times we live in. These big challenges, ranging from climate change and political instability to frequent mass shootings, can contribute to a pervasive sense that the future is doomed.
Emergent evidence suggests that many Americans have adopted future outlooks that are not just pessimistic, but apocalyptic. In a 2022 PEW Research study, 39% of respondents believed that humanity is “living in the end times.”
Understanding the Apocalyptic Mindset
The idea of an “apocalyptic mindset” refers to the belief that America’s future is bleak and uncontrollable.
The concepts of the “end times” and the apocalypse have roots in Christianity but also figure in secular narratives about the future. Political scientist Erik Bleich and classics scholar Christopher Star show that over the past four decades, the news media frequently framed secular threats like nuclear war, climate change, disease, and artificial intelligence in apocalyptic terms.
In tumultuous times, people have historically turned to apocalyptic narratives to make sense of and give meaning to negative events. Reflecting the media’s bleak coverage of contemporary crises, the public may interpret today’s hazards as signs of greater catastrophe on the horizon.
What happens when people think so negatively about the future?
Research indicates that people who are pessimistic about their personal futures are less politically engaged. However, research on the political impacts of pessimism about society’s future is scarce.
Measuring future pessimism
To investigate how broad societal pessimism affects political behavior, I fielded a study of 2,053 Americans in April 2024 on Cloud Research, an online survey platform. First, I developed the apocalyptic mindset scale. The scale includes five items that broadly assess projections about the future state of the world and society’s ability to handle future problems. For instance, the scale asks respondents how bright or dark they think the American future will be and how possible or impossible it will be to overcome America’s future problems.
Overall levels of apocalyptic mindset are nearly normally distributed in the sample. The scale ranges from 0 to 1, with 1 being the most pessimistic. The average in this sample is roughly 0.6 and 56% of the sample score higher than this average on the apocalyptic mindset scale. This result is striking because it shows that extremely pessimistic beliefs about the future are not merely fringe beliefs.
Still, some groups are higher on this scale than others. Those highest in apocalyptic mindset tend to be women and less educated individuals. Non-Christian and irreligious people also tend to be higher on the scale than their Christian counterparts, suggesting that extremely negative visions of the future are not exclusive to Christianity.
There are, however, no differences on the apocalyptic mindset scale by partisan identification. This result helps rule out that the scale is simply capturing political grievances about the current party in power.
Impact on political participation
How does apocalyptic mindset relate to political behavior?
On this survey, I asked about voting and other non-voting forms of political participation. Most respondents reported that they were “very” or “extremely” motivated to vote in the 2024 presidential election. For those highest in apocalyptic mindset, average motivation to vote drops by about 10 percent. While I do not know if participants actually voted in the 2024 election, these results suggest that those high in apocalyptic mindset were less likely to turn out.

Note: Motivation to vote is measured on a five-point scale ranging from 0 “not at all motivated” to 1 “extremely motivated.” Apocalyptic mindset is split into 3 quantiles, where the highest group is the most pessimistic.
This study also included questions about other, non-voting forms of political engagement. I asked participants if within the year, they had or planned to attend rallies, talk to others about voting, donate to a campaign, volunteer for a campaign, or display campaign merchandise like yard signs. I compiled all these activities into a single scale of non-voting participation and tested whether apocalyptic mindset can predict these behaviors.
Like motivation to vote, higher levels of apocalyptic mindset in this study were associated with lower levels of non-voting participation. Though they estimate opposite patterns of engagement, apocalyptic mindset and income have similar levels of predictive strength. Apocalyptic mindset is also a stronger predictor of non-voting participation than some other conventional predictors, like education and age.
The bigger picture
In response to an ever-threatening world, it may be rational to expect the worst for the future. My findings show that extremely negative beliefs about society’s future are prevalent among the American people.
A concerning pattern also emerged in my results: Individuals with an apocalyptic mindset are significantly less motivated to vote and less likely to participate in non-voting political activities.
Yet these kinds of participatory activities could be an important outlet for average citizens to advocate for a better future.
When individuals harbor a bleak outlook and disengage from the very political processes that may alter the future, they risk fostering a self-fulfilling prophecy. The acceptance of bad outcomes as fate diminishes the chances of political solutions to the very crises fueling their pessimism.
 Avery Goods is a PhD candidate at the University of Michigan, studying American Politics and a Converse Miller Fellow in American Political Behavior affiliated with the Center for Political Studies at the Institute for Social Research. She is broadly interested in political psychology, political communication, media, and survey design. Her current work focuses on how perceptions of the future shape political behavior. Tevah Platt and Julia Lippman of the Center for Political Studies contributed to the development of this post.

Apr 28, 2025 | 2025 Analysis, Current Events, expert analysis, Foreign Affairs, International, National, Policy
By ANNE PITCHER
What do the following activities, organizations, and companies have in common:
- The Soybean Innovation Lab in Illinois
- The delivery of food aid in Ukraine
- The provision of antiretroviral drugs to treat HIV in South Africa
- Neonatal care in Ghana
- John Deere tractors, and
- Land grant universities like Michigan State University?
All of them have benefitted from partnerships with, and/or funding from, the US Agency for International Development (USAID). Most of them have been significantly affected by stop-work orders affecting USAID that were issued after President Donald Trump took office.
The gutting of USAID within the first 100 days of the Trump administration has upended the aid sector around the world.
This post provides a brief overview of USAID: What does the agency do? What has happened, and what are the consequences?
So What Is USAID?
USAID was created by Congress in 1961 under President John F. Kennedy to administer humanitarian aid and programs on behalf of the US government. In recent years it has distributed some $40 billion annually in aid to 120 countries, providing support to address illness and hunger, neonatal care, clean water, electricity, and disaster relief. Among its many tasks, it promotes democracy all over Africa, conservation efforts in the Amazon, and awareness campaigns about clean air across Southeast Asia. Its spending, procurement, and project implementation procedures are subject to rigorous oversight and compliance regulations administered by the USAID Office of the Inspector General.
USAID does not give aid directly to governments. Instead, it often provides “tied aid,” meaning that the aid is conditional on recipients spending aid funding on American goods and services. For example, USAID might partner with a for-profit company like John Deere, which makes agricultural equipment, or agricultural seed companies like Corteva Agriscience, to deliver agricultural aid. USAID also provides funding to international nongovernmental organizations (NGOs) such as CARE, World Vision, Doctors Without Borders, or Catholic Relief Services, or domestic NGOs in Benin, Thailand, or Nicaragua that offer assistance in sectors from health care to education in developing countries. Some of these NGOs depend on USAID for a large percentage of their budgets. Finally USAID has partnered with US land grant universities like MSU to engage in research on water, electricity provision, or food security.
And although the much loved Peace Corps is a separate government agency it has worked closely with USAID. The Peace Corps was created in 1961 under the administration of President John F. Kennedy after he proposed it on a campaign stop at the University of Michigan when he was running for President. The Peace Corps has partnered with USAID on projects such as the Small Project Assistance Program to support community-driven projects such as the prevention of malaria or human trafficking, or disaster preparedness. Many Peace Corps volunteers often go on to serve rewarding and productive careers at USAID.

Washington, DC, USA- March 1, 2020: One of the entrance of United States Agency for International Development in Washington, DC, USA, an independent agency of the United States federal government.
What Has Happened?
On returning to office for his second and last term as President, Donald Trump signed an executive order that froze almost all international spending for a 90-day review. Cuts to foreign assistance were spelled out in detail on January 24, 2025, followed by the filing of termination and leave notices to USAID employees. In a lightning speed process, thousands of employees had been terminated by late February. As of last month, an estimated 50,000 US citizens and twice as many foreign service nationals had lost their jobs due to cuts. It has now been reported that many termination letters contained a number of serious errors which has affected severance pay and pension payouts for some USAID employees.
Besides domestic workers, thousands of people were contracted from all over the world to work for USAID. Many had loyally served USAID for decades. Those employees who work for USAID on annual contracts (as many who work abroad do) cannot file for unemployment. Some have been stranded in Egypt, Mozambique, Togo, and Cambodia, without a clear path for planning or paying for a return to the U.S. of themselves, their families, and their belongings.
With regard to USAID funds, approximately 5800 out of 6200 multi-year contracts, to the tune of $54 billion, have been cancelled. Waivers have been provided for life-saving humanitarian aid, but other requests have faced the problem that, with the dismantling of USAID, there are no staff in place to review them. Further directives issued in recent months have put exemptions on hold and another 42 of the remaining 900 contracts have been canceled. A USAID internal report notes that the stop work order was implemented so quickly that food aid was left rotting in ports and warehouses en route to its destination. Vehicles were impounded. Buildings shuttered.
After Elon Musk made a show of remedying an apparent error in DOGE’s massive cuts to foreign aid, the Trump administration quietly doubled down on its decision to stop sending emergency food to millions of children who are starving in Bangladesh, Somalia, and other countries, The Atlantic reported in April.
The Trump administration announced plans in March that USAID would come fully under that State Department and reduce its staff to about 15 positions. An email to USAID employees titled “U.S.A.I.D.’s Final Mission” detailed the plan despite lawmakers’ objections that the efforts to downsize the agency were unconstitutional. USAID employees were also ordered in March to shred and burn personnel documents.
What Are the Consequences?
Most affected by cuts to USAID include patients receiving drugs for HIV/AIDS prevention and treatment, and children in developing countries who get vaccines. In addition, they include women in Ghana receiving neonatal care, and approximately one million Rohingya from Myanmar whose rations in a refugee camp in Bangladesh will likely be cut in half if more funds are not raised soon. They include almost half of the population of Sudan who face acute hunger. Within weeks of the cuts to USAID, 80% of community kitchens across Sudan closed, leaving millions at risk of dying from starvation or preventable illness. Finally, they include Ukrainians receiving corn from American farmers.
Children around the world are already dying as a result of the cuts, and experts are projecting hundreds of thousands, perhaps millions of anticipated deaths in coming months and years from hunger, AIDS, and tuberculosis. Until recently, around 27 million children benefitted from nutrition programs that USAID funded; 4 million received antiretrovirals and 13 million others received treatment from the President’s Emergency Plan for AIDS Relief (PEPFAR), a health program started under President George Bush, which has now been halted.

Now, around 1,400 infants are being infected by HIV every day, an infection rate that might have been prevented had the new US administration not cut funding to USAID and HIV/AIDS organizations. About 3 million more children and adults will die from HIV-related causes before 2030 because of global aid cuts, according to projections published in HIV Lancet.
With respect to conflict prevention, Andrew Natsios, the former head of USAID under President George Bush, who identifies as a “conservative internationalist” has argued that there is a connection between rising food prices and conflict. He worries that without the food aid provided by USAID, we could witness an alarming rise in conflicts in developing countries that are vulnerable to spikes in food prices due to shortages or climate change. This could have demonstrable effects on our own national security and stability.
Several scholars have observed that these cuts also affect US national security by undercutting our reliance on soft power. Soft power relies on humanitarian relief, food aid, and democracy promotion that strengthens our alliances with other countries. An unintended aspect of soft power is that many of the foreign service nationals who work for USAID abroad often end up as members of parliament, heads of NGOs, or ministers in their own countries. This means the United States already has linkages and allies that serve national governments in other countries which has potential benefits for the US. Such connections will be weakened with the demise of USAID.
Finally, as we saw last month with the earthquake in Myanmar, the US retreat means our replacement by China and Russia, which ultimately undercuts our national interest and our moral standing in the world.
This post is based on a presentation by Anne Pitcher given at the second 2025 teach-in organized by University of Michigan faculty examining “US Democracy in Peril: National and Global Implications.” The event was held March 19, 2025, in the U-M Chemistry Building. Anne Pitcher is Associate Chair of Department of Afroamerican and African Studies and Director of Graduate Studies, and is the Joel Samoff Collegiate Professor of Political Science and Afroamerican and African Studies. CPS faculty have offered ongoing expert analysis on political events of 2025. Tevah Platt of the Center for Political Studies contributed updates to this report.