Dec 21, 2017 | ANES, Current Events, Elections, Foreign Affairs, Gender, International, Michigan, Social Policy, Student Experiences
post developed by Catherine Allen-West
Since its establishment in 2013, a total of 137 posts have appeared on the Center for Political Studies (CPS) Blog. As we approach the new year, we look back at 2017’s most-viewed posts. Listed below are the posts that you, our dear readers, found most interesting on the blog this year.
What makes a political issue a moral issue? by Katie Brown and Timothy Ryan (2014)
 There are political issues and then there are moral political issues. Often cited examples of the latter include abortion and same sex marriage. But what makes a political issue moral?An extensive literature already asserts a moral vs. not moral issue distinction. Yet, there is no consensus in how to distinguish between moral and non-moral political issues. Further, trying to sort issues into these categories proves challenging.
The Spread of Mass Surveillance, 1995 to Present by Nadiya Kostyuk and Muzammil M. Hussain (2017)
 By closely investigating all known cases of state-backed cross-sector surveillance collaborations, our findings demonstrate that the deployment of mass surveillance systems by states has been globally increasing throughout the last twenty years. More importantly, from 2006-2010 to present, states have uniformly doubled their surveillance investments compared with the previous decade.
Why do Black Americans overwhelmingly vote Democrat? by Vincent Hutchings, Hakeem Jefferson and Katie Brown (2014)
In 2012, Barack Obama received 93% of the African American vote but just 39% of the White vote. This 55% disparity is bigger than vote gaps by education level (4%), gender (10%), age (16%), income (16%), and religion (28%). And this wasn’t about just the 2012 or 2008 elections, notable for the first appearance of a major ticket African American candidate, Barack Obama. Democratic candidates typically receive 85-95% of the Black vote in the United States. Why the near unanimity among Black voters?
Measuring Political Polarization by Katie Brown and Shanto Iyengar (2014)
Both parties moving toward ideological poles has resulted in policy gridlock (see: government shutdown, debt ceiling negotiations). But does this polarization extend to the public in general? To answer this question, Iyengar measured individual resentment with both explicit and implicit measures.
Is policy driven by the rich, or does government respond to all? by Catherine Allen-West (2016)
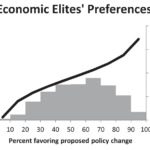 The enthusiasm for both Trump and Sanders’ messages about the influence of money in politics brings up an important question: Is policy driven by the rich, or does government respond to all? Political scientists have long been interested in identifying to what degree wealth drives policy, but not all agree on it’s impact.
Exploring the Tone of the 2016 Election by U-M undergraduate students Megan Bayagich, Laura Cohen, Lauren Farfel, Andrew Krowitz, Emily Kuchman, Sarah Lindenberg, Natalie Sochacki, and Hannah Suh, and their professor Stuart Soroka (2017)
 Political economists often theorize about relationships between politics and macroeconomics in the developing world; specifically, which political or social structures promote economic growth, or wealth, or economic openness, and conversely, how those economic outcomes affect politics. Answering these questions often requires some reference to macroeconomic statistics. However, recent work has questioned these data’s accuracy and objectivity. An under-explored aspect of these data’s limitations is their instability over time.
Crime in Sweden: What the Data Tell Us by Christopher Fariss and Kristine Eck (2017)
In a recent piece in the Washington Post, we addressed some common misconceptions about what the Swedish crime data can and cannot tell us. However, questions about the data persist. These questions are varied but are related to two core issues: (1) what kind of data policy makers need to inform their decisions and (2) what claims can be supported by the existing data.
Moral conviction stymies political compromise by Katie Brown and Timothy Ryan (2014)
 Ryan’s overarching hypothesis boils non-compromise down to morals: a moral mindset orients citizens to oppose political compromises and punish compromising politicians. There are all kinds of issues for which some citizens seem resistant to compromises: tax reform, same-sex marriage, collective bargaining, etc. But who is resistant? Ryan shows that part of the answer has to do with who sees these issues through a moral lens.
Does the order of names on a ballot affect vote choice? by Katie Brown and Josh Pasek (2013)
 Ballots list all candidates officially running for a given office so that voters can easily choose between them. But could the ordering of candidate names on a ballot change some voters’ choices?
Inside the American Electorate: The 2016 ANES Time Series Study by Catherine Allen-West, Megan Bayagich and Ted Brader (2017)
Since 1948, the ANES- a collaborative project between the University of Michigan and Stanford University- has conducted benchmark election surveys on voting, public opinion, and political participation. This year’s polarizing election warranted especially interesting responses.
Nov 30, 2017 | Current Events, Elections, Michigan, Race, Student Experiences
Post developed by Mara Ostfeld and Catherine Allen-West
The effectiveness of America’s system of democratic representation, in practice, turns on broad participation. Yet only about 60 percent of voting eligible Americans cast their vote in presidential elections. This number is nearly cut in half in off-year elections (about 36 percent), and participation in local elections is even lower. This lack of electoral engagement does not fall equally across racial and ethnic subgroups. Latinos, for one, are particularly underrepresented at polling booths across the country. In 2016, eligible Latino voters were about 20 percentage points less likely to vote than their White counterparts, and about 13 percentage points less likely to vote than their Black counterparts.
This fall, a group of 24 University of Michigan undergraduate students sought to explore this disparity and pinpoint what, if anything, works to increase Latino political participation. In the class, entitled The Politics of Latinidad, CPS Faculty Associate and U-M Political Science Professor Mara Ostfeld taught her students how to measure public opinion and challenged them to analyze the factors that affect Latino political participation.
Today, more than 50,000 Latinos live in Detroit and a majority of them reside in City Council District 6 in Southwest Detroit which is precisely where this course focused. The students began by studying the history of Latinos in Southeast Michigan and exploring how Latinos played critical roles in the city’s development dating back to before World War I. They analyzed broad trends in Latino public opinion, and considered how and why these patterns might be similar or different in Detroit. Students then designed their own pre-election polls to take into the field.
In order to understand what affects voter turnout, students surveyed over 300 residents of Southwest Detroit to measure the issues that were most important to them.

Students pictured here: Storm Boehlke, Mohamad Zawahra, Alex Tabet , Hannel So, Sion Lee.
The results illustrate some powerful patterns. Among the issues that the residents found most important, immigration and crime stood out. Forty-nine and 45 percent of Latinos listed immigration and crime, respectively, as issues of particular concern, with only 31 percent of residents saying that they felt safe in their own home.
Latinos in Southwest Detroit feel extremely high levels of discrimination. Seventy percent of Latinos surveyed said they felt Latinos face “a great deal” of discrimination. This significantly exceeds the roughly half of Latinos nationwide who say they have experienced discrimination.
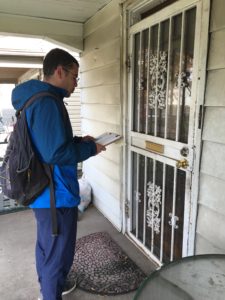
Student Alex Garcia visits residents in Detroit.
Local issues were also at the forefront of residents’ minds. Latinos had mixed views on the city’s use of blight tickets to combat housing code violations, with one third of respondents supporting them and one third opposing them.
As local organizations, like Michigan United, continue trying to get a paid sick leave initiative on the ballot in 2018, they can expect strong support among Latinos in Southwest Detroit. About two out of every three Latinos in the area indicated they would be more likely to support a candidate who supports the paid sick leave requirement.
The students then followed up with the residents a month later to see if they planned to vote in the upcoming city council election. At this point, the students implemented some interventions that have been used to increase political participation like, evoking emotions that have been shown to have a mobilizing effect, framing voting as an important social norm, and speaking with voters immediately before an election. With the election now over, students are back in the classroom analyzing the effectiveness of these interventions and will use their first-hand experience to better understand public opinion and political participation.
Jan 19, 2017 | Elections, Michigan, Student Experiences
By undergraduate students Megan Bayagich, Laura Cohen, Lauren Farfel, Andrew Krowitz, Emily Kuchman, Sarah Lindenberg, Natalie Sochacki, and Hannah Suh, and their professor Stuart Soroka, all from the University of Michigan.
The 2016 election campaign seems to many to have been one of the most negative campaigns in recent history. Our exploration of negativity in the campaign – focused on debate transcripts and Facebook-distributed news content – begins with the following observations.
Since the advent of the first radio-broadcasted debate in 1948, debates have become a staple in the presidential campaign process. They are an opportunity for voters to see candidates’ debate policies and reply to attacks in real-time. Just as importantly, candidates use their time to establish a public persona to which viewers can feel attracted and connected.
Research has accordingly explored the effects of debates on voter preferences and behavior. Issue knowledge has been found to increase with debate viewership, as well as knowledge of candidates’ policy preferences. Debates also have an agenda-setting effect, as the issues discussed in debates then tend to be considered more important by viewers. Additionally, there is tentative support for debate influence on voter preferences, particularly for independent and nonpartisan viewers. While debate content might not alter the preferences of strong partisans, it may affect a significant percentage of the population who is unsure in its voting decision. (For a review of the literature on debates effects, see Benoit, Hansen, & Verser, 2003).
Of course, the impact of debates comes not just from watching them but also from the news that follows. The media’s power to determine the content that is seen and how it is presented can have significant consequences. The literatures on agenda setting, priming, and framing make clear the way in which media shape our political reality. And studies have found that media’s coverage of debates can alter the public’s perception of debate content and their attitudes toward candidates. (See, for instance, Hwang, Gotlieb, Nah & McLeod 2006, Fridkin, Kenney, Gershon & Woodall 2008.)
This is true not just for traditional media, but for social media as well. As noted by the Pew Research Center, “…44% of U.S. adults reported having learned about the 2016 presidential election in the past week from social media, outpacing both local and national print newspapers.” Social media has become a valuable tool for the public to gather news throughout election cycles, with 61% of millennials getting political news from Facebook in a given week versus 37% who receive it from local TV. The significance of news disseminated through Facebook continues to increase.

It is in this context that we explore the nature of the content and coverage of the presidential debates of 2016. Over the course of a term-long seminar exploring media coverage surrounding the 2016 presidential election, we became interested in measuring fluctuations in negativity across the last 40 years of presidential debates, with a specific emphasis on the 2016 debates. We simultaneously were interested in the tone of media coverage over the election cycle, examined through media outlets’ Facebook posts.
To test these hypotheses, we compiled and coded debate transcripts from presidential debates between 1976 and 2016. We estimated “tone” using computer-automated analyses. Using the Lexicoder Sentiment Dictionary (LSD) we counted the number of positive and negative words across all debates. We then ran the same test over news articles posted on Facebook during the election cycle, taken news feeds of main media outlets including ABC, CBS, CNN, NBC, and FOX. (Facebook data are drawn from Martinchek 2016.)
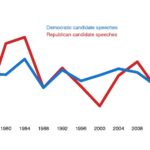
We begin with a simple measure of the volume of tone, or “sentiment,” in debates. Figure 1 shows the total amount of sentiment – the total number of positive and negative words combined, as a percentage of all words – in all statements made by each in candidate across all debates. In contrast with what some may expect, the 2016 debates were not particularly emotion-laden when compared to past cycles. From 1976 through to 2016, roughy 6.9% of the words said during debates are included in our sentiment dictionary. Hillary Clinton and Donald Trump’s speeches were essentially on par with this average; neither reached the peak of 8% (like 2004) or the low of 6% (like 2012).
Figure 1: Total Sentiment in Debates, 1976-2016
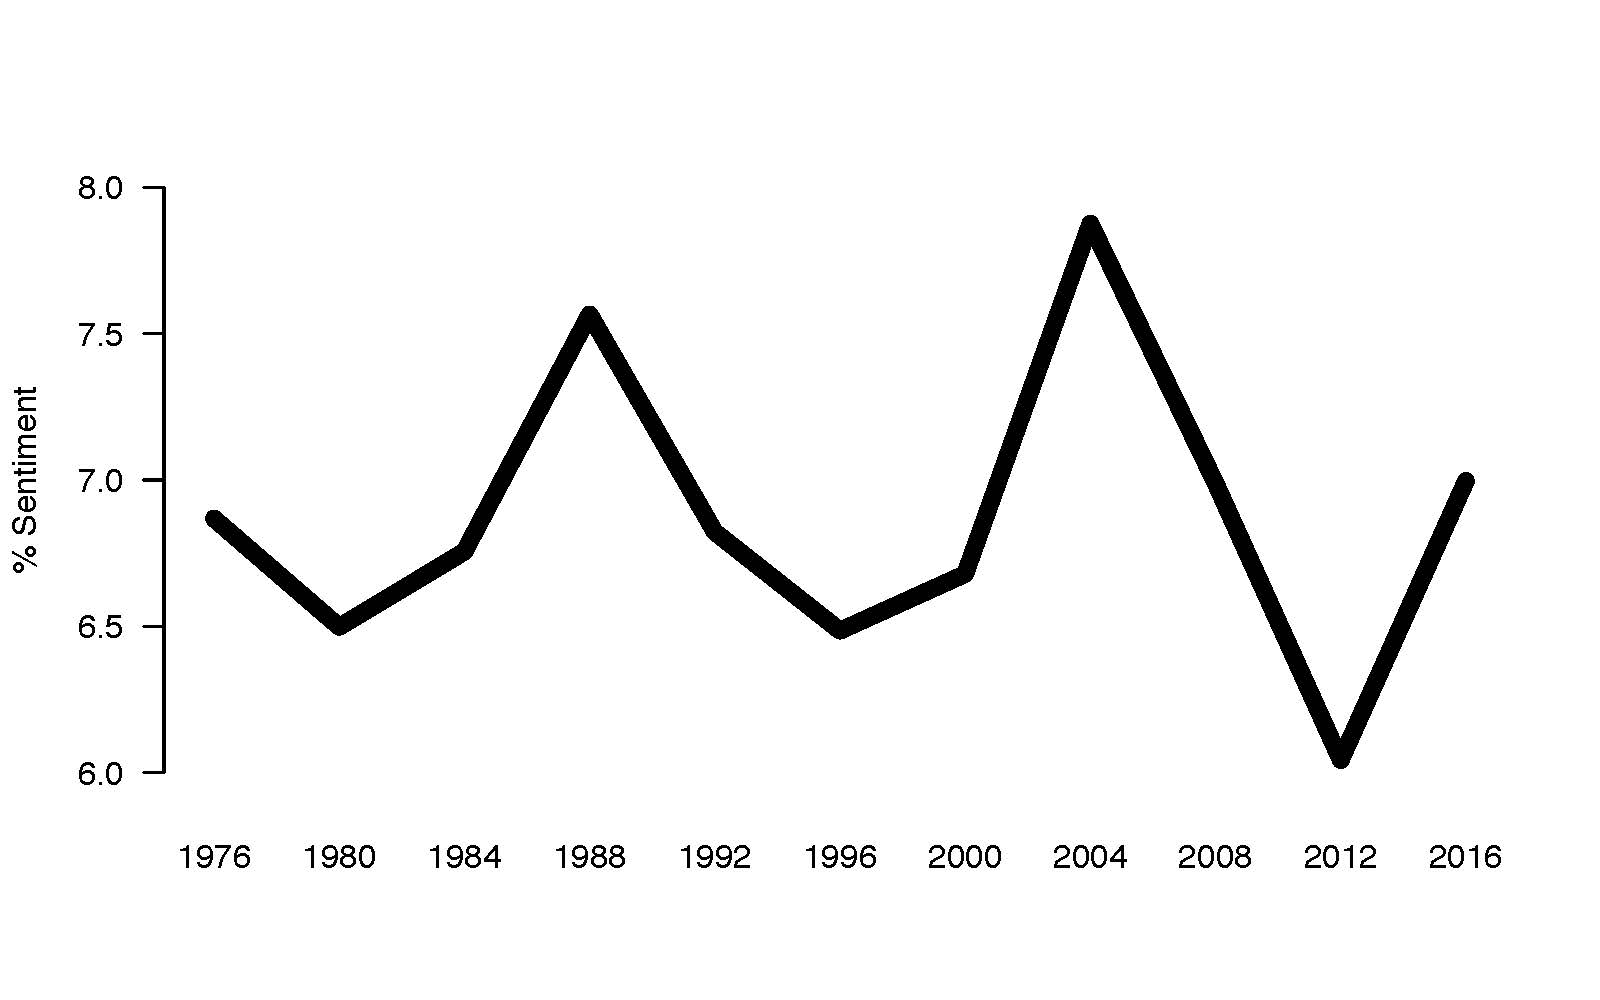
Figure 2 shows the percent of all sentiment words that were negative (to be clear: negative words as a percent of all sentiment words), and here we see some interesting differences. Negativity from Democratic candidates has not fluctuated very much over time. The average percent of negative sentiment words for Democrats is 33.6%. Even so, Hillary Clinton’s debate speeches showed relatively high levels of negativity, at 40.2%. Indeed, Clinton was the only Democratic candidate other than Mondale to express sentiment that is more than 40% negative.
Figure 2: Negativity in Debate Speeches, By Political Party, 1976-2016

Clinton’s negativity pales in comparison with Trump’s, however. Figure 2 makes clear the large jump in negativity for Donald Trump in comparison with past candidates. For the first time in 32 years, sentiment-laden words used by Trump are nearly 50% negative – a level similar to Reagan in 1980 and 1984. Indeed, when we look at negative words as a proportion of all words, not just words in the sentiment dictionary, it seems that nearly every one in ten words uttered by Trump during the debates was negative.
The 2016 debates thus appear to be markedly more negative than most past debates. To what extent is the tone of debate content reflected in news coverage? Does negative speech in debates produce news coverage reflecting similar degrees of negativity? Figure 3 explores this question, illustrating negativity (again, negative words as a proportion of all sentiment words) in the text of all Facebook posts concerning either Trump or Clinton, as distributed by five major news networks.
What stands out most in Figure 3 are the differences across networks: ABC, CNN, and NBC show higher negativity for Trump-related posts, while Fox shows higher negativity for Clinton-related posts. CBS posts reflect a more neutral position.
Figure 3: Negativity in Facebook News Postings by Major Broadcasters, By Candidate, 2016

Clearly, political news content varies greatly across news sources. Trump’s expressed negativity in debates (and perhaps in campaign communications more generally) does not necessarily translate to more negative news content, at least by these measures. For instance: even as Trump is expressing more negative sentiment than Clinton, coverage in Fox is more positive towards Trump. Of course, news coverage isn’t (and shouldn’t be) just a reflection of what candidates say. But these make clear that the tone of coverage for candidates needn’t be in line with the sentiment expressed by those candidates. Expressing negative sentiment can produce negative coverage, or positive coverage, or (as Figure 3 suggests), both.
This much is clear: in line with our expectations, the 2016 presidential debates were among the most negative of all US presidential debates. The same seems true of the campaigns, or at least the candidates’ stump speeches, more generally. Although there was a good deal of negativity during debates, however, the tone of news coverage varied across sources. Depending on citizens’ news source, even as candidates seem to have focused on negative themes, this may or may not have been a fundamentally negative campaign cycle. For those interested in the “tone” of political debate, our results highlight the importance of considering both politicians’ rhetoric, and the mass-mediated political debate that reaches citizens.
This article was co-authored by U-M capstone Communication Studies 463 class of 2016, which took place during the fall election campaign. Class readings and discussion focused on the campaign, and the class found themselves asking questions about the “tone” of the 2016 debates, and the campaign more generally. Using their professor Stuart Soroka as a data manager/research assistant, students looked for answers to some of their questions about the degree of negativity in the 2016 campaign.
Nov 29, 2016 | Elections, Michigan, National
Post written by Josh Pasek, Faculty Associate, Center for Political Studies and Assistant Professor of Communication Studies, University of Michigan.
If Rick Snyder weren’t the Governor of Michigan, Donald Trump would probably have 16 fewer electoral votes. I say this not because I think Governor Snyder did anything improper, but because Michigan law provides a small electoral benefit to the Governor’s party in all statewide elections; candidates from that party are listed first on the ballot.
Yesterday, Donald Trump was declared the winner in Michigan by a mere 10,704 votes, out of nearly 5 million presidential votes cast. Although this is not the smallest state margin in recent history – President Bush won Florida and the election by 537 votes and Al Franken won his senate seat in Minnesota by 225 (after the result flipped in a recount) – it represented a margin of 0.22%. The best estimate of the effect of being listed first on the ballot in a presidential election is an improvement of the first-listed individual’s vote share of 0.31%. Thus, we would expect Hillary Clinton to have won Michigan by 0.4% if she were listed first and about 0.09% if neither candidate were consistently listed in the first position.
It may seem surprising to suggest that anyone’s presidential vote would hinge on the order of candidates’ names, but the evidence is strong. In a paper I published with colleagues in Public Opinion Quarterly in 2014, we looked at name order effects across 76 contests in California – one of the few states that rotates the order of candidates on the ballot – to estimate the size of this benefit. We later replicated the results in a study of North Dakota. Both times, we found that first-listed candidates received a benefit and that the effect was present, though smaller, at the presidential level.
There are many reasons that voters might choose the first name, even if they started their ballots without a predetermined presidential candidate. Some individuals might have been truly ambivalent and selected the first name they had heard of (in this case, “Trump”), others may have instead checked the first straight party box – listed in a similar order – without intending to select our new President-elect. Regardless of the cognitive mechanisms involved, the end result is clear – the “will” of the voters can be diverted by seemingly innocuous features of ballot design.
How broadly is this first-position benefit a problem? Across the country, only seven states vary the order of candidate names across precincts. Another nine choose a single random order for listing candidates in each contest, but use that same order across the entire state. And the rest generally use some combination of alphabetic ordering or a listing based on who won in prior elections at the state level. Michigan’s system – prioritizing the candidate who last won the Governor’s office – is among the most common methods.
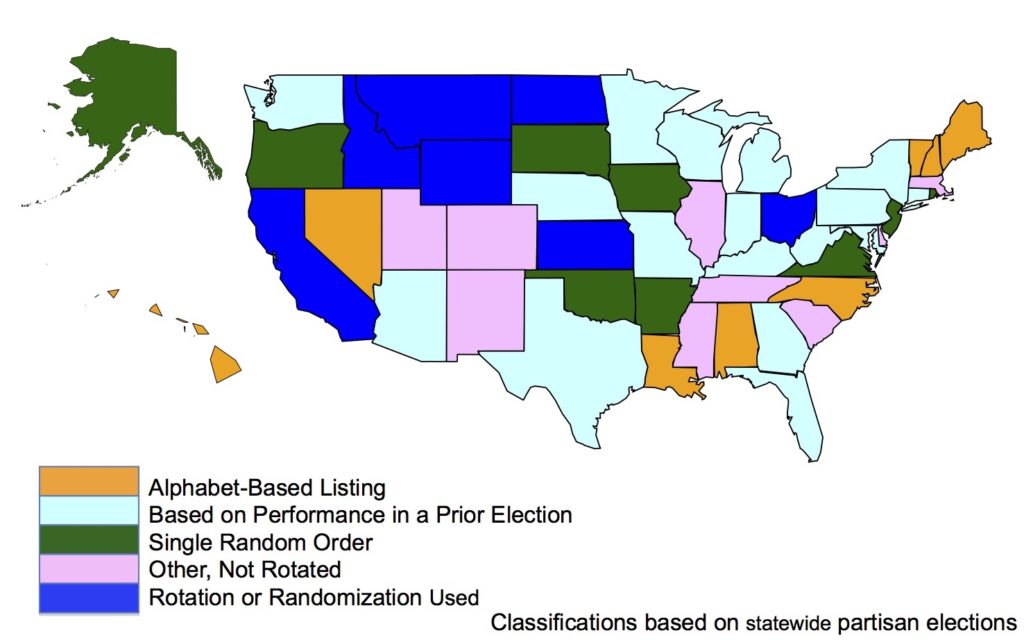
Given the control that Republicans currently hold over governorships, this bias likely helps Republicans maintain their dominance over many state legislatures. And the effects of being listed first only grow as you move down the ballot. In our study of California, we found the average benefit for a Governor was also 0.31 percent*, Senators gained 0.37 percentage points of additional votes, and candidates for other statewide offices gained an average of 0.63 percentage points.
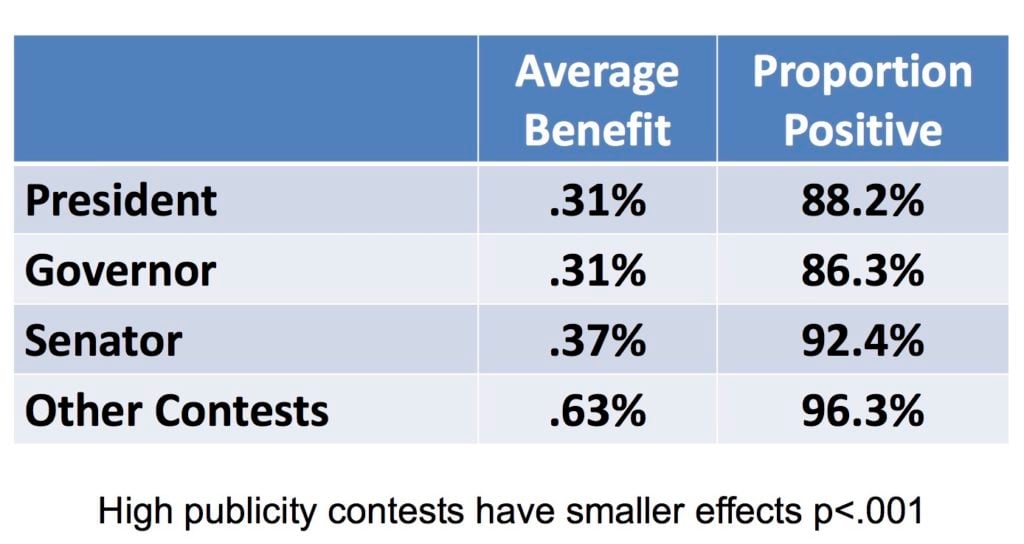
Source: Prevalence and moderators of the candidate name-order effect evidence from statewide general elections in California Pasek J., Schneider D., Krosnick J.A., Tahk A., Ophir E., Milligan C. (2014) Public Opinion Quarterly, 78 (2) , pp. 416-439.
For a better answer, we might look to the strategy adopted by Michigan’s neighbor to the South. Ohio produces a unique ballot for each precinct where the ordering of candidates’ names is rotated. Although it is too late to prevent this effect from altering the 2016 election, it may have less of an impact if everyone were not filling out ballots with the same candidates listed first.
*this would likely be larger if California did not elect its Governors in non-presidential years.
Jul 26, 2016 | Michigan, Race, Social Policy
Post developed by Rosemary Sarri in coordination with Linda Kimmel.
This blog includes a brief report of ongoing research on career patterns of youth who drift from the child welfare system to the juvenile and adult justice system. It is taken from a paper that has been published by Rosemary Sarri, Elizabeth Stoffregen and Joseph Ryan, researchers with affiliations in the University of Michigan’s Center for Political Studies (CPS), Population Studies Center (PSC), and School of Social Work.
 A growing body of research has shown that children who run away from foster care placement increase their probability of subsequent involvement in the juvenile and adult justice systems, especially for males. In the research reported here we used Michigan Department of Human Services and Wayne County administrative records to examine the experiences of two samples of youth in the child welfare system, one of which were youth who had run away from placement one or more times, and they were compared with a matched sample who had no history of running away from placement. The study covered their experiences over an eleven-year period from 2003-2011. Those selected were twelve years or older and had been assigned to the agency because of neglect or abuse by a parent. Most were also identified as having a behavioral problem such as mental illness, substance abuse or delinquency. As is the case throughout the U.S., children in this study were disproportionately youth of color (84%). Most were children of single parents and resided in urban areas of poverty, unemployment, crime and social disorganization. A slight majority were female, most of whom were placed in individual foster care and small community agencies whereas males were more likely to be placed in residential care away from their home community. When the males ran away, they typically returned to their home communities and were involved in “survival crime” until apprehended. On the other hand most females remained in their home community and often circulated among family relatives but were seldom arrested.
(more…)
Feb 13, 2014 | Michigan, National, Social Policy
Post developed by Katie Brown in coordination with Rosemary Sarri.

Photo credit: Thinkstock
400,000 youth are placed out of home in residential treatment institutions in the United States because they were abused or neglected their family. Just 2% of these youth placed out of home in institutions will run away each year, compared to the annual runaway rate of of 6-8% for American youth overall. But the ramifications for the institutionalized runaway youth are grave, including homelessness, poverty, substance abuse, exploitation, and crime.
Center for Political Studies (CPS), School of Social Work, and Women’s Studies Professor Emerita Rosemary Sarri studies the impact of social policy on children. A forthcoming paper with her colleagues Joseph P. Ryan and Elizabeth Stoffregen, who are also of the Institute for Social Research (ISR), considers the serious risks for these youth running away from the child welfare system. The article asks: Does running away from these institutional placements pose an increased risk of future involvement with the juvenile and/or adult justice systems?
Focusing on Wayne County, Michigan, home of the city of Detroit, the study includes 371 children aged twelve or older from the child welfare system that ran away at least once in 2003, matched against similar children in the system that did not run away. The data trace involvement of the youth from the two groups in the justice system over eight years.
Sarri finds that running away is indeed associated with negative outcomes. Overall, youth who run away from institutional placements have a 40% chance of ending up in the adult justice system. For males, this increases to 71.5%. The table below breaks down the most serious offenses by status and gender for the youth who ran away from institutions. Indeed, youth who run away from institutions commit more serious crimes, especially males.
Most Serious Juvenile Justice Offense by Gender and Runaway Status (the term “AWOL” identifies youth who ran away from institutions)

Given these staggering results, what can be done? Most of the youth are neglected, often with deep issues relating to substance abuse, mental health, homelessness, and crime. As such, Sarri calls for a positive, restorative approach that sets goals and offers resources to help youth achieve them. The Annie E. Casey Foundation and the Center for Juvenile Justice Reform have developed an inter-agency collaborative proposal to provide more effective treatment for these “crossover” youth who are at high risk when they drift to the justice system.
 There are political issues and then there are moral political issues. Often cited examples of the latter include abortion and same sex marriage. But what makes a political issue moral?An extensive literature already asserts a moral vs. not moral issue distinction. Yet, there is no consensus in how to distinguish between moral and non-moral political issues. Further, trying to sort issues into these categories proves challenging.
 By closely investigating all known cases of state-backed cross-sector surveillance collaborations, our findings demonstrate that the deployment of mass surveillance systems by states has been globally increasing throughout the last twenty years. More importantly, from 2006-2010 to present, states have uniformly doubled their surveillance investments compared with the previous decade.
  The enthusiasm for both Trump and Sanders’ messages about the influence of money in politics brings up an important question: Is policy driven by the rich, or does government respond to all? Political scientists have long been interested in identifying to what degree wealth drives policy, but not all agree on it’s impact.
 Political economists often theorize about relationships between politics and macroeconomics in the developing world; specifically, which political or social structures promote economic growth, or wealth, or economic openness, and conversely, how those economic outcomes affect politics. Answering these questions often requires some reference to macroeconomic statistics. However, recent work has questioned these data’s accuracy and objectivity. An under-explored aspect of these data’s limitations is their instability over time.
 Ryan’s overarching hypothesis boils non-compromise down to morals: a moral mindset orients citizens to oppose political compromises and punish compromising politicians. There are all kinds of issues for which some citizens seem resistant to compromises: tax reform, same-sex marriage, collective bargaining, etc. But who is resistant? Ryan shows that part of the answer has to do with who sees these issues through a moral lens.
 Ballots list all candidates officially running for a given office so that voters can easily choose between them. But could the ordering of candidate names on a ballot change some voters’ choices?


 A growing body of research has shown that children who run away from foster care placement increase their probability of subsequent involvement in the juvenile and adult justice systems, especially for males. In the research reported here we used Michigan Department of Human Services and Wayne County administrative records to examine the experiences of two samples of youth in the child welfare system, one of which were youth who had run away from placement one or more times, and they were compared with a matched sample who had no history of running away from placement. The study covered their experiences over an eleven-year period from 2003-2011. Those selected were twelve years or older and had been assigned to the agency because of neglect or abuse by a parent. Most were also identified as having a behavioral problem such as mental illness, substance abuse or delinquency. As is the case throughout the U.S., children in this study were disproportionately youth of color (84%). Most were children of single parents and resided in urban areas of poverty, unemployment, crime and social disorganization. A slight majority were female, most of whom were placed in individual foster care and small community agencies whereas males were more likely to be placed in residential care away from their home community. When the males ran away, they typically returned to their home communities and were involved in “survival crime” until apprehended. On the other hand most females remained in their home community and often circulated among family relatives but were seldom arrested.

