Faculty from the University of Michigan offered their expertise on these issues at a February “teach-in” panel at Angell Hall to help students understand how recent policy changes have been made and why they matter for democracy.
So how did we get to this point? And where do electoral politics go from here?
At the February teach-in, political scientist Robert Mickey highlighted the role of America’s history of white supremacy and focused on the story of party elites, and the evolution of the Republican Party “from the mainstream, conservative party committed to democracy, into something very different.”
Republican Radicalization
Robert Mickey’s account began with the observation that US democracy is young, given its slow, historical turn to secure voting rights for all adults and the civil rights and liberties needed to make elections free and fair. Following the Civil War, efforts to build a biracial democracy were eventually turned back, with Jim Crow segregation in much of the country underwritten by state-sponsored violence. As Mickey describes in his book, Paths Out of Dixie: The Democratization of Authoritarian Enclaves in America’s Deep South, 1944-1972, the 11 states of the Confederacy remained enclaves of authoritarian rule, sustained by the federal democracy and the national Democratic Party, with Democrats “maintaining a stranglehold on nearly every elected office in the region for seven decades.” America’s history of racist and xenophobic appeals to white voters should make the current wave of party-led democratic backsliding less surprising, said Mickey.
The rooster icon and banner, “White Supremacy for the Right,” served as the emblem of the Alabama Democratic Party from 1904 to 1966.
The current threat to American democracy has links to the authoritarianism of the preceding century but with novel features. Focusing on the last one-half century of stable democratic rule, Mickey argued that three trends have combined in recent decades to lead us to today’s challenging moment.
The first is elite polarization. The move of culturally conservative Southern whites to the Republican Party in the 1970s widened partisan disagreement, and that party’s members of Congress have become much more extreme over time. Following their elites, growing numbers of voters have viewed the opposing party with increasing social antipathy, hatred, and distrust. And with Congress passing fewer bills every year, voters have become more tolerant of antidemocratic behavior by their own party’s politicians, Mickey said.
Second, increasing economic inequality over recent decades has motivated the rich to defend their wealth, principally through massive campaign contributions. This “wealth defense” has transformed the Republican party; its mega-donors have demanded radical cuts to the regulation of business, the decimation of popular government programs, and the nomination of judges who support these goals.
Neither of these trends alone necessarily threaten democracy, said Mickey, but they have dangerously combined with “a growing panic about the country’s ‘ownership’ among millions of white Americans.” That panic is worsened by the country’s approaching “majority minority” milestone and the “reaction of many whites to the mere fact of Obama’s presidency.”
The result: Republicans, constrained by their donors from changing their economic appeals to white voters, have opted to invoke cultural issues. The precursor to MAGA is the Tea Party revolt of grassroots conservatives more than a decade ago who “talked a good game about being upset about budget deficits and debt” but were actually much more united on and energized by the issue of immigration, said Mickey.
“These trends have combined to radicalize the Republican Party into an organization that’s no longer committed to democracy,” said Mickey. “Right now, it’s an uneasy combination of white nationalism and libertarianism.”
We now see evidence that the party is backing away from democracy in several ways: Since 2000, state-level Republicans have worked to make it harder to vote, Mickey said. Second, a large majority of House Republicans refused to certify Biden’s election, even after the invasion of the Capitol. Third, Republicans now in Congress have refused to conduct oversight of the executive when their own party leader occupies the White House.
Where Do We Go From Here?
Looking ahead, Mickey closed on the point that an organizationally “hollow” Democratic party – in his view, a “feckless gerontocracy” that failed to strengthen even modestly the Voting Rights Act in 2022 – can’t save U.S. democracy. Even more important, in a two-party system, both parties have to be committed to democratic rule. As political scientist Adam Przeworski tells us, democracy is “a system in which parties lose elections.” For Przeworski, democracies remain stable only when its major parties accept the results of elections, content to pursue office another day.
“Republican [candidates] who lose their races are increasingly likely not to concede,” said Mickey. “Thus, the Republican party has to remake itself for American democracy to be safe.”
“That will probably require multiple defeats to reset their incentives,” said Mickey. A party committed to democracy must be strong enough internally “to push out their extremists: The Nazis, the Kanyes, the Jewish-space-laser believers, and they need to take their oversight responsibility seriously…. Democracy-loving conservatives don’t have the party home that they deserve, and they need to rebuild one immediately.”
Robert Mickey is an associate professor in the Department of Political Science at the University of Michigan. Vincent Hutchings is the Hanes Walton Jr. Collegiate Professor in Political Science and Afroamerican and African Studies. Both are affiliated with the Center for Political Studies at the University of Michigan Institute for Social Research.
This post is part of a series that focuses on the 2025 teach-in held at Angell Hall that also marked the 60th anniversary of the first teach-in convened in the United States, held at the University of Michigan during the Vietnam War protests of 1965. Recordings of the talks are available on YouTube.
This post was written by Tevah Platt of the Center for Political Studies, with contributions from Robert Mickey. The second of two complimentary posts on this topic, Vincent Hutchings shared the key insight in Pt. 1 that U.S. election outcomes often hinge on attitudes toward salient social groups, and, especially, Black Americans.
Faculty from the University of Michigan offered their expertise on these issues at a “teach-in” panel at Angell Hall this month. The aim was to help students understand how recent policy changes have been made and, in the words of organizer Josh Pasek, “why those processes matter for whether or not we remain a democracy.”
So how did we get to this point?
This is the first of two posts that will answer this question.
Teach-in presentations by political scientists Vincent Hutchings and Robert Mickey gave complimentary accounts: Speaking on American public opinion, Hutchings shared the key insight that U.S. election outcomes often hinge on attitudes toward salient social groups, and, especially, Black Americans.
Mickey’s talk, the subject of our forthcoming post (Part 2), focused on the story of party elites, and the evolution of the Republican Party “from the mainstream, conservative party committed to democracy, into something different.”
The Racial Divide
Decades of research on American public opinion may help us to understand the results of this election and others, Hutchings said, by correcting a common assumption that Americans pay attention to politics and cast votes based on ideology and policies.
“American voters are woefully uninformed about politics,” Hutchings said. Only about 20% of voters are familiar with the ideological terms ‘liberal’ and ‘conservative,’ and a significant minority – maybe even a majority, depending on how you count– don’t know which party is the more conservative party. “You might think that is hyperbole,” said Hutchings. “I assure you, it is not.”
The perspective they do employ, said Hutchings, is one that focuses on “salient social groups.”
(Of note, the American National Election Studies, which has surveyed voters in every election since 1948, is a leading source of what we know about the U.S. electorate; Hutchings was a former principal investigator on the project.)
Politicians play to grievances, fears, and stereotypes, leveraging divisions based on race, religion, gender, and sexuality to build coalitions.
“Perhaps the most salient social group– certainly the most persistent and consistent in terms of its political impact– has been racial groups: In particular, attitudes about Black Americans,” said Hutchings. “It is, after all, the issue around which we had the bloodiest war in American history, the Civil War. It’s the group around which we had the largest social movement in the 20th century: The Civil Rights Movement. And it’s the issue around which we had the largest social movement of the 21st century: Black Lives Matter.”
“The racial divide is the biggest divide in American politics,” said Hutchings. It is the foundation of our current party system that, since the 1960s, has pitted one party that was “mostly the champion of civil rights, sometimes reluctantly,” against the party that was not.
“I’m not here to make a moral claim,” said Hutchings, “but I am here to make a factual claim that race is the chief dividing point in American politics. …If we want to get a sense of how we arrived at this point we’re at now in our political collective lives, we can’t ignore race.”
Where Do We Go From Here?
To win future elections, Democrats would need to mobilize non-white voters without alienating white voters, while Republicans will confront the “diminishing number of angry white men,” said Hutchings. We can expect politicians to continue to prey on social divisions in the electorate: “They’re going to keep doing it as long as you keep responding to it,” he said.
Vincent Hutchings is the Hanes Walton Jr. Collegiate Professor in Political Science and Afroamerican and African Studies. Robert Mickey is an associate professor in the Department of Political Science at the University of Michigan. Mickey, Hutchings, and Pasek are all affiliated with the Center for Political Studies at the University of Michigan Institute for Social Research.
This post is part of a series that focuses on the 2025 teach-in held at Angell Hall that also marked the 60th anniversary of the first teach-in convened in the United States, held at the University of Michigan during the Vietnam War protests of 1965. Recordings of the talks are available on YouTube.
This post was written by Tevah Platt of the Center for Political Studies, with contributions from Vincent Hutchings and Robert Mickey.
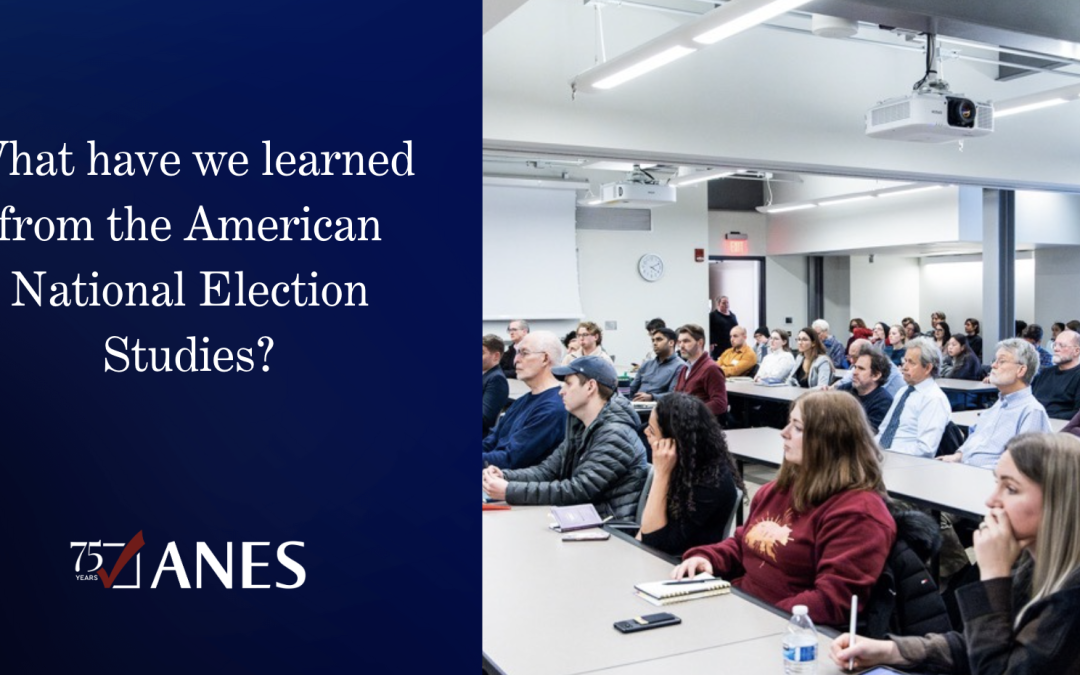
At 75 years, the American National Election Studies (ANES) now comprises data on a third of all presidential elections in U.S. history. Duke political scientist John Aldrich has written that the ANES has provided a research design and common core measurement instrument to study dynamics of public opinion and collective action over an increasingly long historical sweep: “This time-series is unprecedented in its breadth of questions, length of time, and commonality of research design and instrumentation,” he wrote in “The ANES as ‘Gold Standard’ for Survey Research in the Twenty-First Century” (March 2017). “From this, an understanding of historical dynamics is only now becoming fully possible.”
In recognition of the ANES’s 75th anniversary, the Center for Political Studies reached out to scholars to ask what the study has revealed about key moments, decades, or patterns in American history. Their answers captured two prevailing themes: Increasing polarization and partisan alignment around issues of race. Here are a few of the responses we received:
“The first thing that comes to mind is the major realignment of the American party system that occurred (mostly during the 1960s) because of the civil rights movement, desegregation, and busing. Everything we know about affective polarization among the general public comes from survey data, much of it gathered by the ANES. We are now learning about the alarming recent growth of conspiracy beliefs and anti-democratic populism beliefs among the American public.”
– Richard R. Lau, Professor of Political Science at Rutgers University
“The ANES has been pivotal in the emergence of research on polarization – especially work on the way partisans feel about both their own party, and the other party. It is only through the over-time aspect of the ANES – and the consistency in measurement – that scholars saw fundamental changes in people’s feelings toward the opposing party.”
– Yanna Krupnikov, Professor of Communication and Media, University of Michigan; Faculty Affiliate, Center for Political Studies
“Donald Kinder used the ANES to make a strong case for changes in the nature of white racism in America and for its continued political clout. Then Michael Tesler and I (2010) and Kinder and Dale-Riddle (2011) used it effectively to demonstrate how racialized the 2008 and 2012 presidential elections were. Nick Valentino and I (2005) used it in a more historical sense, to make a case for the gradual partisan realignment of the white South in the last half of the 20th century around racial issues”
– David O. Sears, Distinguished Professor Emeritus, UCLA
“I think that the single most important contribution of ANES to the study of American politics was the concept of party identification. In the 1940s, the study of US politics was done through demographic analysis at the local level. Then in the 1948 and 1952 studies, Michigan began to organize national studies of the electorate. In 1952 they started measuring attitudes about Eisenhower and Stevenson and the role of parties, and with the “Michigan Model” they were able to move from group-level analysis to national analysis. You can’t see a study of the electorate now without a reference to the difference between Democrats and Republicans, and that can be traced directly back to the 1952 ANES study. …As elections have become more polarized, the ANES’ feeling thermometer questions measuring affective polarization have become increasingly important. In the 1990s, political elites became more polarized and began voting in bodies. Voting across party lines began disappearing. Citizens learned from these votes what it meant to be a Democrat or a Republican and began to divide in the same way. …It’s impossible to disentangle this from the rise of cable TV with commentaries on issues from the Left and the Right. These shifts in the presentation of politics on TV occurred simultaneously with changes in Congressional voting caused a change in voting behavior.” –Michael Traugott, Center for Political Studies
– Michael Traugott, Professor of Communication Studies, Research Professor, Center for Political Studies, University of Michigan
One of the early discoveries of the founders of the American National Election Studies (ANES) was that psychological attachments to parties themselves are group identities: Americans often vote as their parents did, and maintain allegiance to parties over time.
The ANES has surveyed Americans before and after every U.S. presidential election since 1948, providing us with rich insights into why and how Americans vote. In recognition of the ANES’s 75th anniversary, the Center for Political Studies reached out to scholars to ask what we know about American politics, voters and voting behaviors because of the ANES. This is what they told us:
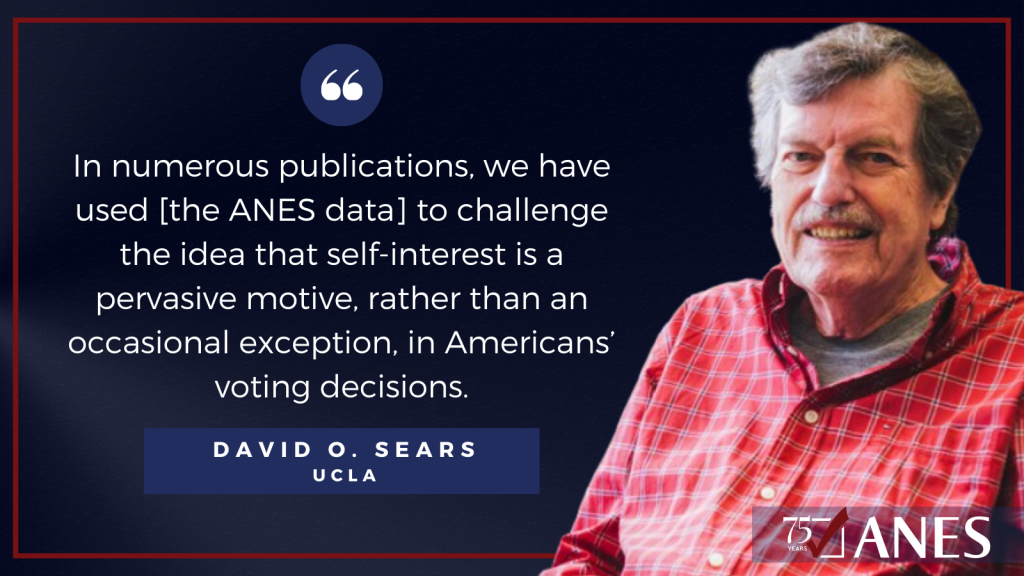
“In numerous publications (for a summary see Sears & Funk, 1991) we have used it to challenge the idea that self-interest is a pervasive motive, rather than an occasional exception, in Americans’ voting decisions.”
– David O. Sears, Distinguished Professor Emeritus, UCLA
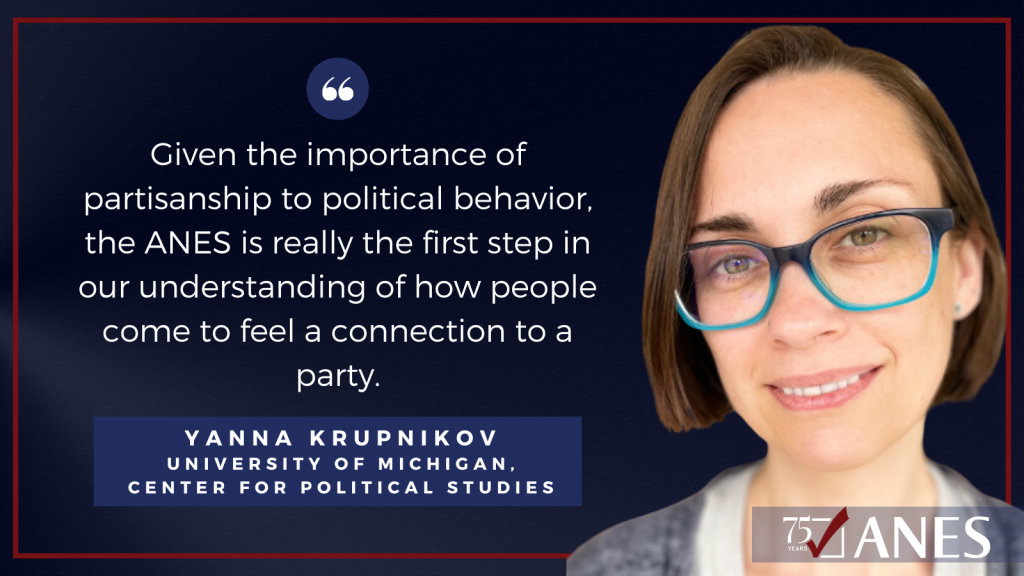
“The ANES is one of the earliest surveys of the American public. Much of the research on partisanship, for example, emerges directly from the way that the ANES asks people about their party identification. Concepts like a ‘leaning independent’ – someone who identifies as an independent but ‘leans’ toward one of the two parties– largely exist because of the ANES. Given the importance of partisanship to political behavior, the ANES is really the first step in our understanding of how people come to feel a connection to a party.”
– Yanna Krupnikov, Professor of Communication and Media, University of Michigan; Faculty Affiliate, Center for Political Studies
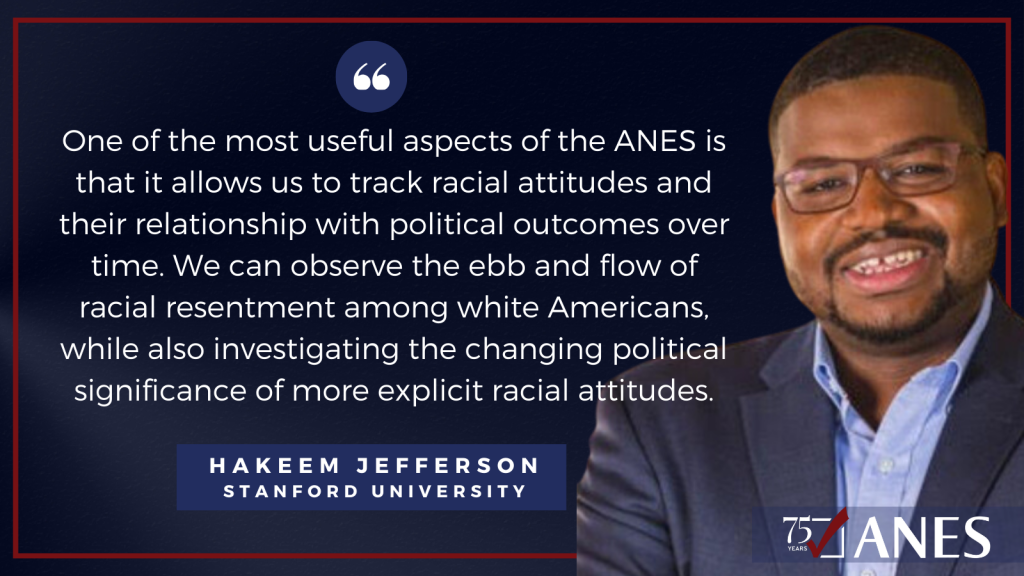
“As a scholar of race and politics, one of the most useful aspects of the ANES is that it allows us to track racial attitudes and their relationship with political outcomes over time. For example, we can observe the ebb and flow of racial resentment among white Americans, while also investigating the changing political significance of more explicit racial attitudes. In more recent years, the ANES has allowed for the careful study of white identity and its relationship to some of the most consequential political outcomes of our time, including white Americans’ support for Donald Trump. There is no doubt that the ANES will remain a vital tool for generations of scholars to come.”
– Hakeem Jefferson, Assistant Professor of Political Science, Stanford University
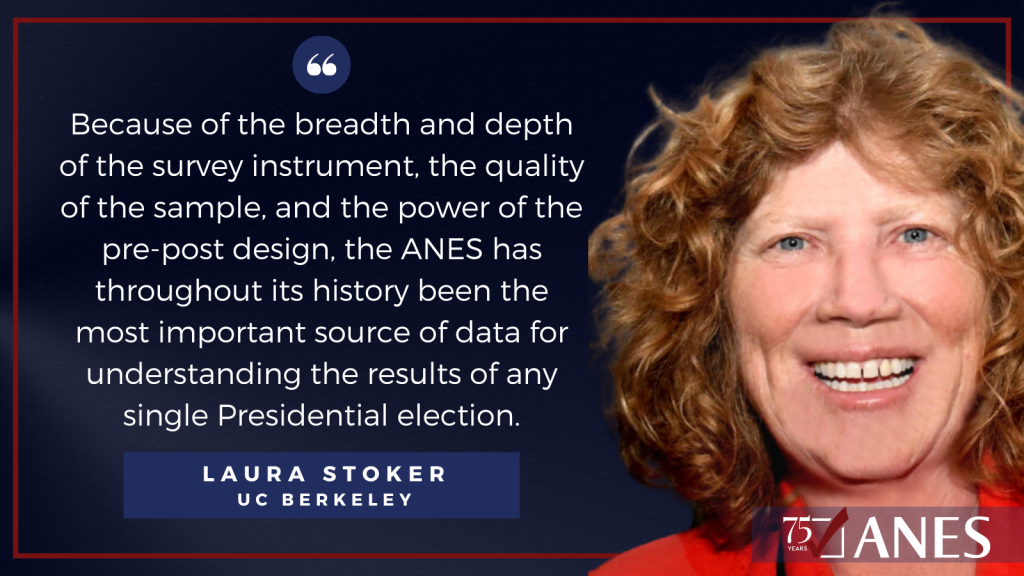
“The contemporary study of American public opinion and elections rests on the foundation of research from the earliest ANES studies, represented in highly influential publications such as The American Voter (Campbell, Converse, Miller, and Stokes 1960), Elections and the Political Order (Campbell, Converse, Miller, and Stokes 1967), and “The Nature of Belief Systems in Mass Publics,” (Converse, 1964). Scholars today continue to work with many of the concepts, measures, and ideas introduced in those early studies. Because of the breadth and depth of the survey instrument, the quality of the sample, and the power of the pre-post design, the ANES has throughout its history been the most important source of data for understanding the results of any single Presidential election. Because the ANES has made continuity in the survey instrument a priority, the data have also been invaluable for identifying and explaining how public opinion and voting behavior have changed over time. Scholars have used the data to make inter-election comparisons (e.g., support for Trump in 2016 vs. 2020, dynamics in the Obama elections compared to before or after) as well as longer-term comparisons (e.g., in the size of voting gaps by party, gender, race, and place; in levels of affective polarization, partisan defection, independent identification, voter turnout, and political trust). At the same time, the ANES has continued to innovate and respond to new political contexts in developing its questionnaires, fueling new research agendas. For example, the most recent study included new questions regarding populism, racial and policy attitudes, electoral integrity, social media use, and rural resentment.”
– Laura Stoker, Professor of the Graduate School in the Department of Political Science at the University of California, Berkeley, Emerita
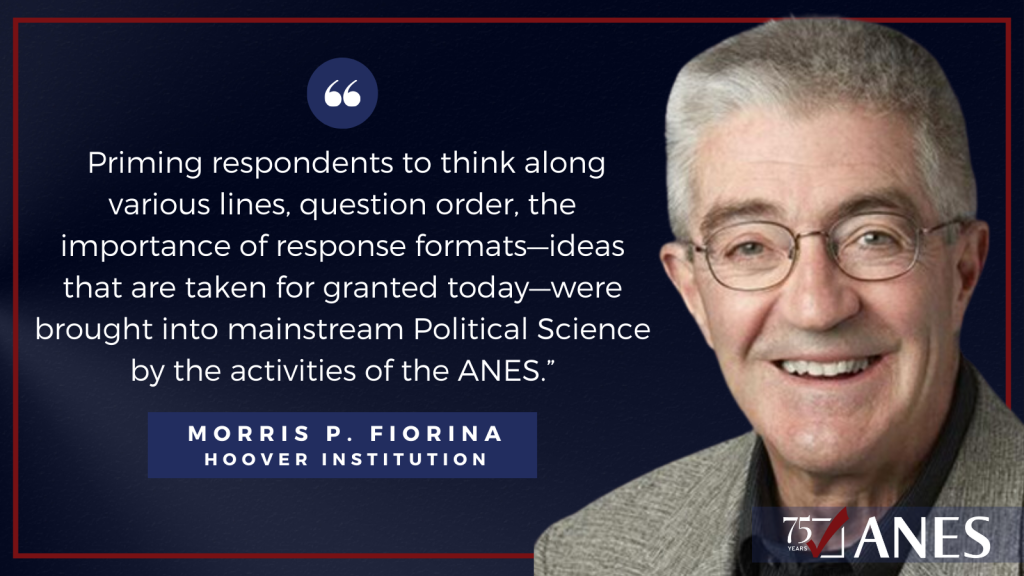
“Looking back over the decades, it’s worth noting the enormous intellectual progress that the ANES participated in and helped to generate—when you’re low on the learning curve progress is rapid. Many ideas that are imparted to undergraduates in Survey Research 101 today were being discovered or becoming appreciated in the early 80s. I remember Don Kinder bringing in a paper to a Board meeting showing the different responses obtained by framing survey items in different ways. Priming respondents to think along various lines, question order, the importance of response formats—ideas that are taken for granted today—were brought into mainstream Political Science by the activities of the ANES.”
– Morris P. Fiorina, the Wendt Family Professor of Political Science and a Senior Fellow, Hoover Institution
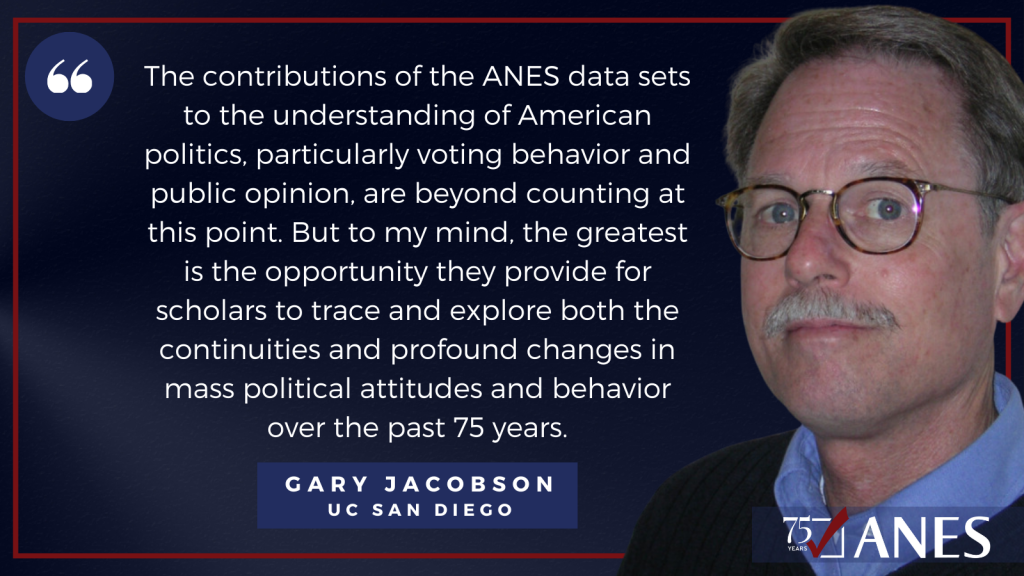
“The contributions of the ANES data sets to the understanding of American politics, particularly voting behavior and public opinion, are beyond counting at this point. But to my mind, the greatest is the opportunity they provide for scholars to trace and explore both the continuities and profound changes in mass political attitudes and behavior over the past 75 years. In my primary research domain of congressional elections, the world of the 2020s looks vastly different from the world of the 1960s and 1970s. The time series studies have documented key changes in real time (as measured in election years), and as new developments have raised new questions, being able to go back and reconsider old data in a new light has been invaluable for anyone trying to figure out what has happened. A good example is how the time series has revealed the growing coincidence of ideology, policy preferences, religiosity, and demography (race, gender, age, and education) with partisanship, trends that have made the party coalitions increasingly homogeneous internally and distant from one another. If you are looking to explore the causes and consequences of the polarized partisanship that now plagues us, this is an excellent place to start.”
–Gary Jacobson, Distinguished Emeritus Professor of Political Science, UC San Diego
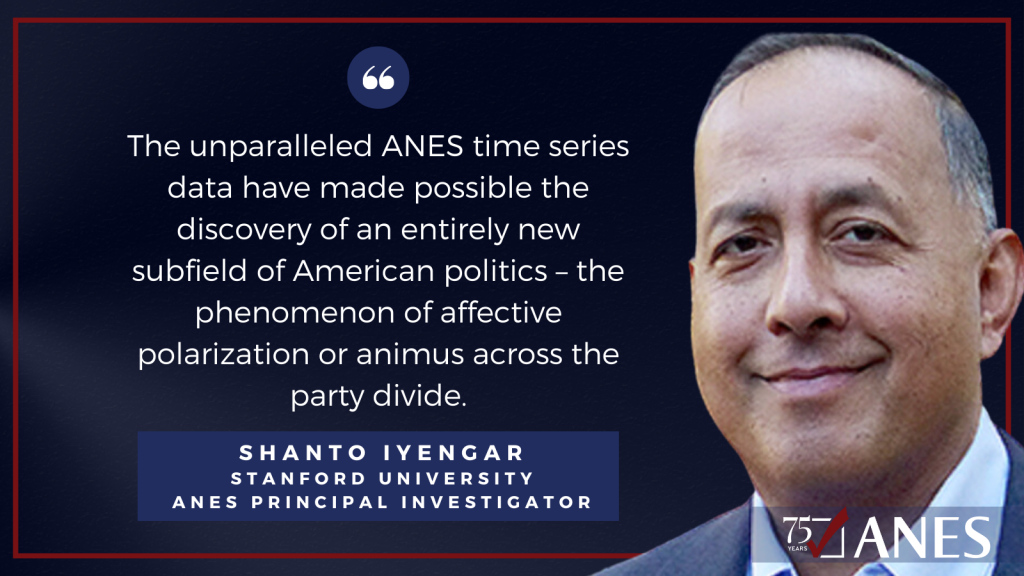
”The unparalleled ANES time series data have made possible the discovery of an entirely new subfield of American politics – the phenomenon of affective polarization or animus across the party divide. Using the ANES feeling thermometers, which date back to the 1970s, scholars documented a significant increase over time in partisans’ hostility toward their opponents. This finding, first published in 2012, has since generated more than 350 published papers (with the term affective polarization in the title) and approximately 1,2000 citations (from Google Scholar). I would add that the ANES database has greatly facilitated my own research over the past decade into partisan affect and the underlying causes of polarization.”
– Shanto Iyengar, Professor of Political Science and Director of the Political Communication Laboratory, Stanford University, and ANES Principal Investigator
“Thanks to the ANES’s commitment to high-quality data, scientists have advanced what we know about social attitudes, policy preferences, and voting behavior, among many other topics. More specifically, ANES data has allowed scientists to unveil opinions on specific issues for different segments of the electorate- for instance, how Americans view immigration, how education relates to political knowledge and participation, or what people like about specific presidential candidates. The large ANES questionnaire gives scientists an extensive list of topics to explore and to understand the American electorate.”
– Francy Luna Diaz, Ph.D. Candidate in Political Science at the University of Michigan
“[Because of the ANES], we know about the predominant importance of party identification in political evaluations and vote choices. We know how much motivated reasoning exists in politics, and how much of it is driven by party ID. We know about the poor consistency and lack of ideological constraint in the policy views of the American public. We know how little the public knows about their representatives in Congress. We know that the variance in general political knowledge among the American public is high, but the mean is low. We know about the different types of political behaviors that some people perform, and how many performers there are for each of those. Despite what economists think, we know how little tangible self-interest has to do with most political attitudes. We know a great deal about how race, and racism, shapes policy views in the country. We have learned a great deal about the gender gap in American politics.”
– Richard R. Lau, Professor of Political Science at Rutgers University
A new book by leading scholars of partisanship explores the recent consequences of political hostility, and how it does and doesn’t affect democratic functioning
Is partisan hostility damaging American democracy?
The short answer is yes: Political animosity, which scholars recognize as the defining feature of American politics this century, can degrade democratic functioning. But the question begs for a long answer: To see and face the implications of partisan hostility, we need a nuanced understanding of its effects and its boundaries.
A forthcoming book by some of the foremost scholars of polarization amasses empirical evidence of the consequences of political hostility in recent years, and offers a theory of when it affects political beliefs and behaviors.
Study after study has shown a striking rise in negative feelings Americans hold toward the opposing party– a concept scholars call affective polarization. Roughly 8 in 10 partisans report these negative feelings, according to Pew Research Center, and the majority use pejorative words– such as “hypocritical,” “closed-minded,” and “immoral” to describe their counterparts. While partisans have maintained stable attitudes toward their own party over time, their “ratings” of the other party have plummeted since 1980 and notably in the last decade. The authors cite New York Times columnist David Brooks’s taut summation– in the age of affective polarization, “we didn’t disagree more– we just hated each other more.”
“We find that partisanship does shape political beliefs and behaviors, but its effects are conditional, not constant,” said co-author Yanna Krupnikov, an affiliate of the Center for Political Studies at the University of Michigan Institute for Social Research and a professor in the Department of Communication and Media. “It seems most likely to guide beliefs on issues that don’t have direct personal consequences, and it’s most powerful when parties send strong, clear cues on an issue.”
The authors test that framework using panel survey data from a 21-month period spanning 2019, 2020, and 2021– three tumultuous years that occasioned the COVID-19 pandemic and vaccine distribution; the murder of George Floyd and subsequently the largest protest movement in US history; the 2020 election and January 6 insurrection; two impeachments, and a shift in the congressional majority.
The best data for measuring animosity over time, according to the authors, is the “feeling thermometer” in the American National Election Studies (ANES) survey, where respondents rate their feelings toward a party or issue on a 101-point scale, in which “50 degrees” is the neutral fulcrum between “warmer” or “colder” feelings. The authors use that measure in their own data along with additional measures: trust questions, trait ratings– where respondents evaluate how well positive and negative traits describe each party– and “social distance measures,” where respondents rank their comfort level in situations like having their child marry someone from the other party.
They find the effects of political hostility are most concentrated in individuals with comparatively high animosity, who are a distinctive group in America– with particularly strong political identities and high levels of political engagement. These “high animus” partisans are more likely to take and act on party cues about where they “should” stand, and more likely to reject the possibility of their own party compromising.
We can observe that animosity can fuel polarization on issues that might otherwise be informed by independent deliberation. In 1997, for example, Democrats and Republicans were equally likely to believe in climate change science; today, there’s a pronounced divergence that can only be explained by parties staking a claim on the issue, Krupnikov said.
The authors focus particularly on the case of politicization that drove the gap between Democrats and Republicans’ behavior during the COVID-19 pandemic. Political hostility is more likely to shape partisan evaluations of party leaders, they report, but the case of Dr. Anthony Fauci demonstrates how party cues can politicize specific targets. The authors also found the effects of COVID’s politicization on behaviors like vaccine or mask resistance diminished when actors confronted the personal stakes of the illness. To further understand these party signal dynamics and when they matter, the authors investigated the effect of animosity on policy positions in cases where issues are politicized by both parties, one party, and neither party.
“The advantage of our theory is its recognition that partisan divides are not inevitable and on many issues most people agree,” said John Barry Ryan, also an affiliate of the Center for Political Studies. “Overall, we see that animosity shapes decision-making by heightening the effects of party cues.”
The authors argue that while partisan hostility has degraded US politics—for example, politicizing previously non-political issues and undermining compromise—it is not in itself an existential threat. Political hostility has little effect on popular beliefs in fundamental norms, and it’s unlikely to directly lead to democratic breakdown or collapse, they say. They also find that overall, partisans do not strongly support undemocratic practices.
Yet there is considerable cause for concern that partisan hostility may erode democracy over time. Political hostility can result in blind loyalty and decision-making based purely on team mindset– with worrying implications– and animosity can spiral because it has self-perpetuating effects.
“We find that animosity has clear, predictable effects on prioritizing party over other considerations, especially for issues that lack clear and immediate consequences to a person,” Ryan said. “It affects policy positions that make democratic functioning difficult– like our willingness to compromise, or our judgments of party leaders, and how we respond to the pandemic.”
“Political elites can politicize issues and can potentially seize on division in hopes of gaining support,” said Krupnikov. “There is often a focus on voter division, but the future of American democracy depends often on how politicians– more than ordinary voters– behave.”
This post was written by Tevah Platt, communications specialist for the Center for Political Studies.
The American National Election Studies (ANES) has been recognized by the American Association for Public Opinion Research (AAPOR) with its Policy Impact Award– given annually to outstanding projects making a clear impact, improving policy decisions, practice and discourse. The ANES was selected for “making public opinion available to policymakers, informing public discourse, and allowing evaluation of the functioning of democracy.”
With this award, AAPOR recognized the ANES as the longest-running and most widely used and cited time series of public opinion and voting behavior data in the world.
“The entire ANES team is humbled by this award,” said ANES Primary Investigator Nicholas Valentino, Professor of Political Science and Research Professor in the Center for Political Studies (CPS) at the University of Michigan Institute for Social Research. “In our democracy, public opinion is meant to guide elected representatives’ policy decisions, so informed policy discourse and assessments of democracy require information about public opinion. The ANES collects high-quality data on opinion and behavior that inform policy discourse and allow evaluation of the functioning of democracy.”
AAPOR noted that the ANES has been the leading source of data on public opinion in electoral politics for decades, noting that “nearly all leading issues of national policy in the United States since the 1950s are addressed by the study, including, especially, racial inequality, economic inequality, social capital, campaign finance, voter ID laws, and attitudes and opinions about government institutions.”
The ANES is a national infrastructure project for research about the public’s relationship with government, Valentino said. For 75 years, it has provided public access to high-quality data built around two main outcome variables: turnout and candidate choices in elections for federal office. To explain these outcomes, ANES questionnaires cover policy preferences, identity, prejudice, values, behavior, knowledge, and demographics, with an emphasis on high quality sampling and measurement. “The resulting datasets inform policy discourse and take the vital signs of democracy.”
As illustrations of the durable and far-reaching impact of the ANES, AAPOR noted the breadth, number, and diversity of organizations that have cited or relied on the data in their policy advocacy or discourse– including the high branches of government, the lower federal courts, foreign and internationally-focused organizations, policy think tanks and advocacy organizations. In an increasingly polarized media environment, AAPOR recognized that ANES is frequently cited in the news media, and by all sides. The model established by the ANES has been the inspiration for national election studies in over 30 countries around the world. The impact on research about democratic society is illustrated by over 8,000 papers, books, and other publications that have used ANES data over the past 75 years. Finally, AAPOR cited the ANES as the most cited dataset in peer-reviewed articles about public opinion and political behavior in the leading political science journals — used by thousands of scholars, journalists, students, and citizens to understand American democracy.
“ANES policy impact is broad, but two important and timely foci are campaign finance and voter ID laws, where ANES is regularly cited in legal briefs, policy advocacy, and non-partisan reports,” said Valentino.
This year marks the 75th anniversary of the ANES: Since 1948, the definitive study of American political attitudes and behavior has run national surveys of citizens before and after every presidential election, providing a rigorous, non-partisan basis for understanding contemporary issues as well as change over time.
Valentino noted that the ANES has a legacy of AAPOR recognition as scholars using ANES data have been lauded over decades. The first winner of the AAPOR Award for career achievement, Angus Cambpell, won largely for the work he did to create the ANES, Valentino said. Numerous subsequent AAPOR Award winners – including Philip Converse (1986), Howard Schuman (1994), Norman Nie (2006), Michael Traugott (2010), Stanley Presser (2011), Jon Krosnick (2014), and Lawrence Bobo (2020) – each rely heavily on ANES data in their work (and Converse and Krosnick were ANES principal investigators).
“It is a great honor for ANES to continue in this intellectual tradition, and we would all like to thank the selection committee at AAPOR,” said Valentino. “[It is also important] to mention that the ANES staff is large and makes a huge contribution to the project’s success.”
The ANES is a collaboration of the University of Michigan and Stanford University, with Duke University and the University of Texas, and is funded by the National Science Foundation.
AAPOR has offered the Policy Impact Award annually since 2004. Last year’s winners were the National Health and Aging Trends Study (NHATS) and the National Study of Caregiving (NSOC); previous honorees include the U.S. Census Bureau, the Henry J. Kaiser Family Foundation, the RAND Corporation, and the Urban Institute.
In addition to Valentino, Shanto Iyengar of Stanford University is a principal investigator of the project. The Associate PIs are D. Sunshine Hillygus of Duke University and Daron Shaw of the University of Texas at Austin. David Howell and Matthew DeBell are the Directors of Operations at Michigan and Stanford, respectively.
The Center for Political Studies has recently published a series on the 75th anniversary of the ANES: Including a Q&A about the project with Nicholas Valentino, a visual history of the project, and reflections from scholars who have been impacted by the ANES.
Two CPS students also received awards from AAPOR this year: Francy Luna Diaz and Zoe Walker, both Institute for Social Research Next Generation Scholars, won AAPOR Student-Faculty Diversity Pipeline Awards, which aim to recruit faculty-student “pairs” interested in becoming AAPOR colleagues to study public opinion and survey research methodology.


![DAVID O. SEARS UCLA Donald Kinder used the ANES to make a strong case for changes in the nature of white racism in America and for its continued political clout. [Others] used it effectively to demonstrate how racialized the 2008 and 2012 presidential elections were. Nick Valentino and I used it... to make a case for the gradual partisan realignment of the white South in the last half of the 20th century around racial issues.](https://cpsblog.isr.umich.edu/wp-content/uploads/2024/10/Screenshot-2024-10-24-at-2.39.22 PM-1024x575.png)