Dec 19, 2013 | Foreign Affairs, International, Profile
Developed by Katie Brown and Mark Tessler
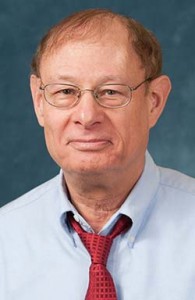
 If you ask Mark Tessler about the trajectory of his work, he smiles. His career path was never planned; rather he took advantage of unexpected opportunities along the way. Among these was the chance to spend part of his undergraduate education as a student at the Hebrew University of Jerusalem and part of his graduate education as a student at the University of Tunis.
Since completing his studies, Tessler has conducted research in Tunisia, Morocco, Israel, the West Bank, and Egypt. He has also lived and taught university in several Sub-Saharan African countries.
Not surprisingly, one of Tessler’s areas of research is the Israel-Palestine conflict. Spending time in both Israel and Palestine has enabled him to witness first-hand the legitimate aspirations of both sides and has shaped his perspective on the conflict. He has published extensively on the subject. His scholarship, which emphasizes rigor as well as political and cultural sensitivity, includes articles in World Politics, the Journal of Conflict Resolution, International Studies Quarterly, and a prize-winning 1000-page book, A History of the Israeli-Palestinian Conflict. Tessler describes his approach to the conflict as “objectivity without detachment.”
Tessler’s broader research questions focus on the individual-level of analysis and investigate the normative and behavioral orientations of ordinary citizens in the Middle East and North Africa. In particular, he studies how people sort out who they are, what kind of society they want to live in, and by what kind of political system they want to be governed. Some of the findings from this research are brought together in his 2011 book, Public Opinion in the Middle East: Survey Research and the Political Orientations of Ordinary Citizens.
Currently, Tessler is working on a new and original public opinion database. With support from the Carnegie Corporation of New York, the database pulls together data from 44 nationally-representative surveys conducted in 15 countries in the Middle East and North Africa. Tessler carried out some of these surveys with support from the National Science Foundation and other foundations and agencies. Other surveys are from the Arab Barometer, which Tessler co-directs, and from the World Values Survey.
Key variables in this unique database include respondent attitudes toward a wide range of political and social issues, particularly those pertaining to governance and to Islam. Also included are major political, economic, and demographic characteristics of the country of which the respondent is a citizen. The database thus permits both separate and integrated individual-level and country-level analyses.
Though not planned, Tessler’s choice to dive into opportunities as they appeared helped to create an illustrious career. He has authored, coauthored, or edited 15 books and published over 125 book chapters and journal articles. Mark Tessler is a Center for Political Studies (CPS) Researcher and Samuel J. Eldersveld Collegiate Professor of Political Science at the University of Michigan.
Dec 13, 2013 | Foreign Affairs, Innovative Methodology, International
Developed by Katie Brown in coordination with Robert Franzese
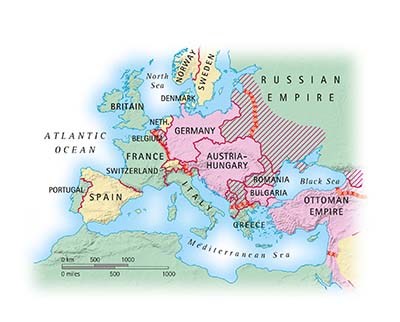
 The map to the left shows Europe during World War I, including Italy and Romania. Can a graph illustrate how Italy’s decision to enter the war influenced Romania’s decision to do so?
Social scientists seek to understand social, political, and psychological phenomena. Quantitative research methods used by scientists can help investigate what factors cause specific outcomes (effects). Often, however, a factor in one unit causes an outcome in that unit, and that outcome then becomes a factor that causes outcomes in other units. Center for Political Studies (CPS) researcher and Professor of Political Science Robert Franzese, along with his coauthor and former member of CPS Jude Hays, has been studying ways to understand the relationships not just between cause and effect in one unit, but between causes and effects across multiple units, over time. That is, how to identify and estimate what is called spatial and spatiotemporal interdependence.
Franzese, along with Hays and their colleague Lena Schaeffer, presented a paper at the annual meeting of the American Political Science Association (APSA) that outlines the shortcomings of most approaches to the connection between causes and effects across multiple units over time. Then, the paper highlights some more promising models.
To illustrate how these more promising models work, let’s consider a specific application: investigating the decision of nations to enter World War I. This decision depends not only on domestic and international structural factors, but also on the decision of other nations to enter the war.
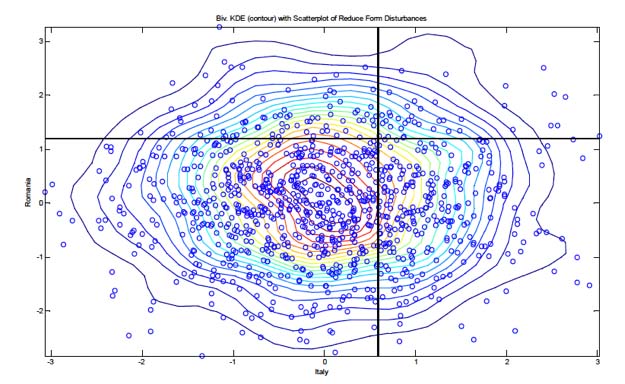
With this in mind, how did Italy’s decision to enter World War I influence Romania’s decision to do so? The below graph shows a simulation of 1,000 different possible outcomes (as dots on the graph), using Franzese’s model. From the set of simulations on the graph, we learn that when Italy joins the war (as indicated by the number of dots which appear to the right of the vertical cutoff line), Romania also joins the war 15.6% of the time (as indicated by the number of dots which appear above the horizontal cutoff line). Furthermore, when Italy does not join the war, Romania still joins the war 12.3% of the time. The difference between these two numbers – 3.3% – is thus the the impact of Italy’s decision to enter the war on Romania’s decision to enter the war.

This simulation is just one illustration of an application of spatiotemporal interdependence. Models such as these can help social scientists understand a variety of scenarios where interdependence occurs, with some of many other examples being:
- the relationship between the votes of legislators, the votes of citizens, and election results;
- the outcomes of coups, revolutions, and riots; and
- the entry of countries into treaties or alliances.
Dec 11, 2013 | Innovative Methodology, National
Developed by Katie Brown in coordination with John Garcia

Photo credit: Thinkstock
Center for Political Studies (CPS) and Inter-university Consortium for Political and Social Research (ICPSR) Researcher John Garcia studies this phenomenon. In a forthcoming paper, “Race as Lived Experience: The Impact of Multi-Dimensional Measures of Race/Ethnicity on the Self-Reported Health Status of Latinos,” Garcia – along with colleagues Gabriel R. Sanchez, Shannon Sanchez-Youngman, Edward D. Vargas, and Vickie D. Ybarra – develops a multiple dimensional model of race and tests its relation to health with American Latinos.
The authors measure race with a survey. The survey includes questions that consider three dimensions of race: ascribed race (or what people think others see as their race), skin color, and experience with discrimination. Garcia then combined these questions into a scale. Unlike other measures that consider race to be genetic or biological, Garcia’s scale approaches race as a socio-cultural construct. Race is typically captured through self-identification utilizing social identity theory. As the source is the individual, this assumes that one’s self identity is “derived” primarily or exclusively from the individual him/herself. The relational nature of racial identification can become muted or minimize the role of interactions, institutions and policies that affect race, status, and power relations. Garcia seeks to diversify this approach by creating and testing a new scale.
After creating the scale, the authors then interviewed 1,200 Latinos by phone. The survey also included questions about health.
Interestingly, the authors find a connection between the multiple dimensions of race and self-reported health. The darker the skin, the worse self-reported health. The graph below illustrates this trend.

Likewise, health appears to deteriorate with more discrimination experiences. The graph below shows this finding.

Ascribed race, on the other hand, was not related to self-reported health. But, when all three dimensions of race are combined into a single scale, then, the authors report,
“Latinos whose daily lives are more directly influenced by their race/ethnicity report poorer health than Latinos for whom race is not a central factor.”
These results are important for multiple reasons. A multi-dimensional approach to measuring race – like this one – is truer to lived experience. Furthermore, this approach offers more power to explain the societal injustices rooted in race, like relative health.
Dec 5, 2013 | CLEA, Innovative Methodology, International, National
Developed by Katie Brown and Jill Wittrock in coordination with David Backer, Allen Hicken, Kirill Kalinin, Ken Kollman, and Walter Mebane

Photo credit: Thinkstock
Voter fraud is an important problem, and it knows no geographical boundaries. In the last two months alone, allegations of voter fraud made the news. Some 1,000 citizens of Beit Shemish, Israel protested in demand of new elections amid evidence of foul play in an earlier vote. A Florida congressman’s former chief of staff was sentenced to prison for trying to rig an election. Similar stories also came out of Wisconsin, Texas, Michigan, Nebraska, Kansas, North Carolina, New York, Iowa, Egypt, Japan, and New Zealand, to name just a few from just the last few weeks.
Voter fraud is an important problem. When ballot results are viewed as corrupted by some process, elections have the potential to be destabilizing, and in extreme cases, can trigger violence and political regime change. For example, the suspicions surrounding the results of the 2007 Kenyan presidential election triggered large-scale turmoil, leading to more than 1,000 deaths. Observations from international election monitoring in 170 countries indicate 61% of countries experience some degree of cheating, including election fraud, with 27% countries in the sample exhibiting major fraud problems.
But how can we measure it? And how can we give election monitoring agencies the tools they need to pinpoint potential hotspots before an upcoming election? Researchers Walter Mebane and Kirill Kalinin at the University of Michigan have refined a set of tools that capture different aspects of potential election irregularities. Some of these methods are informed in part by techniques developed for detecting financial fraud: numbers changed by humans tend to have patterns that wouldn’t have occurred through the normal process of casting a ballot. Other methods derive from other mathematical regularities or feature simulations of what votes affected by fraud look like. Such methods have revealed fraud in recent elections in Russia, Iran, and Uganda. However, vast amounts of election returns are needed to conduct the data analysis, and many of the tests of election fraud have relied on precinct or polling station results, which can be difficult to get from governments, especially ones under suspicion of engaging in fraudulent behavior.
Enter the Constituency-Level Elections Archive (CLEA). Three of the co-directors of CLEA (Ken Kollman, Allen Hicken, and David Backer) are teaming up with Mebane and Kalinin to provide high quality and detailed constituency-level election results. Together the researchers are testing whether tools developed for detecting fraud using precinct results will also work at a higher level of aggregation, namely the district-level. CLEA provides cleaned and uniformly formatted results for elections around the world. Preliminary results from recent elections in Russia, Uganda, and Mexico suggest that different fraud detection techniques accurately estimate the probability of suspicious behavior at the district-level. For instance, in Russia, serious irregularities were widely alleged by both election monitors and Russian voters. Mebane and Kalinin found significant and substantial evidence of fraud using a range of fraud detection techniques, thus corroborating the firsthand account of monitoring organizations and Russian voters.
Next steps include applying these techniques to the remaining 1200+ elections in the archive with the end goal of providing baseline estimates of likely cases of fraud. Armed with this information, election monitoring organizations will have a sophisticated tool to complement their efforts at promoting free and fair elections. Over the short run, such results can assist monitors in focusing attention on problematic areas in specific countries, but in the long run, these detection techniques have the potential to deter those who wish to engage in election manipulation.
 If you ask Mark Tessler about the trajectory of his work, he smiles. His career path was never planned; rather he took advantage of unexpected opportunities along the way. Among these was the chance to spend part of his undergraduate education as a student at the Hebrew University of Jerusalem and part of his graduate education as a student at the University of Tunis.


