Sep 1, 2016 | APSA, Conflict, Current Events, Foreign Affairs, International
Post developed by Catherine Allen-West in coordination with Michael Robbins.
ICYMI (In Case You Missed It), the following work was presented at the 2016 Annual Meeting of the American Political Science Association (APSA). The presentation, titled “Passive Support for the Islamic State: Evidence from a Survey Experiment” was a part of the session “Survey and Laboratory Experiments in the Middle East and North Africa” on Thursday, September 1, 2016.
On Thursday morning at APSA 2016, Michael Robbins, Amaney Jamal and Mark Tessler presented work which explores levels of support for the Islamic State among Arabs, using new data from the Arab Barometer. The slide set used in their presentation can be viewed here: slides from Robbins/Jamal/Tessler presentation
Their results show that among the five Arab countries studied (Jordan, Morocco, Tunisia, Palestine and Algeria) there is very little support for the tactics used by Islamic State.
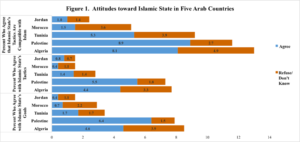
Furthermore, even among Islamic State’s key demographic – younger, less-educated males – support remains low.
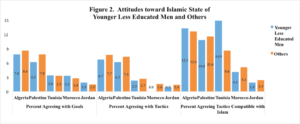
For a more elaborate discussion of this work and the above figures, please see their recent post in the Washington Post’s Monkey Cage blog, “What do ordinary citizens in the Arab world really think about the Islamic State?”
Mark Tessler is the Samuel J. Eldersveld Collegiate Professor of Political Science at the University of Michigan. Michael Robbins is the director of the Arab Barometer. Amaney A. Jamal is the Edwards S. Sanford Professor of Politics at Princeton University and director of the Mamdouha S. Bobst Center for Peace and Justice.
Apr 4, 2016 | Conflict, International
Post developed by Yioryos Nardis in coordination with Christian Davenport.
Department of Political Science Professor and Center for Political Studies faculty member Christian Davenport’s latest work examines transitional justice – judicial and non-judicial actions implemented by governments to deal with legacies of human rights abuses. These actions can typically include criminal prosecutions, truth commissions, reparations, and various kinds of institutional reforms.
In Transitional Injustice: Subverting Justice in Transition and Postconflict Societies, published in the Journal of Human Rights, Davenport and Cyanne Loyle, Assistant Professor of Political Science at Indiana University, coin the term transitional injustice to describe governments that implement transitional justice without maintaining interest in truth, peace, or democracy. Instead, their intention is to promote denial and forgetting, violence, and legitimize authoritarianism.
The normative perspective of transitional justice assumes that legal processes following political conflict are implemented with the goal of reconciliation, peace, and democratization. It is assumed that “good” processes will lead to “good” outcomes. However, this assumption makes it possible for governments to hide behind transitional justice using similar legal institutions to advance detrimental aims. Davenport and Loyle argue that governments can use trials, truth commissions and amnesty without maintaining an interest in these goals, but rather to promote transitional injustice, i.e. denial, violence, and legitimizing state repression. Transitional injustice is particularly problematic for those interested in promoting justice processes because it reveals how institutions can be subverted for different purposes, often with international consent.
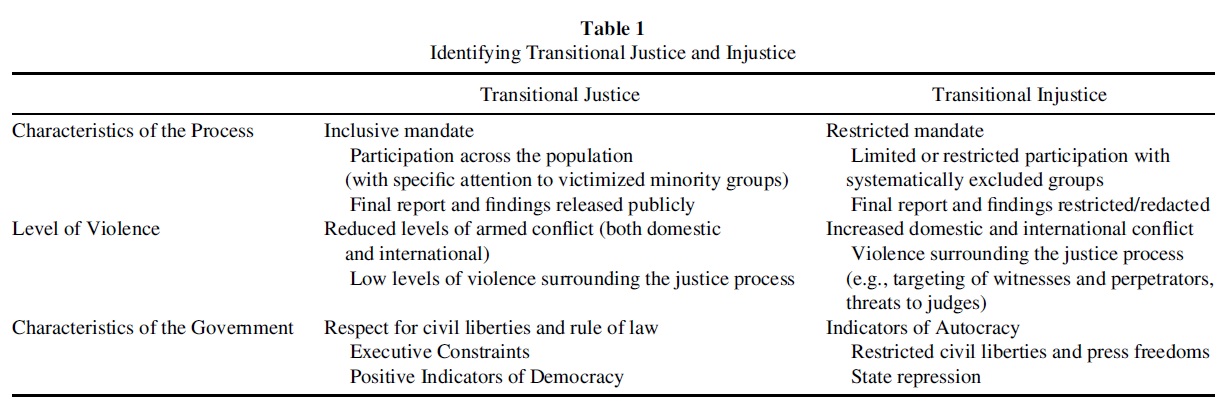
The article not only provides conceptual clarity on identifying differences but also provides indicators by which policy makers and scholars can determine if transitional injustice is taking place. In particular, policy makers can identify transitional injustice by relying on three key dimensions: (1) characteristics of the process, (2) levels of violence in the postconflict society, and (3) characteristics of the government (Table 1). These components allow government intentions and the potential for subversion of justice to be evaluated.
First, the degree of openness of the process is an indicator of the objectives of the government and the possibility for positive outcomes from the process. One could gauge the promotion or subversion of truth-telling by the degree to which distinct actors are integrated into the justice process, given an opportunity to participate, to draft, review and edit relevant decisions, as well as veto aspects of the process. Transitional justice should have a broad mandate incorporating all types of violations experienced during the conflict. Transitional injustice, however, reveals itself as a more closed process with a limited mandate and exclusion of certain individuals and groups.
The second indicator is the level of violence surrounding the process and the country. While violent events often linger in postconflict societies, the presence of transitional justice should lead to reduced levels of violence in the society overall. Transitional injustice however, is accompanied by violence internationally, domestically, and surrounding the process itself.
Third, characteristics of the government can be assessed by the level of democracy and the country’s present trajectory. Breaking from a past autocratic regime does not ensure that the new regime will be more democratic. Rather, the intentions of the regime should be assessed through institutional and behavioral indicators of democracy. The degree to which a justice process legitimates a democracy through open and frequent elections, diverse and representative political parties, and autonomous institutions is a valuable metric for understanding the general intent of those involved. Transitional justice should be accompanied by growing levels of democracy, while transitional injustice will accompany autocracy.
To more specifically illustrate how to identify transitional injustice, the article examines post-genocide Rwanda. On the surface, it appears that Rwanda’s approach to justice supports the normative aims of transitional justice. The Rwandan approach combines international, national, and local justice processes with the stated goals of truth and reconciliation, peace, and democracy. However, critics have called into question the ability of this justice package to accomplish those goals. Instead, it is being revealed that elements of the International Criminal Tribunal for Rwanda, national courts, and local justice processes have been used by the Rwandan government to promote denial, renewed violence, and the legitimization of an autocratic regime.
Regarding the openness of the process, the first dimension of transitional injustice, the space for justice in post-genocide Rwanda has been constricted through the support of targeted remembering, state-sanctioned scripted truths, and restricted access to justice. Instead of addressing all forms of conflict in Rwanda, the current justice package concentrates only on violence committed during the genocide. This strategy aims to direct attention to the successes of the government, namely ending the genocide, and away from its failures, mainly human rights violations and civilian massacres during the civil war and following the 1994 political transition.
Turning to the level of violence surrounding the process, far from reducing violence, the Rwandan approach to justice allows the government to increase domestic violence and international conflict. Violence has been a persistent component of the post-1994 Rwandan state, as in the aftermath of the genocide, a number of people were accused, tried and executed in a short period of time. By 2000, 348 people convicted of genocide crimes through the national courts were sentenced to death (Schabas, 2009), while the procedural fairness of many of those trials is questioned (Amnesty International, 2007). There has also been violence surrounding the justice processes themselves. In 2007 alone, the US State Department recorded 324 incidents of violence related to local justice processes, including killings of genocide survivors (US Department of State, Bureau of Democracy, Human Rights and Labor, 2008). While the government has officially denounced the violence, it has been reluctant or unable to stop it.
The final dimension of transitional injustice, characteristics of the government, provides an example of the Rwandan justice system working to consolidate an authoritarian regime and restrict political participation. The Rwandan government is a far cry from a functioning democracy. While elections have been held, their validity has been questioned and the lack of a viable opposition party has essentially made the country a single-party state (Reyntjens, 2004; Davenport, 2007). Freedom House (2007) has characterized elections as “marred by bias and intimidation which precluded any genuine challenge to the Rwandan Patriotic Front (RPF)”.
Attempts to launch rival political parties have been met with intimidation and, in some instances, violence. The restriction of viable political alternatives to President Kagame’s RPF has limited the electoral power of individual citizens. In the 2010 presidential election, three opposition candidates were excluded from the ballot and Paul Kagame was reelected by 93% of the vote.
In conclusion, Rwanda claims to support domestic and international efforts to collect information about what happened, to communicate the findings, and capture and punish those who were involved in previous violent action. Through these efforts, the government has argued that it will advance truth and reconciliation, prevent violence and facilitate democratization. Unfortunately, by concealing political motivations in the obstruction of justice proceedings and engaging in violent activity, the Rwandan government is doing irreparable damage to the development of truth, reconciliation, rule-of-law, and democracy. In order to acknowledge and challenge this subversion, the international community must recognize the ability of justice institutions to be used for less democratic aims. This research therefore aims to provide skepticism regarding the goals associated with transitional justice as well as indicators to evaluate the potential subversion of relevant processes.
References:
Amnesty International. (2007). Truth, justice and reparation: Establishing an effective truth commission. AI Index: POL 30/009/2007. Available: http://www.refworld.org/docid/4678de4a2.html.
Davenport, Christian. (2007). State Repression and the Domestic Democratic Peace. Cambridge, UK: Cambridge University Press.
Freedom House. (2007). Countries at a Crossroad: Rwanda. Available: https://freedomhouse.org/report/countries-crossroads/2007/rwanda.
Reyntjens, Filip. (2004). Rwanda, ten years on: From genocide to dictatorship. African Affairs,103, 177-210.
Schabas, William A. (2009). Post-genocide justice in Rwanda. In After Genocide: Transitional Justice, Post-Conflict Reconstruction and Reconciliation in Rwanda and Beyond, Phil Clark and Zachary D. Kaufman (eds.). New York: Columbia University Press.
Nov 3, 2015 | Conflict, Current Events, International, Uncategorized
Post developed by Yioryos Nardis in coordination with Yuri Zhukov.
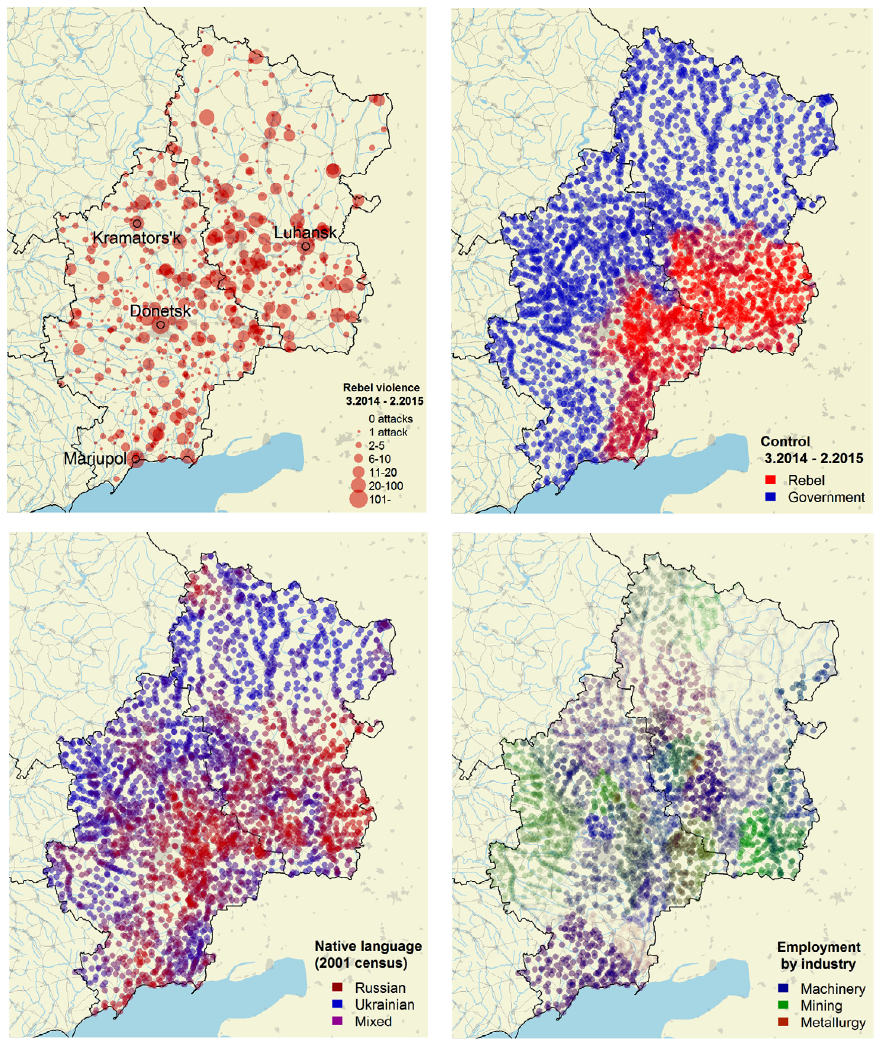
In March and April 2014, angry mobs and armed men stormed administrative buildings and police stations in eastern Ukraine. Waving Russian flags and condemning the post-revolutionary government in Kyiv as an illegal junta, the rebels proclaimed the establishment of ‘Peoples’ Republics’ of Donetsk and Luhansk, and organized a referendum on independence. Despite initial fears that the uprising might spread to other provinces, the rebellion remained surprisingly contained. While 61% of municipalities in Donetsk and Luhansk fell under rebel control during the first year of the conflict, just 20% experienced any rebel violence. What explains these local differences in rebellion across eastern Ukraine? Why have some towns remained under government control while others slipped away? Why might two municipalities in the same region experience different levels of separatist activity?

Yuri Zhukov
The latest research by Yuri Zhukov, faculty member in the Center for Political Studies and Assistant Professor of Political Science, uses new micro-level data on violence and economic activity in eastern Ukraine to examine these questions. In the paper “Trading hard hats for combat helmets: The economics of rebellion in eastern Ukraine” (forthcoming in the Journal of Comparative Economics) Zhukov evaluates two prominent explanations on the causes and dynamics of civil conflict in eastern Ukraine: ethnicity and economics.
Identity-based explanations expect conflict to be more likely and more intense in areas where ethnic groups are geographically concentrated. According to this view, the geographic concentration of an ethnolinguistic minority – in this case, Russians or Russian speaking Ukrainians – helps local rebels overcome collective action problems, while attracting an influx of fighters, weapons and economic aid from co-ethnics in neighboring states.
According to economic explanations, as real income from less risky legal activities declines relative to income from rebellious behavior, participation in the rebellion is expected to rise. This framework maintains that violence should be most pervasive in areas potentially harmed by trade openness with the EU, austerity and trade barriers with Russia.
Zhukov finds that local economic factors are much stronger predictors of rebel violence and territorial control than Russian ethnicity or language. Pro-Russian rebels in Ukraine are “pro-Russian” not because they speak Russian, but because their economic livelihood depends on trade with Russia.
The study uses new micro-level data on violence, ethnicity and economic activity in the Donbas region of eastern Ukraine, to understand how these two explanations are related to rebel violence and territorial control. The spatial units are 3037 municipalities (i.e. cities, towns, villages) in Donetsk and Luhansk provinces. For each municipality, Zhukov estimated the proportion of the local labor force employed in three industries: machine-building (which is heavily dependent on exports to Russia), metals (less dependent on Russia, and a potential beneficiary of increased trade with the European Union), and mining (vulnerable to International Monetary Fund-imposed austerity and cuts in state-subsidies). He also calculated the proportion of Russian speakers in each locality.
Rebel violence data are based on human-assisted machine coding of incident reports from multiple sources, including Ukrainian and Russian news agencies, government and rebel press releases, daily ‘conflict maps’ released by both sides, and social media news feeds. This yielded 10,567 unique violent events in the Donbas, at the municipality level, recorded between the departure of President Viktor Yanukovych in February 2014 and the second Minsk ceasefire agreement of February 2015. To determine territorial control, particularly whether a populated place was under rebel or government control on a given day, Zhukov used three sources: official daily situation maps publicly released by Ukraine’s National Security and Defense Council (RNBO), daily maps assembled by the pro-rebel bloggers ‘dragon_first_1’ and ‘kot_ivanov’, and Facebook posts on rebel checkpoint location.
 To evaluate the relative explanatory power of ethnic and economic explanations of violence in the Donbas, the study uses Bayesian Model Averaging. It finds that a municipality’s prewar employment mix is a better predictor of rebel activity than local ethnolinguistic composition. Municipalities more exposed to trade shocks with Russia experienced a higher intensity of rebel violence throughout the conflict. Municipalities where machine-building represented a small share of local employment (2%, the lowest in the data) were 38% less likely to experience violence than municipalities where the industry was more dominant — and the local population more vulnerable to trade disruptions with Russia. Such localities also fell under rebel control earlier – and took longer for the government to liberate – than municipalities where the labor force was less dependent on exports to Russia. On any given day, a municipality with higher-than-average employment in the beleaguered machine-building industry (26%) was about twice as likely to fall under rebel control as a municipality with below-average employment in the industry (4%).
By contrast, ethnicity and language had no discernible impact on rebel violence. Municipalities with large Russian-speaking populations were more likely to fall under rebel control, but only where economic dependence on Russia was relatively low. In other words, ethnicity only had an effect where economic incentives for rebellion were weak.
The seemingly rational economic self-interest at the heart of the conflict stands in sharp contrast with the staggering costs of war. In the twelve months since armed men began storming government buildings in the Donbas, over 6000 people have lost their lives, and over a million have been displaced. Regional industrial production fell by 49.9% in 2014, with machinery exports to Russia down by 82%.Suffering heavy damage from shelling, many factories have closed. With airports destroyed, railroad links severed and roads heavily mined, a previously export-oriented economy has found itself isolated from the outside world.
References:
2001 Ukrainian Census (State Committee on Statistics of Ukraine, 2001).
Bureau van Dijk’s Orbis database (Bureau van Dijk Electronic Publishing, 2015).
Segodnya, 2015. Ekonomika donetskoy oblasti v upadke iz-za voyny – gubernator kikhtenko. [Donetsk region’s economy in stagnation because of the war – Governor Kikhtenko]. Segodnya.
Stasenko, M., 2014. Novaya ekonomika ukrainy budet stroit’sya bez rossii i donbassa [Ukraine’s new economy will be built without Russia or the Donbas]. Delo.ua.
Oct 29, 2015 | International, Law, Profile
Post developed by Yioryos Nardis in coordination with Barbara Koremenos.
 Barbara Koremenos, Center for Political Studies faculty member and Professor of Political Science at the University of Michigan has recently begun a Visiting Research Fellowship at the Kroc Institute for International Peace Studies at the University of Notre Dame. The Kroc Institute is devoted to the study of the causes of violent conflict and strategies for sustainable peace. She was awarded the Fellowship to spend the 2015-2016 year studying the relationship between Islamic states and international law, and to examine how this affects Islamic states’ participation in international agreements and ultimately the peaceful resolution of differences.
Koremenos was inspired by looking at a random sample of international agreements in the issue areas of economics, environment, human rights, and security drawn from the United Nations Treaty Series (UNTS), which is by far the most popular place to register international agreements. She was struck by the fact that not a single agreement in her sample was composed solely of Islamic states. Within the sample, Egypt participated in the most agreements (25 agreements) while Oman had the lowest participation rate (seven agreements). With the exception of Malaysia, every other state in the sample participated in at least as many (usually more) human rights agreements than agreements in any of the other three issue areas. Within the sample, Lebanon participated more than any other Islamic state in environmental agreements at a quite low number of five.
Even more striking, participation in multilateral agreements seemed to far outweigh participation in bilateral agreements, even though bilateral cooperation is more prevalent worldwide when looking at the entire UNTS population. This is also true when looking at the sample featured in Professor Koremenos’ Continent of International Law (COIL) research program.
In the UNTS sample, over half of the Islamic states participated in no bilateral agreements; Egypt was the state that participated in the most bilateral agreements (six agreements) followed by Oman and Indonesia at two bilateral agreements each.
Koremenos will use her fellowship this year to examine whether:
- Islamic states simply participate in fewer international agreements than non-Islamic states
- With respect to participation in international agreements, there is variation within Islamic states that can be explained by whether Shari’a is officially adopted in a state’s constitution
- Islamic states participate in international agreements that are not registered with the UNTS;
- Islamic states participate in relatively more informal international agreements
Answers to these questions will give a sense of the amount of “failed cooperation” in those states – that is, cooperation that is precluded because certain institutional design tools, that might be key to solving the cooperation problems facing states, are disallowed by Shari’a Law – and, to begin to suggest larger relationships that might impact key factors in the world of peace and conflict like economic growth.
Sep 5, 2015 | Elections, Innovative Methodology, International
Post developed by Yioryos Nardis in coordination with Walter Mebane.
ICYMI (In Case You Missed It), the following work was presented at the 2015 Annual Meeting of the American Political Science Association (APSA). The presentation, titled “Election Frauds, Postelection Legal Challenges and Geography in Mexico,” was a part of the session “Detecting and Concealing Patterns in Data” on Saturday September 5th, 2015.
Political Science and Statistics Professor and Center for Political Studies faculty member Walter Mebane previously examined electoral fraud in Russia. Professor Mebane, in collaboration with Research Assistant Jonathan Wall, now turns his focus to Mexico and the Presidential elections of 2006 and 2012.
This new research by Mebane and Wall investigates if the numbers of casillas (i.e. ballot boxes) and votes challenged and nullified in Mexico reflect political strategies or genuine election irregularities. In the 2006 elections in Mexico, nullification petitions by runners up were filed against 21% of ballot boxes (27,109/130,788), even though only .56% of votes (237,736/41,791,322) were actually nullified. Similarly, in the 2012 elections, 22% of ballot boxes (32,151/143,132) were challenged and .38% of votes nullified (184,725/49,087,466).
Mebane and Wall examine how the types of nullification claims relate to ballot-box level measures of election fraud and whether the reasons cited for the challenges are uniform across the two elections and/or geography. That is, are complaints geographically clustered or does a complaint depend on geographically clustered frauds?
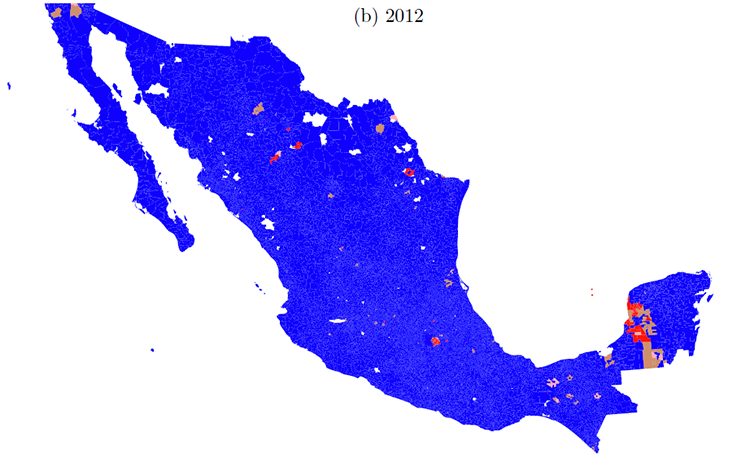
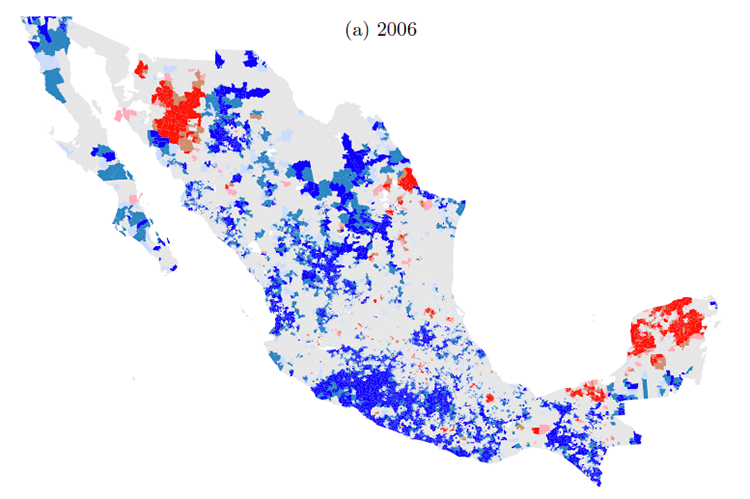
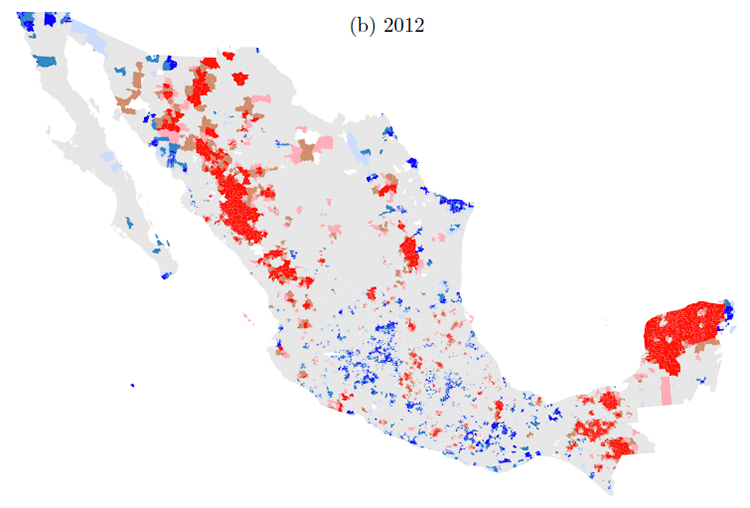
Ballot-box level measures of election fraud are estimated using casilla vote count data. Hotspot analysis is used to show how nullification petition challenges to casillas are distributed across geography. This technique identifies which locations have local means that are higher than the overall average values and which have local means that are lower than the overall average. A redder color indicates a cluster of locations with higher than average values, and a bluer color indicates a cluster of locations with lower than average values. Grey indicates a cluster of locations that does not differ significantly from the overall mean.
Figure 1 represents nullification complaints of type corresponding to willful misconduct or error in the vote count in the two Presidential elections, and Figure 2 represents incremental fraud probabilities for nullification complaints. Comparing Figure 2 to Figure 1 indicates that the pattern of geographic clustering for the incremental fraud probabilities does not correspond well with the pattern for nullification complaints.
Figure 1: Nullification complaints of type corresponding to willful misconduct or error in the vote count, Mexico, 2006 and 2012 Presidential election Casillas.
Seccion (precint) geographic cluster hotspots
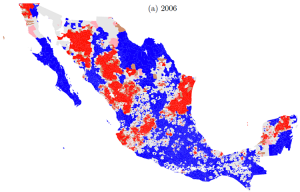

Figure 2: Incremental fraud, Mexico, 2006 and 2012 Presidential election casillas.
Seccion (precint) geographic cluster hotspots

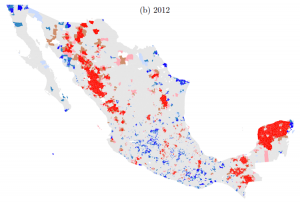
In 2006 there are more widespread regions with clusters of casillas having above average frequencies of complaints than there are regions in which there are clusters of casillas with above average incremental fraud probability values. Some of the above average type clusters overlap with above average incremental fraud clusters, but more than half do not. In 2012 on the other hand, we observe the opposite. Clusters of casillas with above average incremental fraud probabilities are much more prevalent than are clusters of casillas with above average frequencies of complaints.
Such patterns indicate that it is unlikely that the relationship between incremental fraud probabilities and the incidence of complaints are positively related. This therefore suggests that the occurrence of nullification petitions is related to the strategic and tactical incentives of political parties.
To read the full paper please visit: https://drive.google.com/open?id=0By8J0EDg6IC3MDgxOWlUVGdfakE
Sep 3, 2015 | International
Post developed by Linda Kimmel in coordination with Elisabeth Gerber.
ICYMI (In Case You Missed It), the following work was presented at the 2015 Annual Meeting of the American Political Science Association (APSA). The presentation, titled “Mobilizing or Demobilizing Political Participation,” was a part of session “The Public Policy Process in Comparative Perspective” on Thursday September 3rd, 2015.
 Sustainable development (SD) policies seek to shape economic and environmental behavior by providing households with benefits, rewards and incentives. But does engagement in SD interventions change individuals’ propensities to engage in political activities? This is the question Center for Political Studies faculty members Arun Agrawal and Elisabeth Gerber, and their colleague Ashwini Chhatre of the Indian School of Business, seek to answer.
Agrawal, Chhatre, and Gerber note that in new and emerging democracies the challenges of political participation are daunting due to such factors as a lack of education and weak democratic traditions. Can the skills, resources, and experiences gained through participating in SD interventions transfer to the political sphere by lowering barriers? Or, does participation in an SD intervention create additional barriers?
The authors test two hypotheses, one based on social choice theory and the other on resource theory on data collected in a SD intervention in Himachal Pradesh state in northern India, the Mid-Himalayan Watershed Development Project. The project sought to improve the livelihoods of poor households, conserve natural resources, and increase local governance capacity. Participating panchayats (a local government unit) received benefits to enhance residents’ incomes and reduce their dependency on forest resources. In exchange, participants were required to attend information meetings and participate in environmental education training.
Argrawal, Chhatre and Gerber selected five participating panchayats (treatment group) and five matched non-participating panchayats (control group). One member of each household was selected to complete a pre- and post-treatment survey. Key questions included measures of engagement with the SD project and two measures of political participation: (1) days campaigning in local panchayat elections and (2) number of times attending gram sabha meetings (essentially town hall meetings).
Average estimated treatment effect (ATE) is measured as the difference between paired treatment and control respondents in their change in behavior (number of meetings attended and days campaigning) between 2006 (pre-treatment) and 2011 (post-treatment). When respondents in treatment panchayats are compared to those from control panchayats (Table 1, first row), there is a negative ATE both for days campaigning and attending gram sabha meetings, indicating respondents in treatment panchayats became less likely to spend days campaigning and attending meetings than those in control panchayats. Thus, the project seems to demobilize political behavior.
When the analysis is limited to comparing those who actually participated in the project to their counterparts in control panchayats (Table 1, second row), the results differ, with those who participated in the project becoming more likely to attend more gram sabha meetings.
Table 1: Effect of Project on Campaigning and Attending Meetings, Average Treatment Effects with Alternative Treatments. N=1432
| |
Days Campaigning |
Attending Gram Sabha |
| Treatment |
ATE |
ATE |
| Project Village |
-1.57*** |
-0.16* |
| Participation |
-1.51*** |
0.45*** |
*p<.10, **p<.05, ***p<.01, two-tailed test
When the authors reran the data limiting comparison respondents to those who lived in treatment villages but did not participate (Table 2), they found that those who participated in at least one project activity (Table 2, first row) and in each of three types of activities (Table 2, second through fourth row) became more likely to attend gram sabha meetings and to spend more days campaigning than their neighbors who did not.
Table 2: Effect of Project on Campaigning and Attending Meetings, Average Treatment Effects Comparing Respondents within Treatment Villages with Alternative Treatments. N=799
| |
Days Campaigning |
Attending Gram Sabha |
| Treatment |
ATE |
ATE |
| Participation |
0.99** |
1.22*** |
| Attended environmental education Meetings |
0.94** |
1.55*** |
| Received material benefits |
1.16** |
0.72** |
| Participated in construction of small-scale public good |
0.86 |
1.49*** |
*p<.10, **p<.05, ***p<.01, two-tailed test
But why do those who directly participated in the project report greater levels of political participation post-treatment? Argrawal, Chhatre and Gerber suggest one possibility – consistent with resource theory – is that they gained additional resources through their project experience and now find political participation less costly. They plan to explore alternative explanations, including reverse causality, in future analyses.