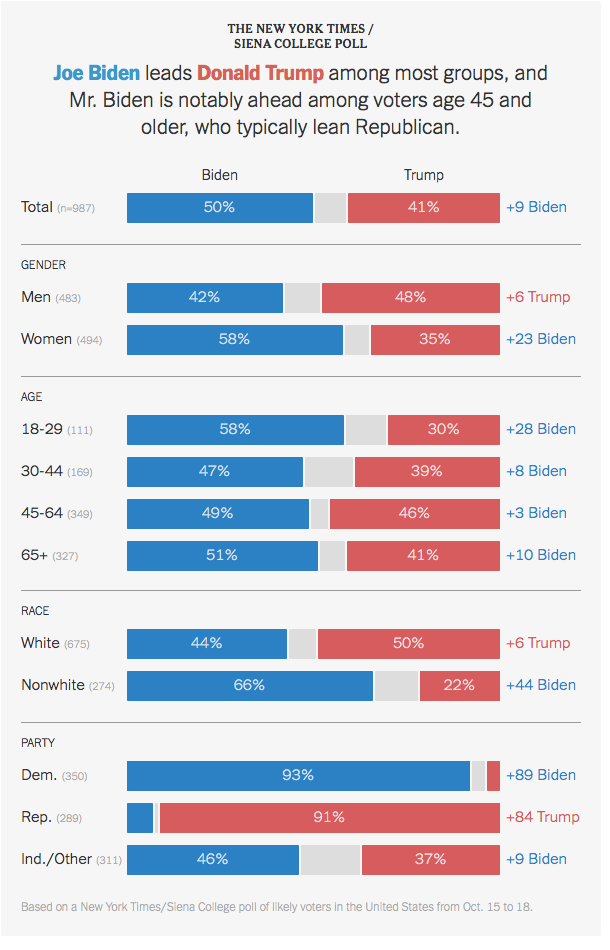
Vincent Hutchings outlined thedemographic shifts that are affecting levels of support for each party leading up to the 2020 election. As the makeup of the voting population changes in terms of gender, age, and race, the base of each major political party also changes. Hutchings presented results from a recent New York Times poll, which shows the state of the campaign as of October 2020. A recurring theme in the poll results is that Biden is performing better in the polls than recent Democratic candidates, while Trump is performing worse in the polls than previous Republican candidates.
Women have been a strong democratic constituency since 1980. Unsurprisingly, Biden is polling well among women in the current election cycle, performing even better than Clinton and Obama did in 2016 and 2012, respectively. Trump is underperforming in polls among women. Whereas recent Republican candidates have received around 40% support from women, Trump is polling around 35% support.
What is surprising is that Trump is underperforming among men, compared to recent Republican candidates. Typically, more than half of male voters support the Republican candidate; Trump is currently polling around 48% among men.
Younger voters are increasingly supporting Democrats. This is in part because younger voters are more racially diverse than older voters. Republicans typically capture around 35% of the youth vote, but in this cycle Trump is receiving even lower levels of support. Among older voters, the news for Republicans is even worse. Older voters tend to turn out to vote in higher numbers than younger voters. They are also more likely to be white, a constituency that leans Republican. In the most recent polls, Trump is polling at only 41%, which is significantly lower than expected for a Republican nominee; Biden is over-performing compared to recent Democratic candidates.
In the United States, whites have leaned Republican since 1968 – even higher during the Regan years. Trump is only polling around 50% support among white voters. The base of the Republican party has been non-Hispanic white voters for several decades. That share of the population has been declining, with important implications for support for both Democrats and Republicans.
The Importance of the Latino Vote
Angela Ocampo added to the conversation about the changing and diversifying electorate, with special emphasis on the growing Latino population. The non-white elegible voter population have accounted for 76% of growth in the electorate since 2000, said Ocampo. Latinos account for most of this growth, contributing 39% of the growth in the eligible voting population. The majority of this growth comes from US-born citizens who are turning 18 and becoming eligible to vote. In the 2020 presidential election, Latinos are projected to be the largest minority group among eligible voters for the first time.
Ocampo demonstrated that the differences in the growth of the Latino population at the state level is important. The proportion of Latinos in the voting population has increased sharply in key states, like California, Nevada, Arizona, and Texas. The emergence of these states as battlegrounds is largely attributable to an increase in Latino voters.
How consequential is the Latino vote? There has been a consistent trend toward increasing voter turnout among Latinos. Although immigration is often thought of as the most important issue for Latinos, polling shows that this group rates the COVID-19 pandemic, health care, and jobs as the most important issues in the upcoming election.
Ocampo notes that a record 32 million Latino voters will be eligible to vote in the 2020 election. Latino voters will continue to be influential in future elections. The Latino vote has grown, and the real question is how successfully candidates will be able to mobilize these voters.
The view from the states
Even if you only care about the outcome of the presidential election, said Jenna Bednar, you should still care about what’s going on in the states and in down-ballot races. Why? The electoral process is a product of the states. States structure elections by managing voter registration, identification requirements, and polling hours. States determine the qualifications of candidates and draw legislative districts. The electoral experience itself is determined by decisions about ballot design and whether states hold caucuses or primaries.
States shape the way we vote, and therefore the outcomes we get. Bednar reviewed the case of the butterfly ballot design in Palm Beach County, Florida, which led to voter confusion in the 2000 presidential election. Instructions for voters were confusing, and it was easy for voters to make mistakes. Following the irregular voting outcomes that stemmed from that ballot design, some people called for a standardized ballot. Bednar argued that slight differences in aspects like ballot design make for good experiments and innovation. She noted that ballots that are different in each state are not as easy to hack. Overall, these differences will rarely lead to problems.
Redistricting is a powerful way that states shape government at all levels. Bednar observed that Republicans have been more effective at drawing legislative districts to their benefit than Democrats. Democrats have been late to recognize the value of the states. Can we blame state governments for gerrymandering? Bednar said that while gerrymandering is not necessarily a good thing, you can’t blame a partisan process for having a partisan outcome. Many states, including Michigan, have adopted new laws to allow same-day voter registration, no-excuse absentee voting, and reforms to make the redistricting process less partisan. With all of this to consider, Bednar concludes that all voters should care about what’s happening at the state level, because the state laws and policies shape outcomes.
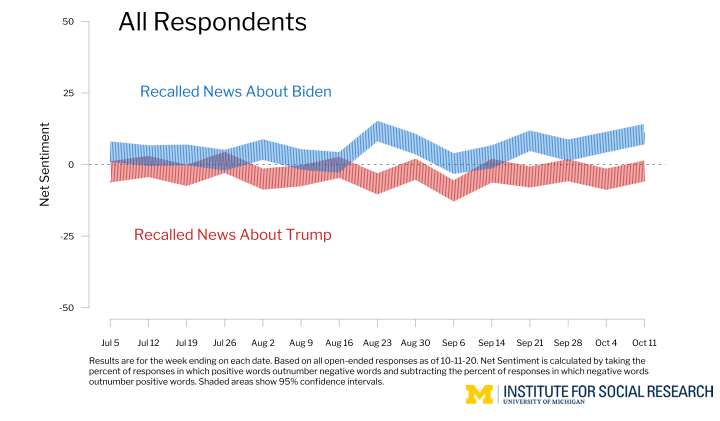
Stuart Soroka began his presentation by showing additional data from The Breakthrough, which assigns a sentiment to each response about the candidates, in order to track trends in the sentiment over time. This is not the sentiment of news content itself, but rather it’s the sentiment of the content that respondents remember. Soroka noted that the data show stability over time with a slightly positive average for Biden and a slightly negative average for Trump.
Sentiment of Recalled News about the Candidates
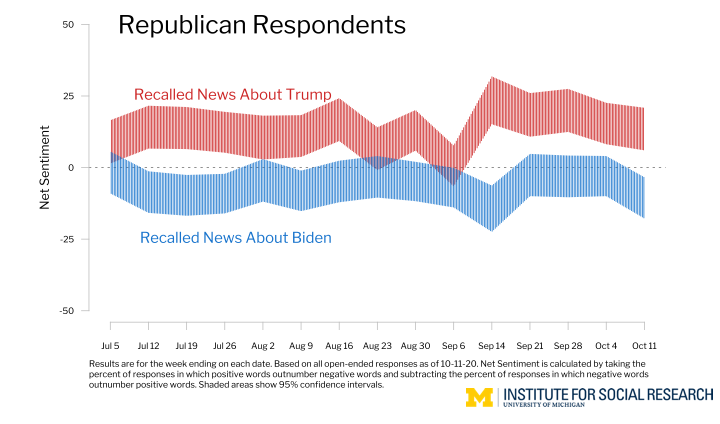
Amongst Republicans, Trump gets more positive recollections than Biden. Over the past month or so recollections of Trump have been a little more positive, albeit with a slight and statistically significant decline over the last month. Soroka said “That’s an interesting result because it runs contrary to what media observers might suggest. And contrary to what the Trump campaign’s own claims about negative coverage of Trump and mainstream media.”
Sentiment of Recalled News about the Candidates
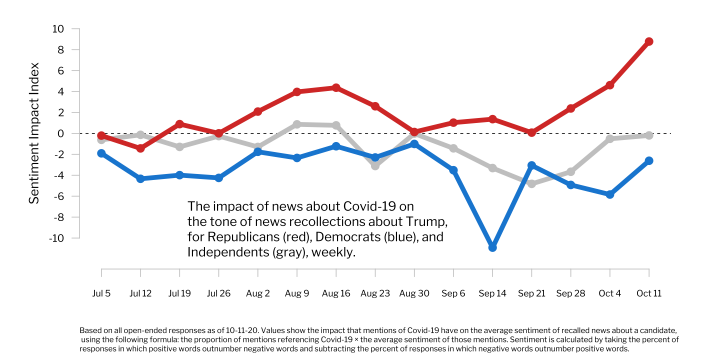
The Impact of COVID-19 on the Sentiment of Recalled News about Trump
Next, Soroka focused on the impact of COVID-realted content on recollections of news related to Trump for Republicans, Democrats, and independents. The data show that as COVID-related content is associated with negative sentiment among Democrats, it’s associated with increasingly positive sentiment among Republicans. That trend is not just the product of Trump’s quicker recovery in the week of October 11th. It’s evident in weeks prior to that as well. “In short,” Soroka said, “partisans see the same information in fundamentally different ways.”
The Impact of COVID-19 on the Sentiment of Recalled News about Trump
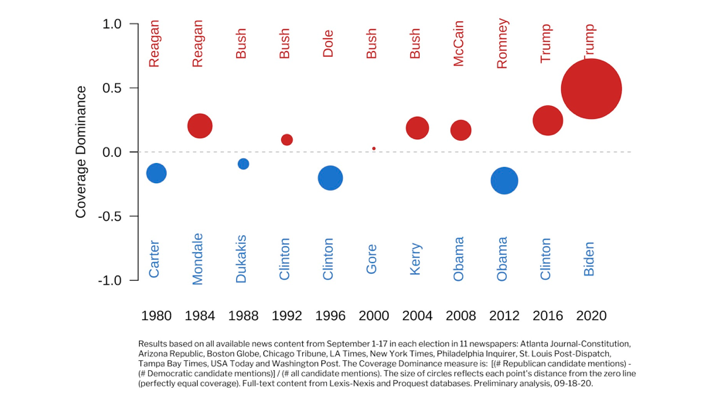
Switching to analyses of news content, Soroka showed data on the ratio of Republican candidate mentions to Democratic candidate mentions in the first week of September across 11 major newspapers for every election back to 1980. Incumbents get more coverage than challengers, and this has been equally true for both parties. We see this for Reagan, we see it for Clinton, we see it for Obama. That imbalance tends to be roughly a 20-percentage point gap. If there are ten candidate mentions, six of those are for incumbent, and four for the challenger. There are two outliers, first in 2016 Trump got incumbent style coverage in terms of imbalance although he was not the incumbent. After the election there was lots of discussion in the Academy, but publicly amongst journalists and the media as well, especially expressing concern that the media had focused too much attention on Trump.
Balance of Coverage, 1980-2020
Now that Trump is incumbent, Soroka said that Trump is getting outsized proportions of coverage. This year, for every ten-candidate mentions, seven to eight of them are about Trump, and two to three of them are about Biden. Are there differences across newspapers? Soroka said these differences are relatively slight, and have barely changed over time. He also noted that public opinion data show that partisans see information in different ways; researchers cannot reasonably assume that coverage of Trump is viewed as negative or positive on average.
Overwhelming coverage of Trump makes it very difficult for citizens to learn about Biden. In other words, Soroka pointed out, “the nature of media coverage that I have just reviewed makes it possible for voters to decide on whether or not to vote for Trump, but it gives very little information that helps voters decide whether or not to vote for Biden.” The imbalance of coverage is evident across media outlets throughout this campaign, and at a rate that is roughly twice as large as we’ve seen for the last 40 years.
Soroka concluded by highlighting the areas in which the media can play a critical role in fostering the well-informed citizenry. He directed the audience to https://mediafordemocracy.org to find a set of recommendations on how to improve coverage of this election, as well as various possible outcomes of this election. Soroka is one of the signatories of an open-letter, signed co-authored and signed by more than 60 professors, at more than 40 universities.They hope this will be a useful resource for people interested in the role that media can play in American democracy both leading up to and following the election.
Josh Pasek said there are several ways that a scholar would look at the 2020 presidential election. One is looking at the structural features that set up the landscape in which the current election is taking place. Another is to look at the messaging that people are getting in the context of this campaign. Yet another is to think more broadly about the American political system and what that might imply. Pasek examined each of these perspectives in turn.
Structural explanations
Pasek noted that there has never before been a U.S. president with a negative net favorability rating for his entire term, but this is true of Trump. A majority of individuals who have ever been asked whether they approve or disapprove of the president’s job have said that they do not approve. This is very unusual, said Pasek. Usually approval is strongly correlated with reelection chances, and an approval rate of 44 percent would not be associated with reelection. But it’s also an unusual way to target one-self as a sitting president, who typically tries to represent all the American people and to gain favorability among all of them.
The economic situation which is another of the major indicators to look at. The COVID-19 pandemic hurt the U.S. economy, and the economic growth in the last two quarters has been strongly negative. Pasek pointed out that strongly negative numbers tend again to be something that point against reelection of an incumbent president.
Messaging explanations
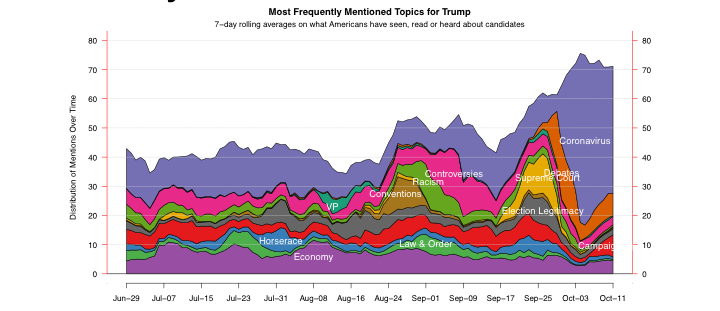
Pasek emphasized the incredible stability of polling in this election cycle. There has also been relatively stable attention to issues across the campaign. Pasek, Traugott, and Soroka contribute to a project called The Breakthrough, which asks people what they’ve seen, read, or heard about Biden and Trump over the past week. The survey has found that people are hearing essentially the same things about the candidates throughout the campaign.
This moment in American Politics
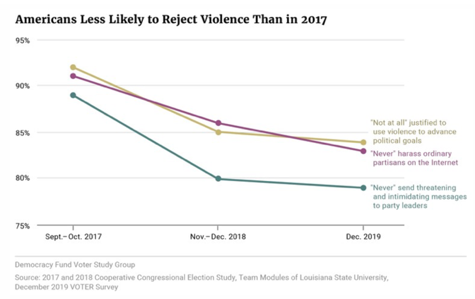
Pasek suggested there is another story that needs attention, which is this moment in American politics. He said we are in a moment “where there is increasing animosity in American politics.” Tying this sentiment to an increasing erosion of key Democratic norms, Pasek said that Americans are less likely to reject political violence than they were in 2017.
There are also issues that are more concerning, Pasek said, such as questions about whether the president is willing to accept the election results or engage in a peaceful transition of power if he does lose the election. He points to evidence that groups have been recruiting people to show up at the polls armed, which could be sort of a widespread attempt at voter suppression.
“Maybe that all points to a situation where things are a little bit more abnormal, and we really do need to worry about whether the models are right, not just because the models sometimes have error, but because they’re actually is enough distrust in the system that people may work against it,” said Pasek. If we were looking at a normal election year, Pasek said he expect this to be a change election. People tend to be not particularly happy when they don’t like the president overall, and whether the economy is poor, and polling fits in line with that pretty clearly. But given some of these unique contextual features of the campaign, he concluded that it is hard to know how this election cycle will end.
With less than a month to go before the 2020 U.S. presidential election, CPS faculty members Michael Traugott, Josh Pasek, and Stuart Soroka presented their latest findings on the state of public opinion and media coverage of the campaign. The event took place on October 14, 2020.
The State of the 2020 Presidential Campaign
Michael Traugott began by noting that this is a very interesting and unusual election. When Donald Trump ran for President in 2016, he had no prior experience in governing, and he ran explicitly as an outsider. “He is typically focused on his base,” said Traugott. “Unlike any other first-term president, who takes office and thinks about how to enlarge his coalitions.” In the 2020 presidential election, Trump is now an incumbent with a record to defend. His campaign strategy before the COVID-19 pandemic was to run on a strong economy, and to turn out his base. However, the onset of the COVID-19 pandemic has altered the course of the campaign dramatically.
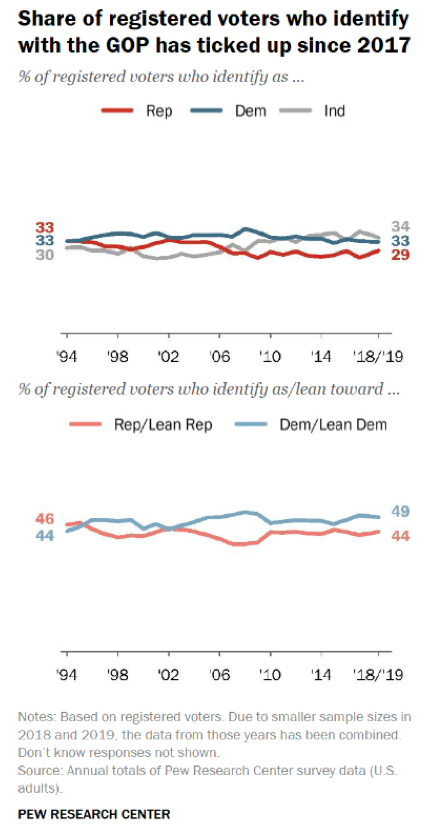
Division of partisanship in the constituency
Traugott emphasized that it is important to recognize that there are more Democrats in the adult population in the U.S. than there are Republicans. Data from the Pew Research Center show that there are about as many independents as Democrats, both of these groups outnumber the Republicans.
Furthermore, there are substantial racial and ethnic differences in party support. Among whites, the Republicans are the favored party. Among Blacks, Democrats outnumber Republicans by eight to one. Among Hispanics, Democrats outnumber Republicans by a little more than two to one, and among Asian Americans, about five to one. The demographics of the U.S. are shifting, and whites are expected to be a minority in the population by the mid-2040s. Traugott points out that there is a significant question about what it means to be a Republican or a Democrat in today’s society and how that is likely to change across the next 20-25 years.
Candidate Trait Assessments
Traugott presented data on assessments of the candidates’ traits, collected in a recent survey by the Pew Research Center. Respondents to this survey were more likely to see Joe Biden as compassionate than Donald Trump, with a 33 percentage point advantage. Biden was also seen as a good role model, with a 26 percentage point advantage, and honest, an 18 percentage point advantage. Trump stands out as energetic to respondents, with a 16 percentage point advantage.
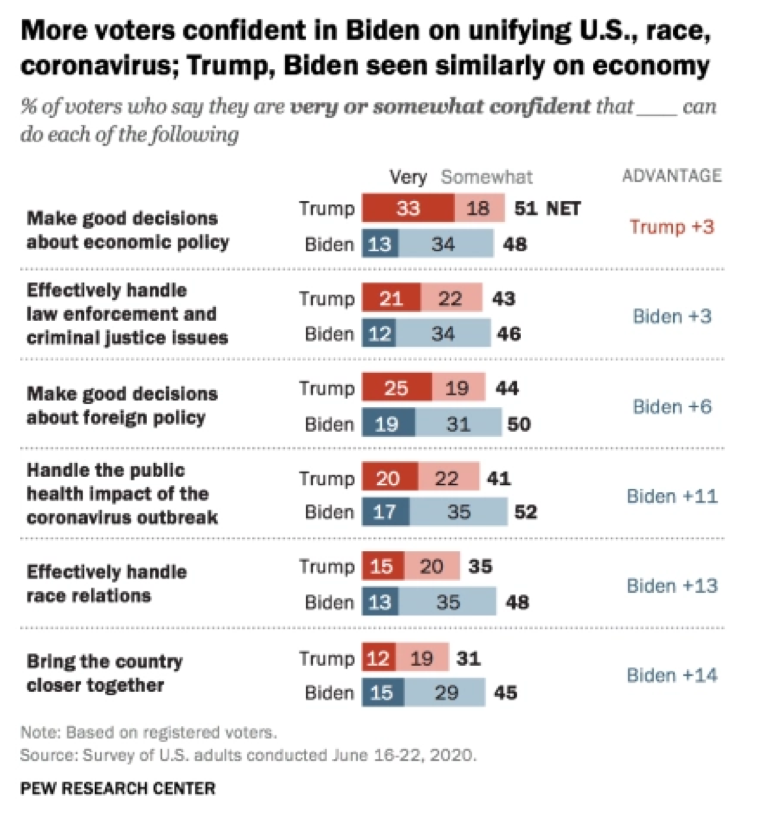
Policy Differences Between the Candidates
Traugott presented the results of a survey that asked respondents about their confidence that either Biden or Trump would make good decisions in various policy areas. Respondents rated the candidates evenly on making good decisions about economic policy. Across a series of social issues, including law enforcement and criminal justice, nominees for the Supreme Court, and foreign policy, Biden has a growing advantage.
Polling Data and Voter Turnout
Taking a national view of the polls, Biden currently has a 10.6 percentage point lead over Trump according to FiveThirtyEight. However, Traugott points out that in two of the last five U.S. presidential elections, the candidate receiving the most votes did not win the election because of the electoral college. Traugott instead encouraged the audience to pay attention to who is leading in the battleground states. He noted that Biden has an advantage in seven of these states, whereas Trump has an advantage in Texas, and Georgia is currently too close to call.
Among people who say that they’re going to vote in-person on election day, Trump is ahead by a margin of two to one. However, Biden has an advantage among those who are going to vote by mail and those who will vote in-person before election day. Traugott noted that as of October 14, there were about 10 million votes already cast in this election.
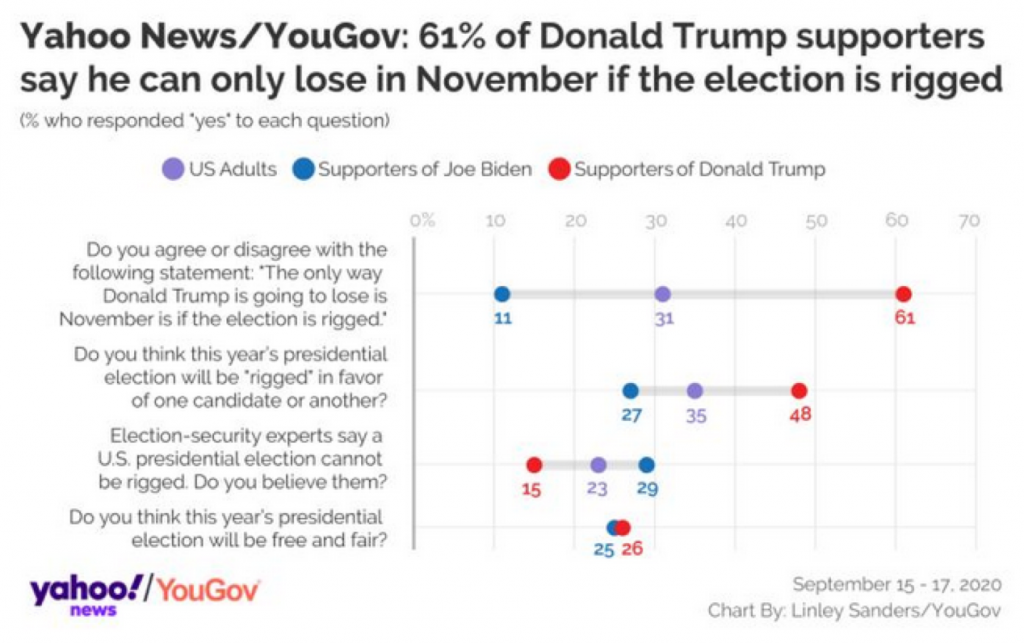
The Democrats are emphasizing turnout voting in large numbers, whereas the Trump administration has been sowing doubt about the integrity of the electoral system. Traugott presented data collected by YouGov for Yahoo News, which show the partisan differences in attitudes about whether the election will be rigged or not. Republicans are much more likely to believe that there will be problems with vote counting and irregularities. Democrats are more likely to believe election security experts who say the U.S. presidential election cannot be rigged. Traugott concluded by saying “I think the most disheartening part of this is when the respondents were asked do you think this year’s presidential election will be free and fair, only about a quarter of the respondents said yes.”
Until recently, there has been little need to measure the electoral volatility, changes in vote shares between parties, in authoritarian regimes because most conventional authoritarian regimes were either one-party or no-party systems. In general, high levels of volatility are considered to be a sign of instability in the party system and show that the existing parties are unable to build connections with their constituencies.
New research by Wooseok Kim, Allen Hicken, and Michael Bernhard examines the ways that electoral volatility in democratic regimes may be useful for understanding competitive authoritarian regimes.
As a greater number of authoritarian regimes have permitted electoral competition and greater party autonomy, electoral volatility has become more salient. Multiparty elections in competitive authoritarian regimes are different from those in democracies, in that competition is more constrained and incumbents have the ability to manipulate the outcomes.
Electoral volatility can provide clues about the level institutionalization in the ruling and opposition parties, as well as the level of support for the authoritarian incumbent. Low volatility suggests a high level of stability and control in the ruling party institutionalization; high volatility as associated with weak party organizations, weak societal roots, and low levels of cohesion.
The authors tested the relationship between electoral volatility, which is the most commonly used measure of party system institutionalization, and the survival of competitive authoritarian regimes. To do this, they used a dataset that included authoritarian regimes in the post-WWII period that hold minimally competitive multiparty elections with basic suffrage, which are determined using indicators from the Varieties of Democracy (V-Dem).
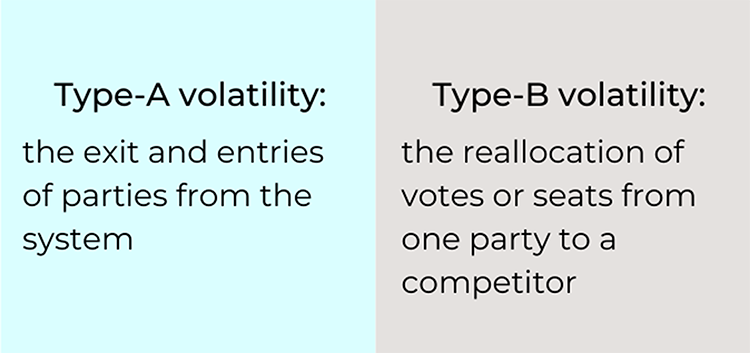
Specifically, the authors measure two types of electoral volatility in competitive authoritarian regimes: type-A volatility and type-B volatility. Type-A is volatility measures the exit and entries of parties from the system. Type-B volatility measures the reallocation of votes or seats from one party to a competitor.
Electoral authoritarian regimes are more stable when they tightly control the party system and the opposition is disorganized. The authors conclude that type-B volatility promotes authoritarian replacement, while type-A volatility is associated with a greater likelihood of a democratic transition. In addition to considering measures of party system institutionalization in authoritarian regimes, future case studies may shed more light on the link between electoral dynamics and outcomes.
This year the American National Election Study (ANES) will conduct its 19th time series study of a presidential election. In every U.S. presidential election since 1948, the ANES has conducted pre- and post-election surveys of a large representative sample of American voters.
Since 1977, the ANES has been funded by the National Science Foundation. It is used by scholars as well as high-school students, college students, and journalists. The data are made publicly available online for free as soon as it is processed after the election; principal investigators of the study do not receive privileged access to the survey data.
The ANES aims to answer two fundamental questions: how do citizens select the candidate they vote for? Why do some citizens participate in politics (e.g., vote, work on campaigns, etc.) while others do not? These questions are answered with nationally representative survey data.
The value of the ANES comes not only from the care and precision brought to designing questions, but also from the way the study balances continuity and innovation. In order to achieve this balance, the ANES asks identical questions over time about vote choice, turnout, party identification, ideology, political information, and attitudes about candidates. But even as questions are preserved over time, new questions are added about issues as they arise. The investigators and board members solicit public input on new questions and determine which ones will add value.
Recent data trends
Professor Hutchings outlined findings from some of the questions that were recently added to the ANES, including questions about the Black Lives Matter movement and police misconduct.
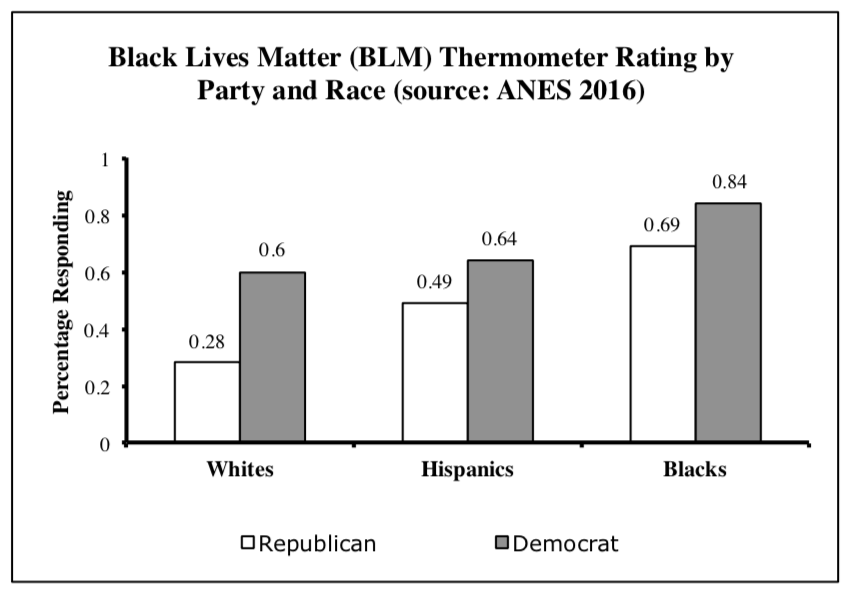
Respondents to the 2016 ANES were asked to rate the Black Lives Matter movement on a 0-100 “feeling thermometer” scale. Ratings 50-100 degrees signal favorable feelings toward the group; ratings 0-50 degrees signify unfavorable feelings. Respondents would rate the group at the 50 degree mark if they don’t feel particularly warm or cold toward the group.
Hutchings points out that there are important partisan and racial divides in the results shown above. For example, Black Republicans have warmer feelings toward the Black Lives Matter movement than white Democrats in 2016. This question will be repeated in the 2020 study, giving researchers a way to track changes in perceptions of the movement over time.
Attitudes toward the Black Lives Matter movement were a very strong predictor of the candidate a respondent would vote for in 2016. As Hutchings showed using the graphic below, voters who supported the Black Lives Matter movement were much more likely to support Hillary Clinton for president.
Similarly, perceptions of police violence were correlated with voter preference. Those respondents who believed that whites were treated better by the police were much more likely to support Hillary Clinton than respondents who believed that police are unbiased.
The value of the ANES
Professor Hutchings concluded his talk by reflecting on the value of the ANES. “It allows us an opportunity to assess the health of our democracy,” he said. “We can assess levels of trust in government, levels of perceived corruption in government, levels of racial animus, levels of religious and gender intolerance. We can assess how things have changed – or how things have not changed – over time. And we can only do this as a consequence of this study.”

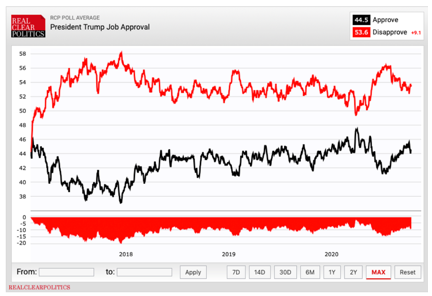 Pasek noted that there has never before been a U.S. president with a negative net favorability rating for his entire term, but this is true of Trump. A majority of individuals who have ever been asked whether they approve or disapprove of the president’s job have said that they do not approve. This is very unusual, said Pasek. Usually approval is strongly correlated with reelection chances, and an approval rate of 44 percent would not be associated with reelection. But it’s also an unusual way to target one-self as a sitting president, who typically tries to represent all the American people and to gain favorability among all of them.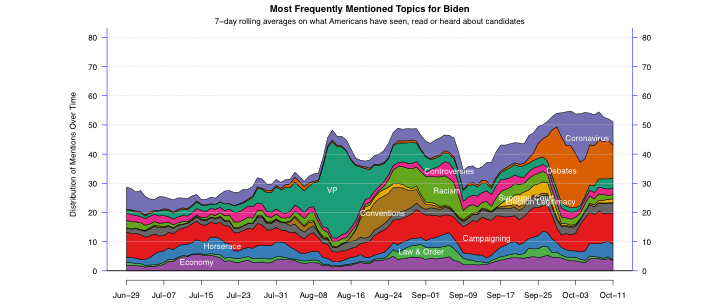
 Division of partisanship in the constituency
 Policy Differences Between the Candidates