
post written by Solmaz Spence
“Gerrymandering”— when legislative maps are drawn to the advantage of one party over the other during redistricting—received its name in 1812, when Massachusetts Governor Elbridge Gerry signed off on a misshapen district that was said to resemble a salamander, which a newspaper dubbed a “gerrymander.”
But although the idea of gerrymandering has been around for a while, proving that a state’s legislature has deliberately skewed district lines to benefit one political party remains challenging.
The problem is that the mere presence of partisan bias in a district map tells us very little about the intentions of those drawing the districts. Factors such as racial segregation, housing and labor markets, and transportation infrastructure can lead to areas where one party’s supporters are more geographically clustered than those of the other party. When this happens, the party with a more concentrated support base achieves a smaller seat share because it racks up large numbers of “surplus” votes in the districts it wins, while falling just short of the winning threshold in many of the districts it loses.
Further, there are many benign reasons that legislatures may seek to redistrict voters—for example, to keep communities of interest together and facilitate the representation of minorities—that may have the unintended consequence of adding a partisan spin to the map.
The research of political scientists Jowei Chen and Jonathan Rodden is helping to differentiate cases of deliberate partisan gerrymandering from other redistricting efforts. Chen, Faculty Associate at the University of Michigan’s Center for Political Studies, and Rodden, Professor of Political Science at Stanford University, have devised a computer algorithm that ignores all partisan and racial considerations when drawing districts, and instead creates thousands of alternative district maps based on traditional districting goals, such as equalizing population, maximizing geographic compactness, and preserving county and municipal boundaries. These simulated maps are then compared against the district map that has been called into question to assess whether partisan goals motivated the legislature to deviate from traditional districting criteria.
We first wrote about Chen and Rodden’s work back in December 2016, detailing a 2015 paper in the Election Law Journal, which used the controversial 2012 Florida Congressional map to show how their approach can demonstrate and unconstitutional partisan gerrymander. Now, this work is back in the spotlight: Chen’s latest research has been cited in several cases of alleged gerrymandering that are currently working through the courts in Pennsylvania, North Carolina, Wisconsin and Maryland.
In January, Chen’s testimony as an expert witness was cited when the Pennsylvania Supreme Court threw out the state’s U.S. House of Representatives district map. In its opinion, the court said the Pennsylvania map unconstitutionally put partisan interests above other line-drawing criteria, such as eliminating municipal and county divisions.
The Pennsylvania districts in question were drawn by the Republican-controlled General Assembly in 2011. Immediately, the shape of the districts was an indicator that at least one traditional criterion of districting—compactness—had been overlooked.
Though few states define exactly what compactness means, it is generally taken to mean that all the voters within a district should live near one another, and that the boundaries of the district should be create a regular shape, rather than the sprawling polygon with donut holes or tentacles that characterized the Pennsylvania district map.
In particular, District 7—said to resemble Goofy kicking Donald Duck—had been called into question. “It is difficult to imagine how a district as roschachian and sprawling, which is contiguous in two locations only by virtue of a medical facility and a seafood/steakhouse, respectively, might plausibly be referred to as compact,” the court wrote.
Although there are more registered Democrats than Republicans in Pennsylvania, Democrats hold only five of the state’s 18 congressional districts. In the 2016 election, Democrats won each of their five House seats with an average of 75 percent of the vote while Republicans’ margin of victory was an average of 62 percent across their 13 districts. This is an indicator of “packing,” a gerrymandering practice that concentrates like-minded voters into as few districts as possible to deny them representation across districts.
Chen’s expert report assessed the district map and carried out simulations to generate alternative districting plans that strictly followed non-partisan, traditional districting criteria, and then measured the extent to which the current district map deviates from these simulated plans.
To measure the partisanship of the computer-simulated plans, Chen overlaid actual Pennsylvania election results from the past ten years onto the simulated districts, and calculated the number of districts that would have been won by Democrats and Republicans under each plan (see Figure 1).
The districting simulation process used precisely the same Census geographies and population data that the General Assembly used in creating congressional districts. In this way, the simulations were able to account for any geographical clustering of voters; if the population patterns of Pennsylvania voters naturally favor one party over the other, the simulated plans would capture that inherent bias.
Generally, the simulations created seven to ten Republican districts; not one of the 500 simulated districting plans created 13 Republican districts, as exists under the Republican-drawn district map. Thus, the map represented an extreme statistical outlier, a strong indication that the enacted plan was drawn with an overriding partisan intent to favor that political party. This led Chen to conclude “with overwhelmingly high statistical certainty that the enacted plan created a pro-Republican partisan outcome that would never have been possible under a districting process adhering to non-partisan traditional criteria.”
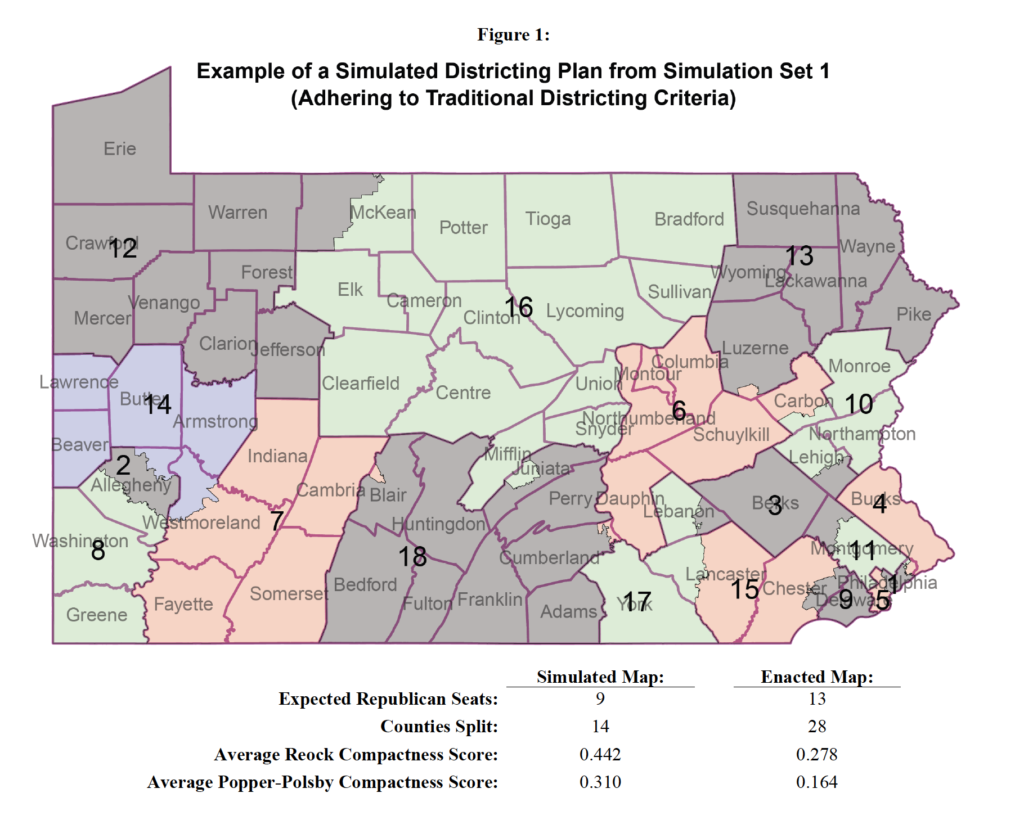
This table compares the simulated plans to the 2011 Pennsylvania district map with respect to these various districting criteria.
Following its ruling, on February 20 the Pennsylvania Supreme Court released a new congressional district map that has been described in a Washington Post analysis as “much more compact”. In response, the state’s Republican leadership announced plans to challenge the new map in court.