Sep 19, 2013 | Elections, Innovative Methodology, International
Post developed by Katie Brown in coordination with Brian Min.
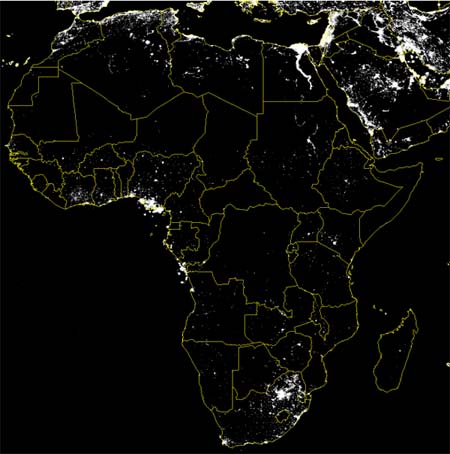
This satellite image identifies nightlights in Africa. The accuracy of maps like this has been validated for developed regions. But how accurate are these maps for smaller villages in developing nations, like Western Africa?
Center for Political Studies (CPS) researcher Brian Min – along with Kwawu Mensan Gaba, Ousmane Fall Sarr, and Alassane Agalassou – tested the efficacy of this imagery. The resulting article, “Detection of Rural Electrification in Africa Using DMSP-OLS Night Lights Imagery,” was just published in International Journal of Remote Sensing. The study is part of Min’s larger World Bank initiative titled “Tracking Light from the Sky.”
The project seeks to test the reliability of DMSP-OLS imagery. The study focuses on Senegal and Mali and consists of two parts. On the ground, the researchers interviewed the chiefs of 202 villages in Senegal and the AMADER operators in 30 villages in Mali about electricity use. These results were coupled with data on 800 unelectrified villages in Senegal and 99 in Mali, as identified via administrative data and paper maps. Then, the data were compared to DMSP-OLS imagery.
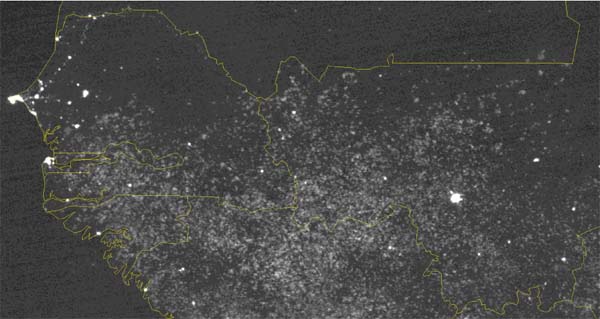
The study finds that DMSP-OLS imagery is indeed a reliable indicator of electricity in villages. But there are some caveats. First, streetlights drive light detection, whereas household electricity does not register as brightly. So, villages with more streetlights appear brighter in the satellite imagery. Second, the imagery is sensitive to weather conditions, especially cloud cover. Finally, the reliability of the images increases when they are composites created over time. For example, the image below shows the two countries – Senegal to the west and part of Mali to the east – over the course of May 2011.
Validating DMSP-OLS as an indicator of electricity in remote villages of the developing world has several implications. First, these images are more cost effective than on-the-ground surveys. Second, these images are captured nightly, creating a natural archive. Third, this allows identification of otherwise remote villages in the developing world.
With DMSP-OLS, the World Bank can monitor existing projects and initiate new projects to enhance global connectivity, communication, and transparency.
Sep 5, 2013 | Current Events, Elections, Innovative Methodology, National
Post developed by Katie Brown in coordination with Michael Traugott.
In the American presidential election of 2012, most polls predicted a narrow win for Democratic incumbent Barack Obama over Republican challenger Mitt Romney. But on November 5, 2012, Obama won both the popular vote (62,611,250 to 59,134,475) and the Electoral College (332 to 206) by a comfortable margin.
Most major polling organizations underestimated Obama’s votes, yet closely targeted Romney’s outcome. Gallup and Rasmussen, on the other hand, overestimated Romney’s vote share, projecting that he would win.
In order to understand its error and, more importantly, correct its estimation for future elections, Gallup called upon Professor of Communication Studies and Center for Political Studies (CPS) Research Professor Mike Traugott. Traugott studies public opinion, survey methodology, and voting technology, with more than 100 articles and book chapters and 12 books published.
Traugott’s connection to the project goes beyond his expertise. Early in his career, he worked for Gallup founder George Gallup. Traugott has also served as president of the American Association for Public Opinion Research (AAPOR). In 2008, he chaired an AAPOR committee to investigate the causes of an industry-wide estimation error in the New Hampshire primary. As a follow up, AAPOR launched an initiative to make polling practices more transparent. Though the initiative garnered initial support, it hasn’t matured as rapidly as hoped because many commercial firms are reluctant to expose their proprietary methods. Yet, given the widespread mispredictions of 2012, Gallup agreed to make its investigation transparent as a service to the public and the pre-election polling profession.
Gallup’s initial investigation, led by Traugott and published here, identifies several potential contributing factors to the errant projection. The main problem appears to lie in the sampling design. Gallup interviews potential voters using only a combination of listed landline and cell phones. Because listed landline users are more likely to be conservative, Gallup’s respondent pool skewed conservative. Other potential factors include giving more weight to past voting behavior than other polls, time zone issues, and the format of race and ethnicity questions. Further, Gallup, like other major polling organizations, does not take the candidates’ campaign effort into account. As this map illustrates, in 2012, the candidates focused most of their campaign spending in battleground states, which in turn impacted turnout and vote choice by state.
In response to the report, Gallup has brought in a team of researchers which will test the hypotheses derived from the initial report during the 2013 New Jersey and Virginia gubernatorial elections. Traugott is also leading a graduate seminar this fall at the University of Michigan that will allow students to participate in the design of the experiments and analyze data related to the inquiry. According to Traugott, this is a “very unusual, almost once in a lifetime chance to combine real world applications of conceptual and theoretical issues about survey design.”