Perspective on research from Guoer Liu, doctoral student in Political Science, and recipient of the 2019 Roy Pierce Award
Guoer Liu
“Not which ones, but how many” is a phrase used in list experiments instruction, where researchers instruct participants, “After I read all four (five) statements, just tell me how many of them upset you. I don’t want to know which ones, just how many.” In retrospect, I was surprised to see that this phrase encapsulates not only the key research idea, but also my fieldwork adventure: not which plans could go awry, but how many. The fieldwork experience could be frustrating at times, but it has led me to uncharted terrain and brought insights into the research contexts. The valuable exposure would not have been possible without support from the Roy Pierce Award and guidance from Professor Yuki Shiraito.
Research that I conducted with Yuki Shiraito explores the effect of behavior on political attitudes in authoritarian contexts to answer the question: does voting for autocracy reinforce individual regime support? To answer this question, two conditions need to be true. First, people need to honestly report their level of support before- and after- voting in authoritarian elections. Second, voting behavior needs to be random. Neither situation is probable in illiberal autocracies. Our project addresses these methodological challenges by conducting a field experiment that combines a list experiment and a randomized encouragement design in China.
In this study, list experiments are used instead of direct questions to measure the respondents’ attitudes towards the regime in the pre- and post-election surveys. The list experiment is a survey technique to mitigate preference falsification by respondents. Although the true preference of individual respondents will be hidden, the technique allows us to identify the average level of support for the regime within a group of respondents. In addition, we employ a randomized encouragement design where get-out-the-vote messages are randomly assigned, which help us estimate the average causal effect of a treatment. For effect moderated by prior support for the regime, we estimate the probability of the prior support using individual characteristics and then estimate the effect for the prior supporters via a latent variable model.
While the theoretical part of the project went smoothly and the simulation results were promising, the complication of fieldwork exceeded my expectation. For the list experiment survey, the usually reticent respondents started asking questions about the list questions immediately after the questionnaires were distributed. Their queries took the form of “I am upset by option 1, 2, and 4, so what number should I write down here?” This was not supposed to happen. List experiments are developed to conceal individual respondents’ answers from researchers. By replacing the questions of “which ones” with the question of “how many,” respondents’ true preference is not directly observable, which makes it easier for them to answer sensitive questions honestly. Respondents’ eagerness to tell me their options directly defeats the purpose of this design. Later I learned from other researchers that the problem I encountered was common in list experiment implementation regardless of research contexts and types of respondents.
The rationale behind respondents’ desire to share their individual options despite being given a chance to hide them is thought-provoking. Is it because of the cognitive burden of answering a list question, which is not a familiar type of questions to respondents? Or is it because the sensitive items, despite careful construction, raise the alarm? Respondents are eager to specify their stance on each option and identify themselves as regime supporters: they do not leave any room for misinterpretation. To ease the potential cognitive burden, we will try a new way to implement the list experiment in a similar project on preference falsification in Japan. We are looking forward to seeing if it improves respondents’ comprehension of the list question setup. The second explanation is more concerning, however. It suggests the scope condition of list experiments as a valid tool to elicit truthful answers from respondents. Other more implicit tools, such as endorsement experiments, may be appropriate in those contexts to gauge respondent’s preference.
Besides the intricacies of the list experiment, carrying out encouragement design on the ground is challenging. We had to modify the behavioral intervention to adapt needs from our local collaborators, and the realized sample size was only a fraction of the negotiated size initially. Despite the compromises, the implementation is imbued with uncertainty: meetings were postponed or rescheduled last minutes, instructions from local partners are sometimes inconsistent and conflictual. The frustration was certainly real. But the pain makes me cognizant of judgment calls researchers have to make in the backstage. The amount of effort required to produce reliable data is admirable. And as a consumer of data, I should always interpret data with great caution.
While the pilot study does not lead to a significant finding directly, the research experience and the methods we developed have informed the design of a larger project that we are currently doing in Japan.
I always thought of doing research as establishing a series of logical steps between a question and an answer. Before I departed for the pilot study, I made a detailed timeline for the project with color-coded tasks, flourish-shaped arrows pointing at milestones of the upcoming fieldwork. When I presented this plan to Professor Shiraito, he smiled and told me that “when doing research, it is generally helpful to think of the world in two ways: the ideal world and the real world. You should be prepared for both.” Wise words. Because of this, I am grateful for the Roy Pierce Award for offering the opportunity to catch a glimpse of the real world. And I am indebted to Professor Shiraito for helping me see the potential of attaining the ideal world with intelligence and appropriate tools.
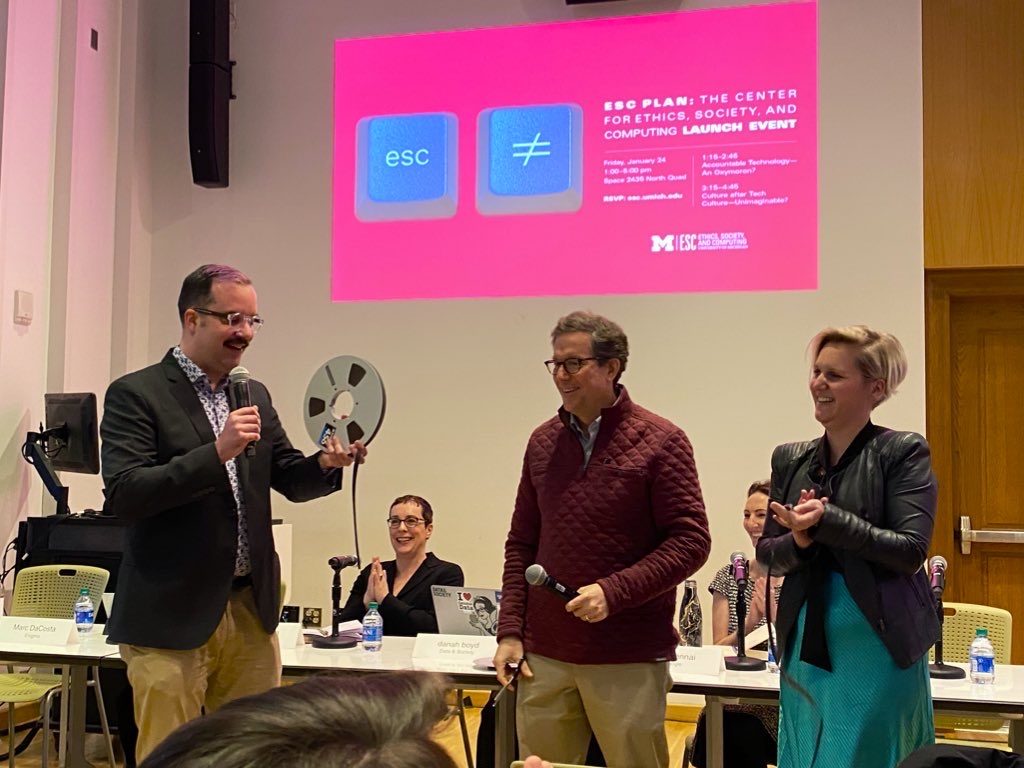
Christian Sandvig, the Director of the new Center for Ethics, Society, and Computing (ESC), says he developed this new center “to reconcile the fact that I love computers, but I’m horrified by some of the things we do with them.” ESC is dedicated to intervening when digital media and computing technologies reproduce inequality, exclusion, corruption, deception, racism, or sexism. The center was officially launched at an event on January 24, 2020. Video of the event is available here.
The associate director of ESC, Silvia Lindtner, elaborated on ESC’s mission at the event. “I’ve learned over the years not to shy away from talking about things that are uncomfortable,” she said. “This includes talking about things like sexism, racism, and various forms of exploitation – including how this involves us as researchers, and how we’ve experienced these ourselves.”
ESC is sponsored by the University of Michigan School of Information, Center for Political Studies (CPS), and the Department of Communication and Media. CPS Director Ken Kollman called the new center “an exciting, interdisciplinary effort to ask and address challenging questions about technology, power, and inequality.” Thomas Finholt, Dean of the School of Information, said, “if you look at the world around us there are a seemingly unlimited number of examples where individual leaders or contributors would have benefitted dramatically from the themes this center is going to take on.”
The wide range of disciplines represented among the ESC faculty is essential to its mission. “To have people in computer science, engineering, social science, and humanities interacting together on questions about the impacts of technology strikes me as the kind of necessary, but all too rare, collaborative efforts for generating new ideas and insights,” Kollman said.
Christian Sandvig, Thomas Finholt, and Sylvia Lindtner cut the ribbon to launch the ESC Center
The launch event was comprised of two panel discussions featuring notable experts in technology and its applications. The first panel, “Accountable Technology — An Oxymoron?” explored the ways that big companies, the media, and individual consumers of technology hold the tech industry accountable for issues of equity and fairness. Pulitzer Prize-winning journalist Julia Angwin highlighted journalists’ role in investigating and framing coverage of tech, including her work to launch a publication dedicated to the investigation of the technology industry. Jen Gennai, Google executive responsible for ethics, fielded questions from the audience about accountability. danah boyd, Principal Researcher at Microsoft Research and the founder of Data & Society, and Marc DaCosta, co-founder and chairman of Enigma, rounded out the panel, which was moderated by Sandvig.
During the second panel, “Culture After Tech Culture — Unimaginable?” Silvia Lindtner, Holly Okonkwo, Michaelanne Dye, Monroe Price, Shobita Parthasarathy, and André Brock debated the inevitability of technology’s impact on culture, and how the future might be reimagined. The panelists challenged the audience to think of technology from the perspectives of different cultures around the world, not just a single monolithic entity. Questions from the audience interrogated the ways the tech could be more inclusive.
ESC organizers encourage students and faculty to get involved with the new center. A series of mixers to get to know ESC are scheduled through the spring.
How much does partisanship explain how legislative districts are drawn? Legislators commonly agree on neutral criteria for drawing district lines, but the extent to which partisan considerations overshadow these neutral criteria is often the subject of intense controversy.
Jowei Chen developed a new way to analyze legislative districts and determine whether they have been unfairly gerrymandered for partisan reasons. Chen, an Associate Professor of Political Science and a Research Associate at the Center for Political Studies, used computer simulations to produce thousands of non-partisan districting plans that follow traditional districting criteria.
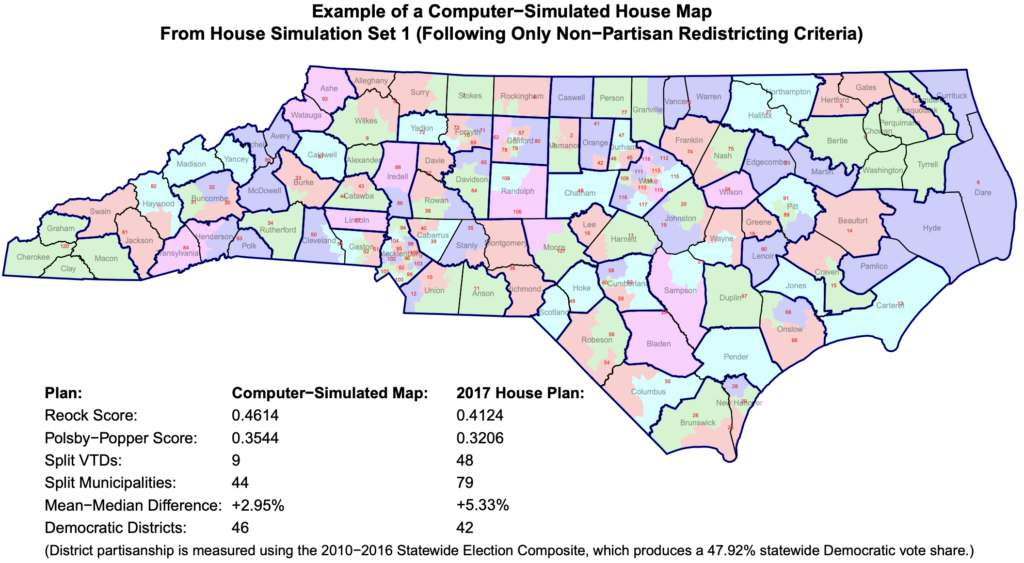
These simulated district maps formed the basis of Chen’s recent expert court testimony in Common Cause v. Lewis, a case in which plaintiffs argued that North Carolina state legislative district maps drawn in 2017 were unconstitutionally gerrymandered. By comparing the non-partisan simulated maps to the existing districts, Chen was able to show that the 2017 districts “cannot be explained by North Carolina’s political geography.”
The simulated maps ignored all partisan and racial considerations. North Carolina’s General Assembly adopted several traditional districting criteria for drawing districts, and Chen’s simulations followed only these neutral criteria, including: equalizing population, maximizing geographic compactness, and preserving political subdivisions such as county, municipal, and precinct boundaries. By holding constant all of these traditional redistricting criteria, Chen determined that the 2017 district maps could not be explained by factors other than the intentional pursuit of partisan advantage.
Specifically, when compared to the simulated maps, Chen found that the 2017 districts split far more precincts and municipalities than was reasonably necessary, and were significantly less geographically compact than the simulations.
By disregarding these traditional standards, the 2017 House Plan was able to create 78 Republican-leaning districts out of 120 total; the Senate Plan created 32 Republican-leaning districts out of 50.
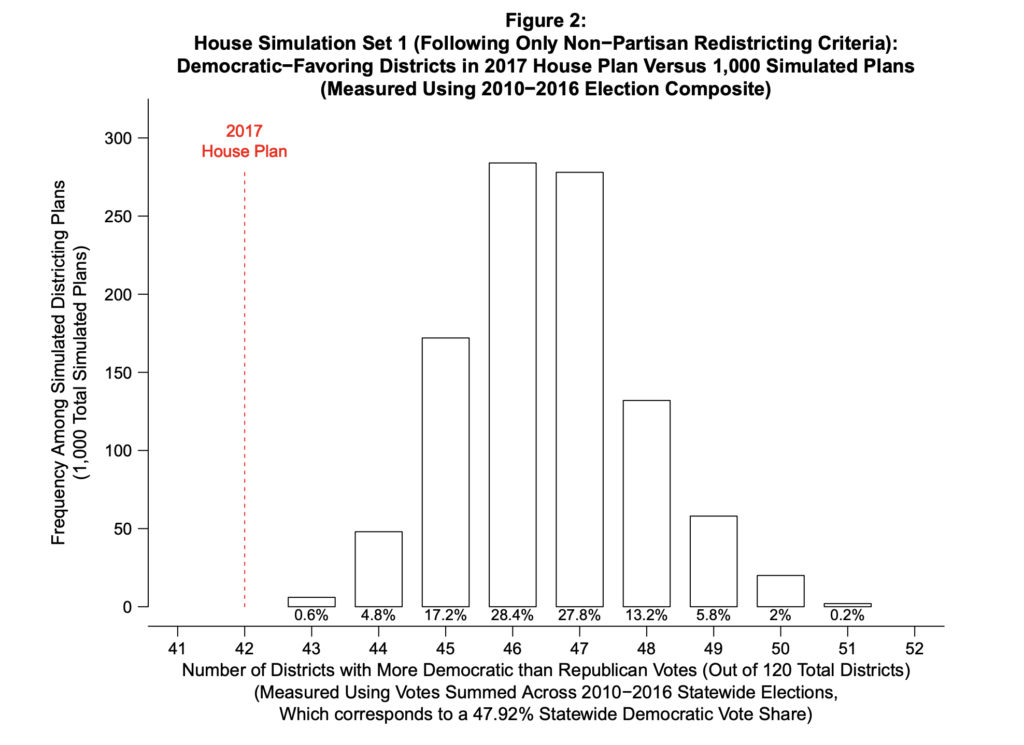
Using data from 10 recent elections in North Carolina, Chen compared the partisan leanings of the simulated districts to the actual ones. Every one of the simulated maps based on traditional criteria created fewer Republican-leaning districts. In fact, the 2017 House and Senate plans were extreme statistical outliers, demonstrating that partisanship predominated over the traditional criteria in those plans.
Determining whether legislative maps are fair will be an ongoing process involving courts and voters across different states. But in recent years, the simulation techniques developed by Chen have been repeatedly cited and relied upon by state and federal courts in Pennsylvania, Michigan, and elsewhere as a more scientific method for measuring how much districting maps are gerrymandered for partisan gain.
A new election forensics process developed by Walter Mebane and Alejandro Pineda uses machine-learning to examine not just text, but images, too, for Twitter posts that are considered reports of “incidents” from the 2016 US Presidential Election.
Mebane and Pineda show how to combine text and images into a single supervised learner for prediction in US politics using a multi-layer perceptron. The paper notes that in election forensics, polls are useful, but social media data may offer more extensive and granular coverage.
The research team gathered individual observation data from Twitter in the months leading up to the 2016 US Presidential Election. Between Oct. 1-Nov. 8, 2016, the team used Twitter APIs to collect millions of tweets, arriving at more than 315,180 tweets that apparently reported one or more election “incidents” – an individual’s report of their personal experience with some aspect of the election process.
At first, the research team used only text associated with tweets. But the researchers note that sometimes, images in a tweet are informative, while the text is not. It’s possible for the text alone to not make a tweet a report of an election incident, while the image may indeed show an incident.
To solve this problem, the research team implemented some “deep neural network classifier methods that use both text and images associated with tweets. The network is constructed such that its text-focused parts learn from the image inputs, and its image-focused parts learn from the text inputs. Using such a dual-mode classifier ought to improve performance. In principle our architecture should improve performance classifying tweets that do not include images as well as tweets that do,” they wrote.
“Automating analysis for digital content proves difficult because the form of data takes so many different shapes. This paper offers a solution: a method for the automated classification of multi-modal content.” The research team’s model “takes image and text as input and outputs a single classification decision for each tweet – two inputs, one output.”
The paper describes in detail how the research team processed and analyzed tweet-images, which included loading image files in batches, restricting image types to .jpeg or .png., and using small image sizes for better data processing results.
The results were mixed.
The researchers trained two models using a sample of 1,278 tweets. One model combined text and images, the other focused only on text. In the text-only model, accuracy steadily increases until it achieves top accuracy at 99%. “Such high performance is testimony to the power of transfer learning,” the authors wrote.
However, the team was surprised that including the images substantially worsened performance. “Our proof-of-concept combined classifier works. But the model structure and hyperparameter details need to be adjusted to enhance performance. And it’s time to mobilize hardware superior to what we’ve used for this paper. New issues will arise as we do that.”
Dr. Ocampo’s dissertation grounds the theory of belonging and political participation within the literature. This research, which she is expanding into a book, finds that feelings of belonging in American society strongly predict higher levels of political engagement among Latinos. This concept represents the intersection of political science and political psychology. Dr. Ocampo draws from psychology research that belonging is a human need; people need to feel that they are a part of a group in order to succeed and have positive individual outcomes, as well as group outcomes. She builds on these psychological concepts to develop this theory of social belonging in the national community, and how this influences the perception of relationship to the polity.
The book will explore the social inclusion of racial and ethnic minorities, and how that shapes the way they participate in politics. Dr. Ocampo argues that the idea of perceiving that you belong, and the extent to which others accept you, has an influence on your political engagement and opinion of policies. For the most part, Dr. Ocampo looks at Latinos in the US, but the framework is applicable to other racial and ethnic groups. She is also collecting data among Asian Americans, African Americans, and American Muslims to look at perceived belonging.
Methodological Expertise
Before she began this research, there were no measures to capture data on belonging in existing surveys. Dr. Ocampo validated new measures and tested and replicated them in the 2016 collaborative multiracial postelection survey.
While observational data is useful for finding correlations, it can’t identify causality. For this reason, experiments also inform Dr. Ocampo’s research. In one experiment, she randomly assigned people to a number of different conditions. Subjects assigned to the negative condition showed a significant decrease in their perceptions of belonging. However, among those assigned to the positive condition, there were no corresponding positive results. In both the observational data and experiments, Dr. Ocampo notes that experiences of discrimination are highly influential and highly determinant of feelings of belonging. That is, the more experiences of discrimination you’ve had in the past, the less likely you are to feel that you belong.
Doing qualitative research has taught Dr. Ocampo the importance of speaking with her research subjects. “It’s not until you get out and talk to people running for office and making things happen that you understand how politics works for everyday people. That’s why the qualitative data and survey work are really important,” she says. By leveraging both qualitative and quantitative methodologies, Dr. Ocampo is able to arrive at more robust conclusions.
A Sense of Belonging in the Academic Community
Starting in the Fall of 2020, Dr. Ocampo will be an Assistant Professor of Political Science at the University of Michigan and a Faculty Associate of the Center for Political Studies. She says that the fact that her work is deeply personal to her is what keeps her engaged. As an immigrant herself, Dr. Ocampo says, “I’m doing this for my family. I’m in this for other young women and women of color, other first-generation scholars. When they see me give a class or a lecture, they know they can do it, too.”
Dr. Ocampo is known as a supportive member of her academic community. She says it’s an important part of her work: “The reason it’s important is that I wouldn’t be here if it wouldn’t have been for others who opened doors, were supportive, were willing to believe in me. They were willing to amplify my voice in spaces where I couldn’t be, or where I wasn’t, or where I didn’t even know they were there.” She notes that in order to improve the profession and make it a more diverse and welcoming place where scholars thrive, academics have to take it upon themselves to be inclusive.
“Gerrymandering”— when legislative maps are drawn to the advantage of one party over the other during redistricting—received its name in 1812, when Massachusetts Governor Elbridge Gerry signed off on a misshapen district that was said to resemble a salamander, which a newspaper dubbed a “gerrymander.”
But although the idea of gerrymandering has been around for a while, proving that a state’s legislature has deliberately skewed district lines to benefit one political party remains challenging.
The problem is that the mere presence of partisan bias in a district map tells us very little about the intentions of those drawing the districts. Factors such as racial segregation, housing and labor markets, and transportation infrastructure can lead to areas where one party’s supporters are more geographically clustered than those of the other party. When this happens, the party with a more concentrated support base achieves a smaller seat share because it racks up large numbers of “surplus” votes in the districts it wins, while falling just short of the winning threshold in many of the districts it loses.
Further, there are many benign reasons that legislatures may seek to redistrict voters—for example, to keep communities of interest together and facilitate the representation of minorities—that may have the unintended consequence of adding a partisan spin to the map.
The research of political scientists Jowei Chen and Jonathan Rodden is helping to differentiate cases of deliberate partisan gerrymandering from other redistricting efforts. Chen, Faculty Associate at the University of Michigan’s Center for Political Studies, and Rodden, Professor of Political Science at Stanford University, have devised a computer algorithm that ignores all partisan and racial considerations when drawing districts, and instead creates thousands of alternative district maps based on traditional districting goals, such as equalizing population, maximizing geographic compactness, and preserving county and municipal boundaries. These simulated maps are then compared against the district map that has been called into question to assess whether partisan goals motivated the legislature to deviate from traditional districting criteria.
We first wrote about Chen and Rodden’s work back in December 2016, detailing a 2015 paper in the Election Law Journal, which used the controversial 2012 Florida Congressional map to show how their approach can demonstrate and unconstitutional partisan gerrymander. Now, this work is back in the spotlight: Chen’s latest research has been cited in several cases of alleged gerrymandering that are currently working through the courts in Pennsylvania, North Carolina, Wisconsin and Maryland.
In January, Chen’s testimony as an expert witness was cited when the Pennsylvania Supreme Court threw out the state’s U.S. House of Representatives district map. In its opinion, the court said the Pennsylvania map unconstitutionally put partisan interests above other line-drawing criteria, such as eliminating municipal and county divisions.
The Pennsylvania districts in question were drawn by the Republican-controlled General Assembly in 2011. Immediately, the shape of the districts was an indicator that at least one traditional criterion of districting—compactness—had been overlooked.
Though few states define exactly what compactness means, it is generally taken to mean that all the voters within a district should live near one another, and that the boundaries of the district should be create a regular shape, rather than the sprawling polygon with donut holes or tentacles that characterized the Pennsylvania district map.
In particular, District 7—said to resemble Goofy kicking Donald Duck—had been called into question. “It is difficult to imagine how a district as roschachian and sprawling, which is contiguous in two locations only by virtue of a medical facility and a seafood/steakhouse, respectively, might plausibly be referred to as compact,” the court wrote.
Although there are more registered Democrats than Republicans in Pennsylvania, Democrats hold only five of the state’s 18 congressional districts. In the 2016 election, Democrats won each of their five House seats with an average of 75 percent of the vote while Republicans’ margin of victory was an average of 62 percent across their 13 districts. This is an indicator of “packing,” a gerrymandering practice that concentrates like-minded voters into as few districts as possible to deny them representation across districts.
Chen’s expert report assessed the district map and carried out simulations to generate alternative districting plans that strictly followed non-partisan, traditional districting criteria, and then measured the extent to which the current district map deviates from these simulated plans.
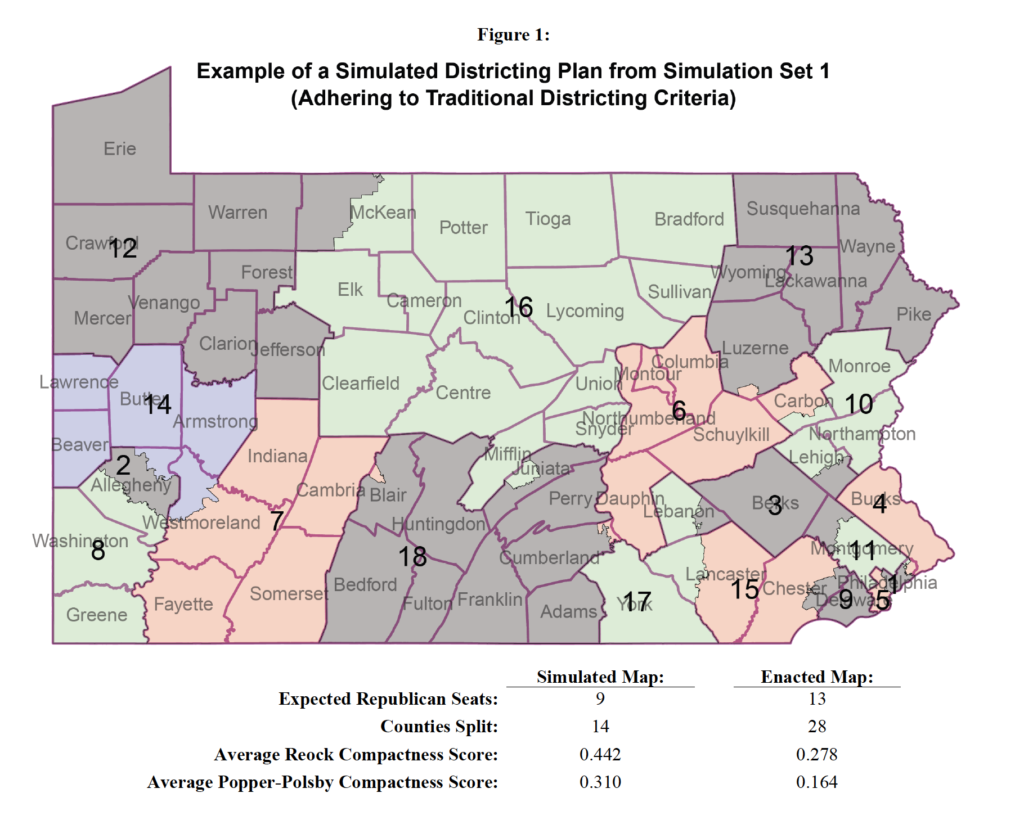
To measure the partisanship of the computer-simulated plans, Chen overlaid actual Pennsylvania election results from the past ten years onto the simulated districts, and calculated the number of districts that would have been won by Democrats and Republicans under each plan (see Figure 1).
The districting simulation process used precisely the same Census geographies and population data that the General Assembly used in creating congressional districts. In this way, the simulations were able to account for any geographical clustering of voters; if the population patterns of Pennsylvania voters naturally favor one party over the other, the simulated plans would capture that inherent bias.
Generally, the simulations created seven to ten Republican districts; not one of the 500 simulated districting plans created 13 Republican districts, as exists under the Republican-drawn district map. Thus, the map represented an extreme statistical outlier, a strong indication that the enacted plan was drawn with an overriding partisan intent to favor that political party. This led Chen to conclude “with overwhelmingly high statistical certainty that the enacted plan created a pro-Republican partisan outcome that would never have been possible under a districting process adhering to non-partisan traditional criteria.”
This table compares the simulated plans to the 2011 Pennsylvania district map with respect to these various districting criteria.
Following its ruling, on February 20 the Pennsylvania Supreme Court released a new congressional district map that has been described in a Washington Post analysis as “much more compact”. In response, the state’s Republican leadership announced plans to challenge the new map in court.

 Post developed by Katherine Pearson and Angela Ocampo