Post developed by Nicholas Valentino and Katherine Pearson
Survey research is an ever-evolving field. Technology has increased the number of ways to reach respondents, while simultaneously reducing response rates by freeing people from the constraints of one land-line telephone per household. Surveys remain an essential tool for making inferences about societal and political trends, so many survey researchers offer incentives to survey respondents in order to ensure a large and representative sample. Financial incentives to complete surveys, in turn, entice some people to respond to a large number of online surveys on a regular basis, essentially becoming professional survey respondents.
Survey methodologists have carefully considered the ways that survey modes may impact the way people answer questions. Talking to a real person is different than answering questions online. But less is known about how individual factors bias participation in surveys in the first place. For example, might personality traits shape your willingness to agree to answer a survey online versus someone who comes to your door? New work from researchers at the University of Michigan and Duke suggests in fact this is the case.
In order to examine the personality traits of survey respondents, the research team used data from the 2012 and 2016 American National Election Studies (ANES). During these two study periods, the ANES ran parallel and face-to-face surveys. In both years, the ANES included the 10-item personality inventory (TIPI), which consists of pairs of items asking respondents to assess their own traits. Based on the responses, respondents build a profile of “the Big Five” personality traits: openness to experience, conscientiousness, extraversion, agreeableness, and emotional stability.
Big Five traits with corresponding TIPI qualities
Trait
TIPI Qualities
Coding
Openness to experience
Open to new experiences, complex
Conventional, uncreative
Original
Reversed
Conscientiousness
Dependable, self-disciplined
Disorganized, careless
Original
Reversed
Extraversion
Extraverted, enthusiastic
Reserved, quiet
Original
Reversed
Agreeableness
Critical, quarrelsome
Sympathetic, warm
Reversed
Original
Emotional Stability
Anxious, easily upset
Calm, emotionally stable
Reversed
Original
Researchers were able to compare responses to the TIPI with measures of political predispositions and policy preferences, based on responses to questions on the ANES. These include partisanship, liberal–conservative ideology, issue self-placements, and other measures of political orientation.
Based on these data, the authors found that respondents in the online samples were, on average, less open to experience and more politically conservative on a variety of issues compared to those responding to face-to-face surveys. They also found that the more surveys a respondent completed, the lower they scored on measures of openness. Given that professionalized survey respondents comprise the majority of online survey samples, these results suggest caution for those who would like to generalize results to the population at large. It is not enough to balance samples on simple demographics. Attitudinal and personality based differences might also lead online sample estimates to diverge from the truth.
It is difficult to say whether online survey respondents or face-to-face respondents are more representative of personality traits in the general population. If personality is a factor in whether someone will participate in a survey, that might bias both types of samples. However, the authors note that the data suggest that professional online samples are the outlier. They find “that samples based on fresh cross-sections, both face-to-face and online, yield better population estimates for personality and political attitudes compared to professionalized panels.” While it may be possible to mitigate the potential sampling bias of personality traits, it is important that survey researchers understand the role that personality traits play in professional online samples.
In every U.S. presidential election since 1948, the American National Election Studies (ANES) has conducted pre- and post-election surveys of a large representative sample of American voters. ANES participant interviews looked different in 2020 than they did in the past; the COVID19 pandemic made traditional face-to-face interviews impractical and risky. The study team began planning for the extraordinary circumstances in March, without any idea what the conditions would be when interviews began in August. The team pivoted nimbly to redesign the study even as the onset of data collection approached.
The majority of interviews in 2020 were completed as web surveys, some following an online format similar to one used in 2016, and others using an innovative mixed-mode design. Respondents to the mixed-mode surveys were randomly assigned either to complete the questionnaire by themselves online, or to take the survey with a live interviewer via a Zoom video link. Few surveys conduct live video interviews, but the ANES study team felt that it was critical to explore the use of this technology as a potential means of balancing issues of cost, continuity, and data quality.
To answer online surveys, respondents must have reliable access to the Internet and comfort using computers. Under normal circumstances, people without access to computers or the Internet in their homes can gain access in public settings like libraries or at their workplace. With many of these places closed due to the pandemic, online access became a bigger challenge. In mixed-mode cases where it was difficult to complete a web or video interview, interviewers contacted the respondents to secure a phone interview. Providing phone interviews helped the team strengthen sample quality by reaching respondents without access to the Internet as well as those who are less comfortable using computers.
Data collection for the 2020 surveys, out of necessity, departed significantly from the practices of the past 70 years of the ANES. The study team will continue to monitor and address the implications of these changes. In the end, the team was pleased to field a very high quality survey with relatively high response rates, thoroughly vetted questions, and the largest sample in the history of ANES.
Pre-election surveys
Pre-election interviews began in August 2020. The pre-election questionnaire is available on the ANES website. The questionnaire includes time series questions dating back to the earliest days of the ANES survey, as well as new questions that reflect more recent developments in the study of American politics. The ANES team must always be prepared to add a few questions late in the design process to capture substantial developments in the presidential campaign or American society. In 2020 the survey added questions about election integrity, urban unrest, and COVID-19, among other topics.
The investigators, ANES staff, and their survey operations partners at Westat monitored the data collection closely, in case further adjustments in procedures or sample were required. The final pre-election sample consists of over 8,200 complete or sufficient-partial interviews. This includes a reinterview panel with the respondents from the ANES 2016 Time Series. Over 2,800 respondents from the 2016 study were reinterviewed, more than three quarters of the original group.
Post-election surveys
Post-election interviews began on November 8, 2020, and will be completed on January 4, 2021. This post-election effort includes additional respondents who took part in the 2000 study of the General Social Survey (GSS). Due to the pandemic-altered timing of the GSS data collection, it was not possible to interview these individuals prior to the election. However, these respondents completed nearly all of the ANES post-election interview, plus almost ten minutes of critical questions that appeared on the ANES pre-election interview, and several additional questions suggested by the GSS team.
ANES staff will continue to review and clean the data into the new year, including checks of respondent eligibility that may alter the final sample in modest ways. Pending this review, the team expects response rates to come in slightly below the 2016 web response rates.
Overall, despite the challenges of this past year, the ANES study team was able to gather robust data from a large probability sample of Americans, extending the longest-running, most in-depth, and highest quality survey of US public opinion and voting behavior, at a critical juncture for American society and democracy. The team will continue to share updates, here and on the ANES website, as data from this survey become available.
This year the American National Election Study (ANES) will conduct its 19th time series study of a presidential election. In every U.S. presidential election since 1948, the ANES has conducted pre- and post-election surveys of a large representative sample of American voters.
Since 1977, the ANES has been funded by the National Science Foundation. It is used by scholars as well as high-school students, college students, and journalists. The data are made publicly available online for free as soon as it is processed after the election; principal investigators of the study do not receive privileged access to the survey data.
The ANES aims to answer two fundamental questions: how do citizens select the candidate they vote for? Why do some citizens participate in politics (e.g., vote, work on campaigns, etc.) while others do not? These questions are answered with nationally representative survey data.
The value of the ANES comes not only from the care and precision brought to designing questions, but also from the way the study balances continuity and innovation. In order to achieve this balance, the ANES asks identical questions over time about vote choice, turnout, party identification, ideology, political information, and attitudes about candidates. But even as questions are preserved over time, new questions are added about issues as they arise. The investigators and board members solicit public input on new questions and determine which ones will add value.
Recent data trends
Professor Hutchings outlined findings from some of the questions that were recently added to the ANES, including questions about the Black Lives Matter movement and police misconduct.
Respondents to the 2016 ANES were asked to rate the Black Lives Matter movement on a 0-100 “feeling thermometer” scale. Ratings 50-100 degrees signal favorable feelings toward the group; ratings 0-50 degrees signify unfavorable feelings. Respondents would rate the group at the 50 degree mark if they don’t feel particularly warm or cold toward the group.
Hutchings points out that there are important partisan and racial divides in the results shown above. For example, Black Republicans have warmer feelings toward the Black Lives Matter movement than white Democrats in 2016. This question will be repeated in the 2020 study, giving researchers a way to track changes in perceptions of the movement over time.
Attitudes toward the Black Lives Matter movement were a very strong predictor of the candidate a respondent would vote for in 2016. As Hutchings showed using the graphic below, voters who supported the Black Lives Matter movement were much more likely to support Hillary Clinton for president.
Similarly, perceptions of police violence were correlated with voter preference. Those respondents who believed that whites were treated better by the police were much more likely to support Hillary Clinton than respondents who believed that police are unbiased.
The value of the ANES
Professor Hutchings concluded his talk by reflecting on the value of the ANES. “It allows us an opportunity to assess the health of our democracy,” he said. “We can assess levels of trust in government, levels of perceived corruption in government, levels of racial animus, levels of religious and gender intolerance. We can assess how things have changed – or how things have not changed – over time. And we can only do this as a consequence of this study.”
The initial release of the 2016 American National Election Studies (ANES) Time Series dataset is approaching. Since 1948, the ANES- a collaborative project between the University of Michigan and Stanford University- has conducted benchmark election surveys on voting, public opinion, and political participation. This year’s polarizing election warranted especially interesting responses. Shanto Iyengar, one of the project’s principal investigators and Stanford professor of political science, noted, “The data will tell us the extent to which Trump and Clinton voters inhabit distinct psychological worlds.”
To learn more about the study, we asked Ted Brader (University of Michigan professor of political science and one of the project’s principal investigators) a few questions about this year’s anticipated release.
When was the data collected?
The study interviewed respondents in a pre-election survey between September 7 and November 7, 2016. Election day was November 8. The study re-interviewed as many as possible of the same respondents in a post-election survey between November 9 and January 8, 2017.
The ANES conducted face-to-face and internet interviews again for 2016. How are these samples different from 2012? What are the sample sizes and the response rates?
The study has two independently drawn probability samples that describe approximately the same population. The target population for the face-to-face mode was 222.6 million U.S. citizens age 18 or older living in the 48 contiguous states and the District of Columbia, and the target population for the Internet mode was 224.1 million U.S. citizens age 18 or older living in the 50 U.S. states or the District of Columbia. In both modes, the sampling frame was lists of residential addresses where mail is delivered, and to be eligible to participate, a respondent had to reside at the sampled address and be a U.S. citizen age 18 or older at the time of recruitment.
The response rate, using the American Association for Public Opinion Research (AAPOR) formula for the minimum response rate on the pre-election interview, was 50 percent for the face-to-face component and 44 percent for the Internet component. The response rate for the face-to-face component is weighted to account for subsampling during data collection; due to subsampling for the face-to-face mode, the unweighted response rate would not be meaningful.
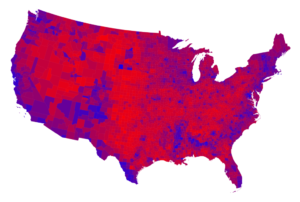
Photo Credit: Mark Newman (University of Michigan)
The re-interview rate on the post-election survey was 90 percent for the face-to-face component and 84 percent for the Internet component.
Are there any other aspects of the design that you think are particularly important?
I’d emphasize the effort to collect high quality samples via both in-person and online interviews for the whole survey as obviously the most important design aspect of the 2016 study, helping us to learn more about the trade-offs between survey mode and potential benefits of mixed mode data collection.
Are there any new questions that you think users will be particularly interested in?
Along with many previous questions that allow researchers to look at short and long term trends, we have lots of new items related to trade, outsourcing, immigration, policing, political correctness, LGBT issues, gender issues, social mobility, economic inequality, campaign finance, and international affairs.
What do you think some of the biggest challenges were for the 2016 data collection?
With increasing levels of polarization and a highly negative campaign, some Americans were much more resistant to participating in the survey. Many seemed to feel alienated, distrustful, and sick of the election. Under these circumstances, we worked hard with our partners at Westat to overcome this reluctance and are pleased to have recruited such a high quality sample by Election Day.
What are you most excited about when you think of the 2016 ANES?
The 2016 contest was in many ways a particularly fascinating election, even for those of us who usually find elections interesting! The election ultimately centered on two highly polarizing candidates, and people of many different backgrounds felt a lot was at stake in the outcome. Thus, not surprisingly, there was energetic speculation throughout the year about what voters were thinking and why they supported Clinton or Trump. The 2016 ANES survey provides an incredibly rich and unparalleled set of data for examining and testing among these speculations. I expect it will take some time to arrive at definitive answers, but I’m excited to release this wealth of evidence so the search for the truth can begin in earnest.
Is there anything else you’d like to share?
I would note that future releases will include redacted open-ended comments by respondents, numerical codings of some of the open-ended answers, and administrative data (e.g., interviewer observations, timing, etc.).
As of October, the latest national polls, predicted that the 2016 Election results will reflect the largest gender gap in vote choice in modern U.S. history. Today, according to NPR, “An average of three recent national polls shows that women prefer Clinton by roughly 13 points, while men prefer Trump by 12, totaling a 25-point gap.” If these polls prove true, the 2016 results would indicate a much larger gender gap than what was observed in 2012, where women overwhelmingly supported Barack Obama over Mitt Romney.
2012 vote by gender based on national exit poll conducted by Edison Media Research.
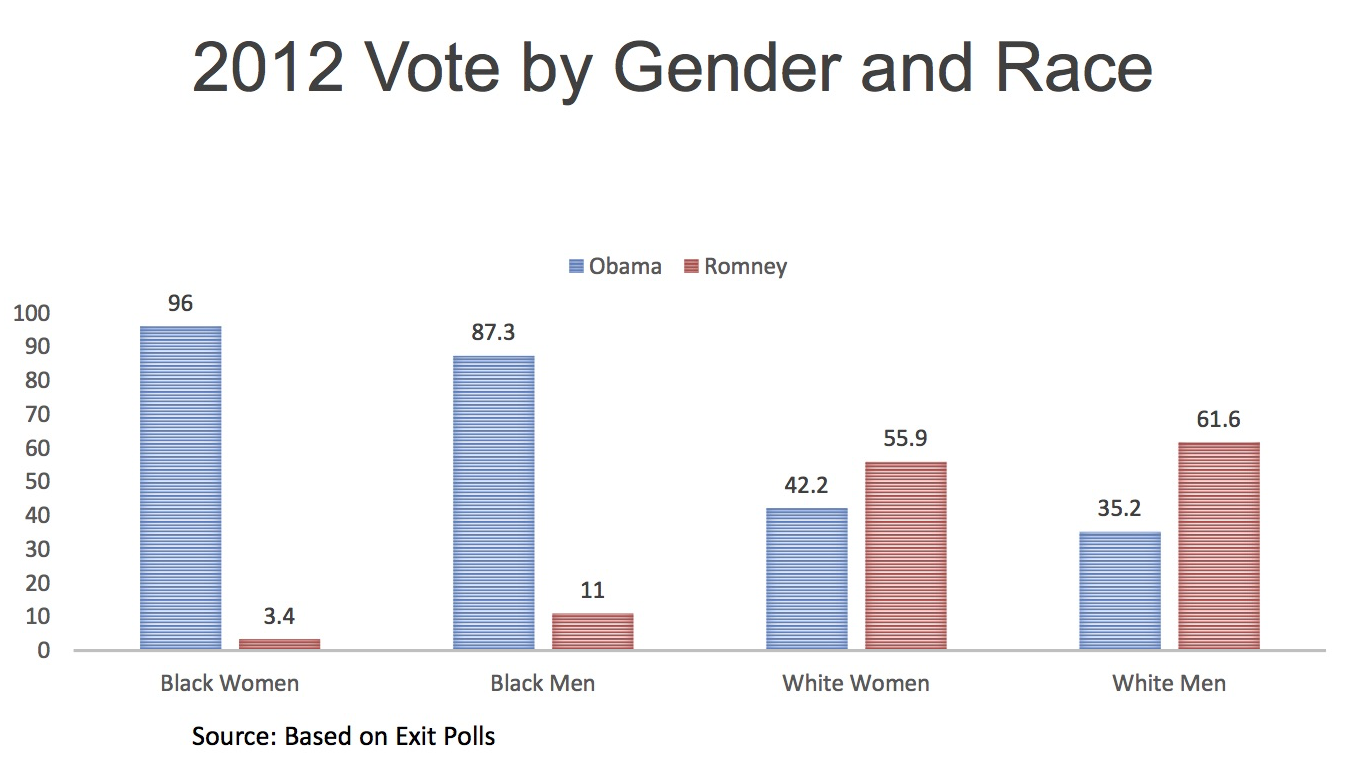
University of Texas at Austin Professor Tasha Philpot argues that what really may be driving this gap to even greater depths, is race. For instance, here’s the same data from the 2012 Election, broken down by gender and race.
2012 vote by gender and race based on national exit poll conducted by Edison Media Research.
Often overlooked in the discussion of the gender gap, race figures prominently into many American’s political identities.
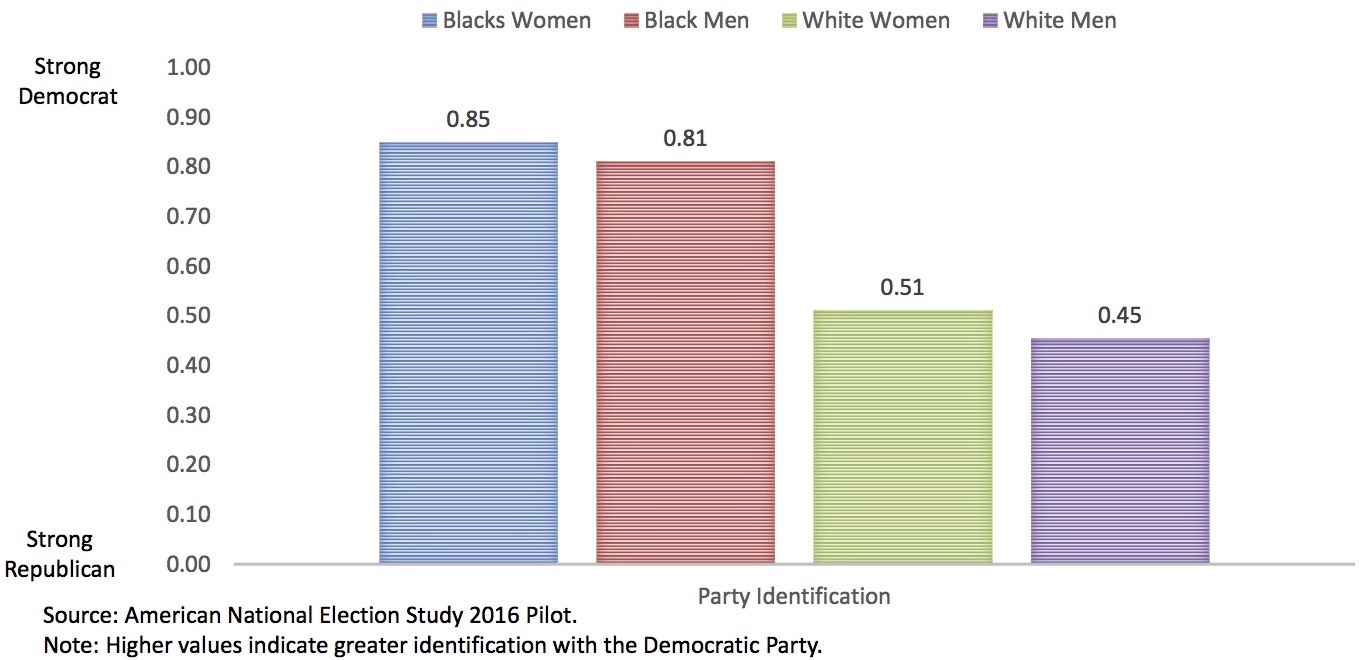
2016 Gender Gap in Party Identification
2016 Gender Gap in Party Identification.
Philpot recently participated in the panel “What We Know So Far About the 2016 Elections” at the University of Michigan’s Center for Political Studies. In her talk, “Race and the Gender Gap in the 2016 Election,” Philpot outlined the potential sources for the gender gap and emphasized the role that race is playing in widening the gap.
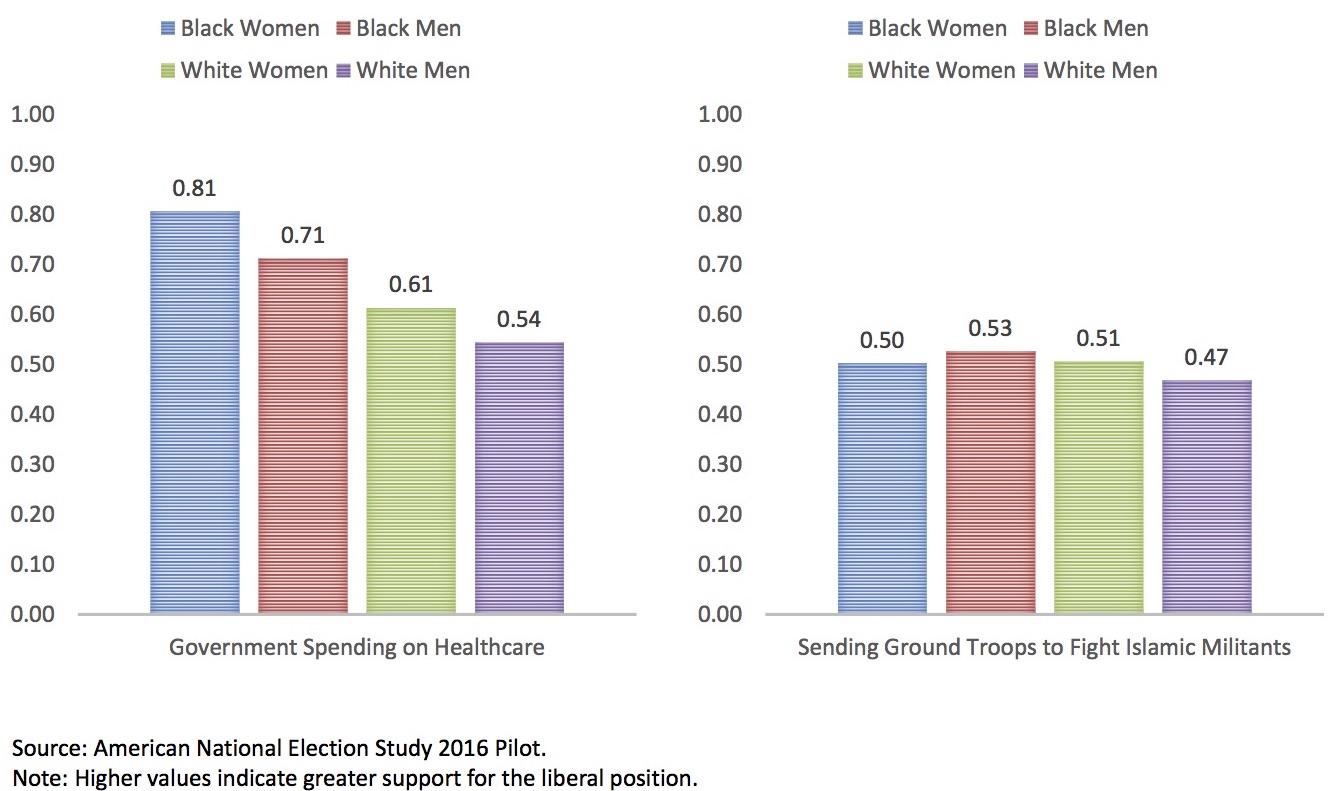
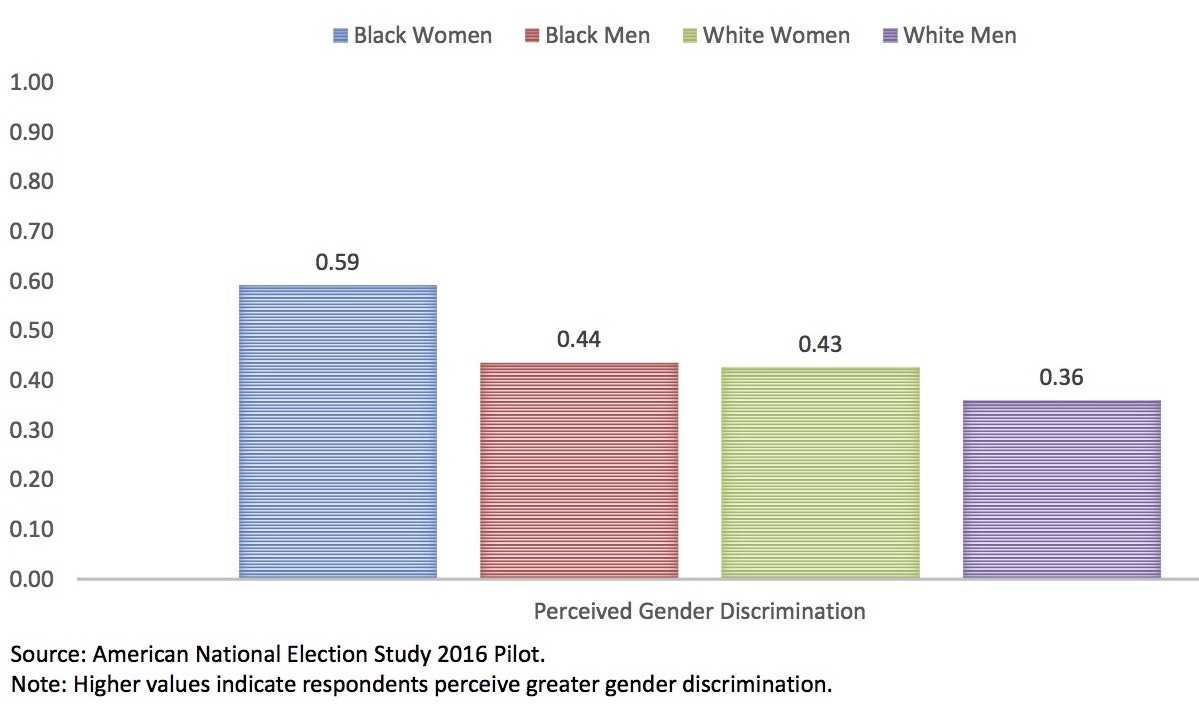
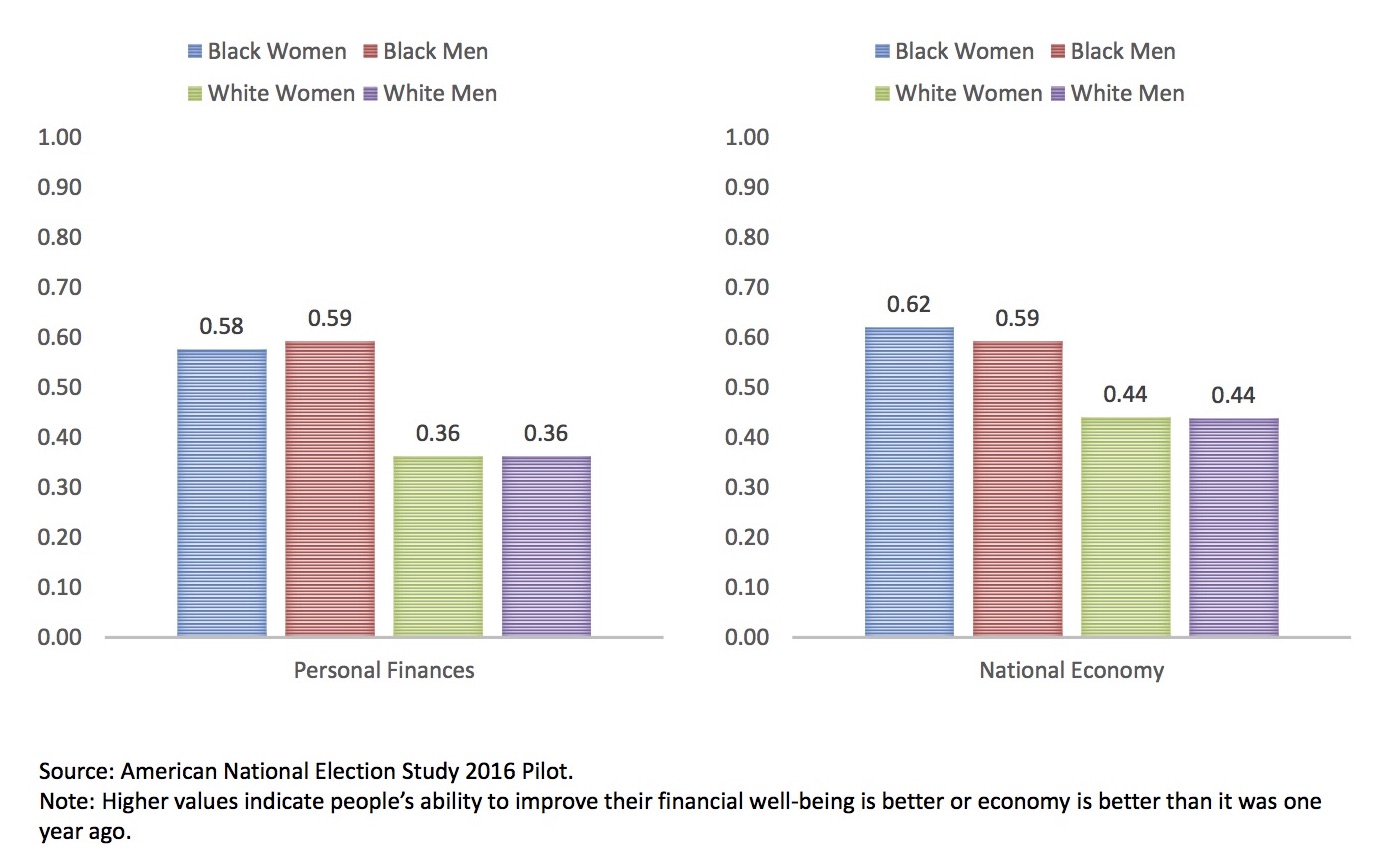
Using data from the ANES 2016 Pilot Study, Philpot compared opinions from white and black men and women on several issues such as government spending, inequality and discrimination, and evaluations of the economy. While there were noticeable differences strictly between men and women, the real story became clear when Philpot sorted the results by gender and race. Small gender gaps exist among both whites and blacks, but the most remarkable difference of opinions on all issues is between black women and white men.
SPENDING ON HEALTH CARE AND DEFENSE
2016 Gender Gap in Spending on Healthcare and Defense.
Perceived Gender Discrimination
2016 Gender Gap in Perceived Discrimination Based on Gender
Evaluations of the Economy
2016 Gender Gap in Economic Evaluations.
On most issues, black women and white men fall on opposite sides of the political spectrum. Philpot concludes that it’s an oversimplification to consider the gender gap as merely a gap between men and women, when, in reality, the observed gender gap is largest between white men and black women.
What We Know So Far About the 2016 Elections, was held on October 5, 2016 at the Center for Political Studies, University of Michigan. The panel also included the following talks:
Stuart Soroka: Read, Seen or Heard: A Text-Analytic Approach to Campaign Dynamics Nicholas Valentino: The Underappreciated Role of Sexism in the 2016 Presidential Race Michael Traugott: Pre-Election Polls in the 2016 Campaign
Post developed by Catherine Allen-West and Arthur Lupia
ICYMI (In Case You Missed It) this post details the Election Research Preacceptance Competition, organized by Arthur Lupia and Brendan Nyhan. Lupia discussed this initiative at the “Roundtable on the CPS Special Issue on Transparency in the Social Sciences” at APSA 2016 on Friday, September 2, 2016.
How can scholars study politics most effectively? The Election Research Preacceptance Competition (http://www.erpc2016.com) is an innovative initiative that will test a new approach to conducting and publishing political science research during the 2016 election.
Entrants in the competition will preregister a research design intended to study an important aspect of the 2016 general election using data collected by the American National Election Studies (ANES). A condition of entering the competition is that entrants must complete and register a design before the ANES data are released. Many leading academic journals have agreed to review scholarly articles that include these research plans and to review them before the data are available or results are known.

 Post developed by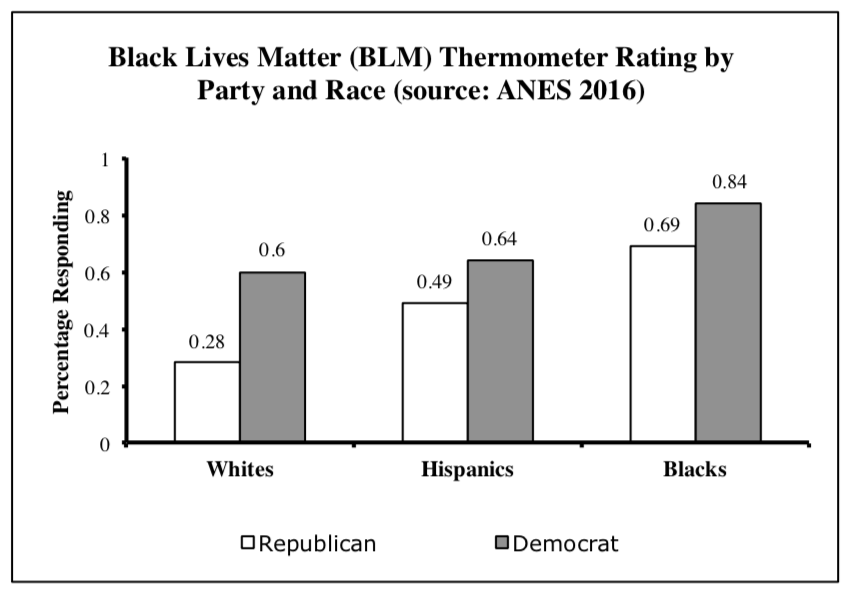


 With increasing levels of polarization and a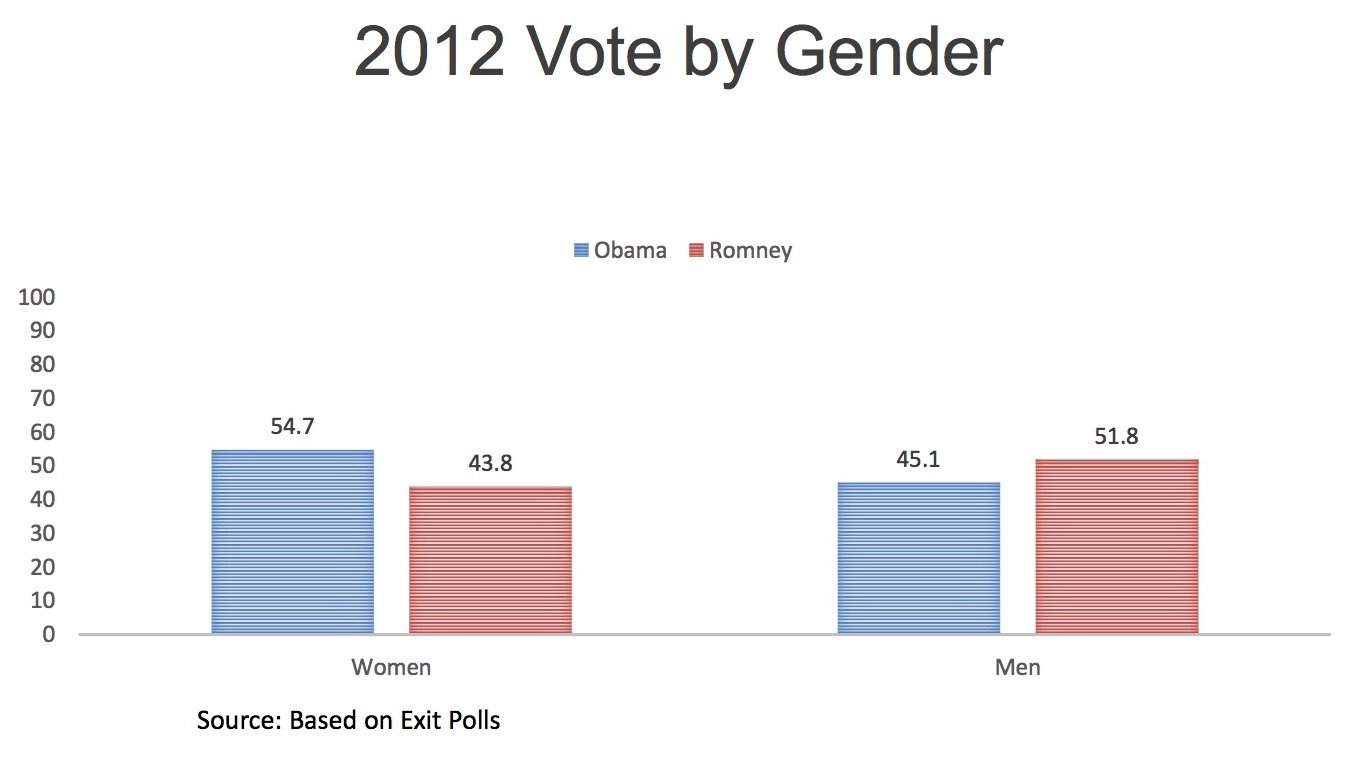
 How can scholars study politics most effectively? The Election Research Preacceptance Competition (