The future of affirmative action is unclear, but public opposition remains stable
Post developed by Katie Brown.
In June of this year, the Supreme Court of the United States maintained the legality of affirmative action programs at American colleges and universities – for now. The Supreme Court’s seven-to-one decision pushes American colleges and universities to prove the utility of affirmative action programs. The court declined to rule specifically on a case regarding the University of Texas at Austin’s affirmative action policy. This week, the UT Austin case was debated before a federal court.
How does the American public feel about affirmative action, and has their support or opposition changed over time? The American National Election Studies (ANES) can be used to examine such trends. For 65 years, the ANES has interviewed a representative sample of voting age Americans on a variety of topics, including but not limited to voting and turnout, public policy support, societal values, and demographics. As ANES describes, the resulting data “inform the nation about itself.”
There are many ways to measure levels of support or opposition for affirmative action. Since 1992, ANES has asked the American voting age public whether it is “for or against” one type of affirmative action: preferential hiring and promotion of blacks. As the graph below illustrates, public opposition in the United States for this type of affirmative action appears both dominant and stable over the time period 1992-2012.
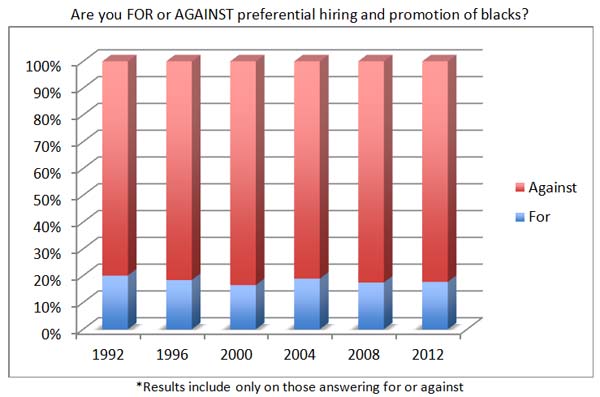
In 2012, ANES also asked a question about support or opposition for the use of quotas to admit black students to colleges and universities. The results were similar, with 77% of respondents opposing such a program and 23% of respondents being in support.
The latest Supreme Court ruling comes on the heels of a 2003 Supreme Court decision regarding the University of Michigan‘s use of affirmative action in its decision-making process for admitting students. The Court upheld the use of affirmative action by the University’s law school but negated the use of affirmative action in its undergraduate admissions. In 2006, voters from the state of Michigan voted in support of a ballot referendum, Proposition 2, which made affirmative action illegal in the state. Then in November of 2012, the state of Michigan’s 6th Circuit Court of Appeals overturned Proposition 2. Last month, the constitutionality of Proposition 2 went before the Supreme Court of the United States.
The latest court proceedings suggest that the future of affirmative action remains unclear, but results from the ANES suggest that public opposition to affirmative action remains stable. Yet, no single question or two can encapsulate feelings toward an issue as complex as this one.