Nov 30, 2017 | Current Events, Elections, Michigan, Race, Student Experiences
Post developed by Mara Ostfeld and Catherine Allen-West
The effectiveness of America’s system of democratic representation, in practice, turns on broad participation. Yet only about 60 percent of voting eligible Americans cast their vote in presidential elections. This number is nearly cut in half in off-year elections (about 36 percent), and participation in local elections is even lower. This lack of electoral engagement does not fall equally across racial and ethnic subgroups. Latinos, for one, are particularly underrepresented at polling booths across the country. In 2016, eligible Latino voters were about 20 percentage points less likely to vote than their White counterparts, and about 13 percentage points less likely to vote than their Black counterparts.
This fall, a group of 24 University of Michigan undergraduate students sought to explore this disparity and pinpoint what, if anything, works to increase Latino political participation. In the class, entitled The Politics of Latinidad, CPS Faculty Associate and U-M Political Science Professor Mara Ostfeld taught her students how to measure public opinion and challenged them to analyze the factors that affect Latino political participation.
Today, more than 50,000 Latinos live in Detroit and a majority of them reside in City Council District 6 in Southwest Detroit which is precisely where this course focused. The students began by studying the history of Latinos in Southeast Michigan and exploring how Latinos played critical roles in the city’s development dating back to before World War I. They analyzed broad trends in Latino public opinion, and considered how and why these patterns might be similar or different in Detroit. Students then designed their own pre-election polls to take into the field.
In order to understand what affects voter turnout, students surveyed over 300 residents of Southwest Detroit to measure the issues that were most important to them.

Students pictured here: Storm Boehlke, Mohamad Zawahra, Alex Tabet , Hannel So, Sion Lee.
The results illustrate some powerful patterns. Among the issues that the residents found most important, immigration and crime stood out. Forty-nine and 45 percent of Latinos listed immigration and crime, respectively, as issues of particular concern, with only 31 percent of residents saying that they felt safe in their own home.
Latinos in Southwest Detroit feel extremely high levels of discrimination. Seventy percent of Latinos surveyed said they felt Latinos face “a great deal” of discrimination. This significantly exceeds the roughly half of Latinos nationwide who say they have experienced discrimination.

Student Alex Garcia visits residents in Detroit.
Local issues were also at the forefront of residents’ minds. Latinos had mixed views on the city’s use of blight tickets to combat housing code violations, with one third of respondents supporting them and one third opposing them.
As local organizations, like Michigan United, continue trying to get a paid sick leave initiative on the ballot in 2018, they can expect strong support among Latinos in Southwest Detroit. About two out of every three Latinos in the area indicated they would be more likely to support a candidate who supports the paid sick leave requirement.
The students then followed up with the residents a month later to see if they planned to vote in the upcoming city council election. At this point, the students implemented some interventions that have been used to increase political participation like, evoking emotions that have been shown to have a mobilizing effect, framing voting as an important social norm, and speaking with voters immediately before an election. With the election now over, students are back in the classroom analyzing the effectiveness of these interventions and will use their first-hand experience to better understand public opinion and political participation.
Apr 10, 2017 | Current Events
by Megan Bayagich

On January 21, 2017, nearly half a million people flocked to Washington D.C. for the Women’s March. They carried various signs about reproductive rights, anti-Trump sentiment, and intersectionality amongst feminists. The event hosted several celebrities who spoke about women’s empowerment and stressed the need for resistance against the new administration. Just one day earlier, Donald Trump had been sworn into office as the 45th President of the United States, and a different crowd of protestors organized a Counter-Inaugural protest to display their concern. Michael Heaney, a political sociologist at the University of Michigan, collected data on the participants at both protests, shedding light on the types of people who attended and their reasons for doing so. Heaney recently presented this work at the Center for Political Studies at the University of Michigan.
The foundation of Heaney’s research centers on the theory of “mesomobilization” – an explanation for how protests form and become organized. Typically, a central group decides to take action and declares a frame for the movement. The central group then brings other people together that would be motivated by this specific frame. Therefore, the theory suggests that all protestors share certain commonalities. In this case, the protestors were all highly motivated by women’s rights. Heaney aimed to further explore participants’ identities and compare them to that of the Counter-Inaugural protest, which advantageously occurred in the same city.
Heaney hired a team to sample the two crowds. Stationed at different places throughout the protests, the team would look out over the crowd and select an individual. To reduce bias, the sampler would count five people away from their selected individual then approach this person to participate in a six-page survey. After asking three people in the surrounding area to complete their survey, the team member would begin a different round at a new location and select another random protestor. This cycle repeated until the team gathered about 180 responses at the Counter-Inaugural protest and roughly 320 at the Women’s March.

The survey produced some interesting results:
- The two crowds showed no difference in ideology. When asked if they leaned left, right, or center, nearly every respondent answered “left.” However, protestors at the Women’s March were much more partisan. When asked about their partisan identification (i.e. independent, independent who leans Democrat/Republican, moderate Republican/Democrat, strong Republican/Democrat, or third party), they answered they leaned more towards the Democratic Party.
- Counter-Inaugural protestors were more inclined than Women’s Marchers to believe that the current political atmosphere justified violence.
- Demographically, the crowd at the Women’s March was significantly older than the Counter-Inaugural, but the two groups did not vary in white versus nonwhite respondents.
Next, the survey focused on how respondents framed their participation. Participants were asked why they attended their respective event. The researchers then coded these responses in terms of gender. For example, if the person said they were there to protest for reproductive rights their answer was considered gendered. If they responded that they protested on the premise of healthcare, it was coded as non-gendered. Results show that about 15 percent of the Counter-Inaugural and 35 percent of Women’s March attendees gave a gendered reason for attending their respective protest. Furthermore, people who had organizational attachments (i.e. involvement with Planned Parenthood) were far more likely to provide a gendered response at both events. This suggests evidence of the mesomobilization theory at each protest. Heaney asserts that people brought their cohorts to participate in politics based on the frame that a central group created.
The researchers also examined the group of people who attended both the Counter-Inaugural protest and the Women’s March. One would expect that people observed at the Counter-Inaugural, who planned on attending the Women’s March, would be more likely to provide a gendered reason for attending the Counter-Inaugural. Remarkably, this was not the case. However, people observed at the Women’s March who also attended the Counter-Inaugural very commonly provided a gendered reason. Could the event itself play a role in the protestor’s participation or even explicitly introduce a frame? Heaney plans to investigate this curious paradox.
Michael Heaney’s data from the Counter-Inaugural protest and Women’s March gives insight on the mesomobilization theory, along with demographic data on the protestors. He continues to work on connecting evidence from both movements then plans to compare it with other data from the 2016 Democratic and Republican National Conventions and a Right to Life protest.
For more, read Heaney’s working paper here: Partisanship and the Resurgence of Women’s Protest in the United States
Mar 17, 2017 | Current Events, Foreign Affairs, International
by Christopher Fariss and Kristine Eck

Christopher Fariss, University of Michigan and Kristine Eck, Uppsala University
Debate persists inside and outside of Sweden regarding the relationship between immigrants and crime in Sweden. But what can the data actually tell us? Shouldn’t it be able to identify the pattern between the number of crimes committed in Sweden and the proportion of those crimes committed by immigrants? The answer is complicated by the manner in which the information about crime is collected and catalogued. This is not just an issue for Sweden but any country interested in providing security to its citizens. Ultimately though, there is no information that supports the claim that Sweden is experiencing an “epidemic.”
In a recent piece in the Washington Post, we addressed some common misconceptions about what the Swedish crime data can and cannot tell us. However, questions about the data persist. These questions are varied but are related to two core issues: (1) what kind of data policy makers need to inform their decisions and (2) what claims can be supported by the existing data.
Who Commits the Most Crime?
Policymakers need accurate data and analytical strategies for using and understanding that data. This is because these tools form the basis for decision-making about crime and security.
When considering the reports about Swedish crime, certain demographic groups are unquestionably overrepresented. In Sweden, men, for example, are four times more likely than women to commit violent crimes. This statistical pattern however has not awoken the same type of media attention or political response as other demographic groups related to ethnicity or migrant status.
Secret Police Data: Conspiracy or Fact?
In the past, the Swedish government has collected data on ethnicity in its crime reports. The most recent of these data were analyzed by the Swedish National Council for Crime Prevention’s (BRÅ) for the period 1997-2001. The Swedish police no longer collect data on the ethnicity, religion, or race of either perpetrators or victims of crime. There are accusations that these data exist but are being withheld. Such ideas are not entirely unfounded: in the past, the Swedish police have kept secret—and illegal—registers, for example about abused women or individuals with Roma background. Accusations about a police conspiracy to suppress immigrant crime numbers tend to center around the existence of a supposedly secret criminal code used to track this data. This code is not secret and, when considered, reveals no evidence for a crime epidemic.
For the period of November 11, 2015 through January 21, 2016 the Swedish police attempted to gauge the scope of newly arrived refugees involvement in crime, as victims, perpetrators, or witnesses. It did so by introducing a new criminal code—291—into its database. Using this code, police officers could add to reports in which an asylum seeker was involved in an interaction leading to a police report. Approximately 1% of police reports filed during this period contained this code. It is important to note here that only a fraction of these police incident reports actually lead to criminal charges being filed.
The data from these reports are problematic because there are over 400 criminal codes in the police’s STORM database, which leads to miscoding or inconsistent coding. Coding errors occur because the police officers themselves are responsible for determining which codes to enter in the system. The police note that there was variation in how the instructions for using this code were interpreted. The data show that 60% of the 3,287 police reports filed took place at asylum-seeker accommodation facilities, and that the majority of the incidents contained in these reports took place between asylum seekers. Are these numbers evidence of a crime epidemic?
Is there any Evidence for Crime Epidemic in Sweden?
If asylum-seekers are particularly crime-prone, then we would expect to see crime rates in which they are overrepresented relative to how many are living in Sweden. Sweden hosted approximately 180,000 asylum-seekers during this period and the population of Sweden is approximately 10 million. Therefore, asylum-seekers make up approximately 1.8% of the people living in Sweden, while 1% of the police reports filed in STORM were attributed to asylum-seekers.
While the Code 291 data are problematic because of issues discussed above, the data actually suggests that asylum seekers appear to be committing crime in lower numbers than the general population and does not provide support for claims of excessive criminal culpability. There were four rapes registered with code 291 for the 2.5 month period, which we find difficult to interpret as indicative of a “surge” in refugee rape. We in no way want to minimize the impact that these incidents had on the individual victims, but considering wider patterns, we consider a rate of four reports of rape over 76 days for a asylum-seeking population of 180,000 as not convincing evidence of an “epidemic” perpetrated by its members.
There is no doubt that crime occurs in Sweden. This is a problem for Swedish society and an important challenge for the government to address. It is a problem shared by all other countries. There is also no doubt that refugees and immigrants have committed crimes in Sweden, just as there is no doubt that Swedish-born citizens have committed crimes in Sweden as well. But if policy initiatives are to focus on particular demographic groups who are overrepresented in crime statistics, then it is essential that the analysis of the crimes committed by members of these groups be based on careful data analysis rather than anecdotes used for supporting political causes.
The Government of Sweden’s Facts about Migration and Crime in Sweden: http://www.government.se/articles/2017/02/facts-about-migration-and-crime-in-sweden/
Christopher Fariss is an Assistant Professor of Political Science and Faculty Associate at the Center for Political Studies at the University of Michigan. Kristine Eck is Associate Professor at the Department of Peace and Conflict Research at Uppsala University.
Sep 1, 2016 | APSA, Conflict, Current Events, Foreign Affairs, International
Post developed by Catherine Allen-West in coordination with Michael Robbins.
ICYMI (In Case You Missed It), the following work was presented at the 2016 Annual Meeting of the American Political Science Association (APSA). The presentation, titled “Passive Support for the Islamic State: Evidence from a Survey Experiment” was a part of the session “Survey and Laboratory Experiments in the Middle East and North Africa” on Thursday, September 1, 2016.
On Thursday morning at APSA 2016, Michael Robbins, Amaney Jamal and Mark Tessler presented work which explores levels of support for the Islamic State among Arabs, using new data from the Arab Barometer. The slide set used in their presentation can be viewed here: slides from Robbins/Jamal/Tessler presentation
Their results show that among the five Arab countries studied (Jordan, Morocco, Tunisia, Palestine and Algeria) there is very little support for the tactics used by Islamic State.
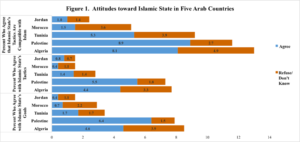
Furthermore, even among Islamic State’s key demographic – younger, less-educated males – support remains low.
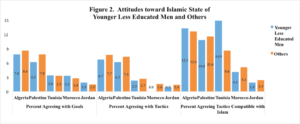
For a more elaborate discussion of this work and the above figures, please see their recent post in the Washington Post’s Monkey Cage blog, “What do ordinary citizens in the Arab world really think about the Islamic State?”
Mark Tessler is the Samuel J. Eldersveld Collegiate Professor of Political Science at the University of Michigan. Michael Robbins is the director of the Arab Barometer. Amaney A. Jamal is the Edwards S. Sanford Professor of Politics at Princeton University and director of the Mamdouha S. Bobst Center for Peace and Justice.
Nov 3, 2015 | Conflict, Current Events, International, Uncategorized
Post developed by Yioryos Nardis in coordination with Yuri Zhukov.
In March and April 2014, angry mobs and armed men stormed administrative buildings and police stations in eastern Ukraine. Waving Russian flags and condemning the post-revolutionary government in Kyiv as an illegal junta, the rebels proclaimed the establishment of ‘Peoples’ Republics’ of Donetsk and Luhansk, and organized a referendum on independence. Despite initial fears that the uprising might spread to other provinces, the rebellion remained surprisingly contained. While 61% of municipalities in Donetsk and Luhansk fell under rebel control during the first year of the conflict, just 20% experienced any rebel violence. What explains these local differences in rebellion across eastern Ukraine? Why have some towns remained under government control while others slipped away? Why might two municipalities in the same region experience different levels of separatist activity?

Yuri Zhukov
The latest research by Yuri Zhukov, faculty member in the Center for Political Studies and Assistant Professor of Political Science, uses new micro-level data on violence and economic activity in eastern Ukraine to examine these questions. In the paper “Trading hard hats for combat helmets: The economics of rebellion in eastern Ukraine” (forthcoming in the Journal of Comparative Economics) Zhukov evaluates two prominent explanations on the causes and dynamics of civil conflict in eastern Ukraine: ethnicity and economics.
Identity-based explanations expect conflict to be more likely and more intense in areas where ethnic groups are geographically concentrated. According to this view, the geographic concentration of an ethnolinguistic minority – in this case, Russians or Russian speaking Ukrainians – helps local rebels overcome collective action problems, while attracting an influx of fighters, weapons and economic aid from co-ethnics in neighboring states.
According to economic explanations, as real income from less risky legal activities declines relative to income from rebellious behavior, participation in the rebellion is expected to rise. This framework maintains that violence should be most pervasive in areas potentially harmed by trade openness with the EU, austerity and trade barriers with Russia.
Zhukov finds that local economic factors are much stronger predictors of rebel violence and territorial control than Russian ethnicity or language. Pro-Russian rebels in Ukraine are “pro-Russian” not because they speak Russian, but because their economic livelihood depends on trade with Russia.
The study uses new micro-level data on violence, ethnicity and economic activity in the Donbas region of eastern Ukraine, to understand how these two explanations are related to rebel violence and territorial control. The spatial units are 3037 municipalities (i.e. cities, towns, villages) in Donetsk and Luhansk provinces. For each municipality, Zhukov estimated the proportion of the local labor force employed in three industries: machine-building (which is heavily dependent on exports to Russia), metals (less dependent on Russia, and a potential beneficiary of increased trade with the European Union), and mining (vulnerable to International Monetary Fund-imposed austerity and cuts in state-subsidies). He also calculated the proportion of Russian speakers in each locality.
Rebel violence data are based on human-assisted machine coding of incident reports from multiple sources, including Ukrainian and Russian news agencies, government and rebel press releases, daily ‘conflict maps’ released by both sides, and social media news feeds. This yielded 10,567 unique violent events in the Donbas, at the municipality level, recorded between the departure of President Viktor Yanukovych in February 2014 and the second Minsk ceasefire agreement of February 2015. To determine territorial control, particularly whether a populated place was under rebel or government control on a given day, Zhukov used three sources: official daily situation maps publicly released by Ukraine’s National Security and Defense Council (RNBO), daily maps assembled by the pro-rebel bloggers ‘dragon_first_1’ and ‘kot_ivanov’, and Facebook posts on rebel checkpoint location.
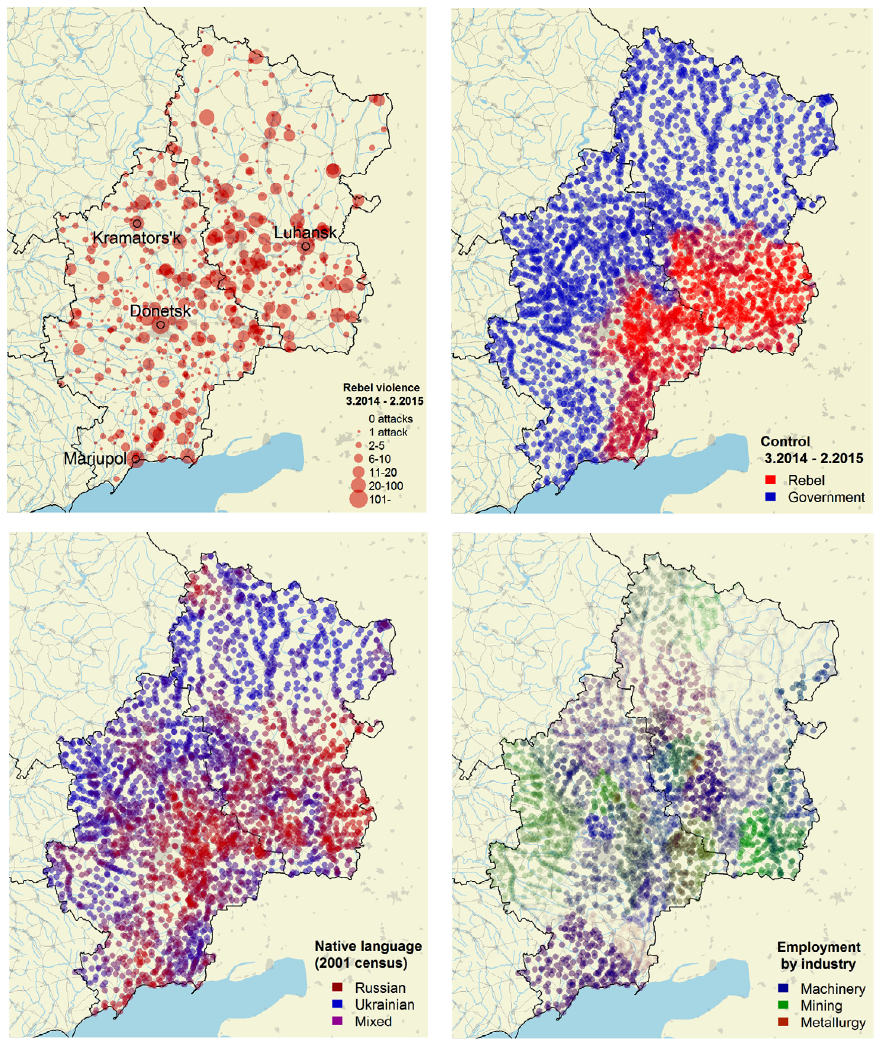 To evaluate the relative explanatory power of ethnic and economic explanations of violence in the Donbas, the study uses Bayesian Model Averaging. It finds that a municipality’s prewar employment mix is a better predictor of rebel activity than local ethnolinguistic composition. Municipalities more exposed to trade shocks with Russia experienced a higher intensity of rebel violence throughout the conflict. Municipalities where machine-building represented a small share of local employment (2%, the lowest in the data) were 38% less likely to experience violence than municipalities where the industry was more dominant — and the local population more vulnerable to trade disruptions with Russia. Such localities also fell under rebel control earlier – and took longer for the government to liberate – than municipalities where the labor force was less dependent on exports to Russia. On any given day, a municipality with higher-than-average employment in the beleaguered machine-building industry (26%) was about twice as likely to fall under rebel control as a municipality with below-average employment in the industry (4%).
By contrast, ethnicity and language had no discernible impact on rebel violence. Municipalities with large Russian-speaking populations were more likely to fall under rebel control, but only where economic dependence on Russia was relatively low. In other words, ethnicity only had an effect where economic incentives for rebellion were weak.
The seemingly rational economic self-interest at the heart of the conflict stands in sharp contrast with the staggering costs of war. In the twelve months since armed men began storming government buildings in the Donbas, over 6000 people have lost their lives, and over a million have been displaced. Regional industrial production fell by 49.9% in 2014, with machinery exports to Russia down by 82%.Suffering heavy damage from shelling, many factories have closed. With airports destroyed, railroad links severed and roads heavily mined, a previously export-oriented economy has found itself isolated from the outside world.
References:
2001 Ukrainian Census (State Committee on Statistics of Ukraine, 2001).
Bureau van Dijk’s Orbis database (Bureau van Dijk Electronic Publishing, 2015).
Segodnya, 2015. Ekonomika donetskoy oblasti v upadke iz-za voyny – gubernator kikhtenko. [Donetsk region’s economy in stagnation because of the war – Governor Kikhtenko]. Segodnya.
Stasenko, M., 2014. Novaya ekonomika ukrainy budet stroit’sya bez rossii i donbassa [Ukraine’s new economy will be built without Russia or the Donbas]. Delo.ua.
Feb 5, 2015 | Current Events
Post developed by Katie Brown and Stuart Soroka.
 News content is dominated by negativity. Does this have negative consequences for political attitudes, or interest, or policymaking? Professor of Communication Studies and Center for Political Studies (CPS) researcher Stuart Soroka considers these questions in his book Negativity in Democratic Politics.
Drawing on a combination of survey data, lab experiments, and large-scale content analyses, Soroka finds strong evidence for both the predominance of negative information in political news, and the increased impact this negative information has on public attitudes (in contrast with positive information). He finds, for instance, that negative information has a stronger impact than positive information on individuals’ assessments of political candidates. He finds that individuals are more physiologically activated by negative news. At the aggregate level, Soroka also finds that negative magazine covers sell more copies than positive versions; and that negative shifts in the economy have a bigger impact on public opinion than do positive shifts. Interestingly, this holds true across many different countries, as Soroka’s analyses include most OECD countries. Negativity biases are not just an American peculiarity, then – they are evident around the world.
What are the consequences of all this negativity? Soroka suggests that a negativity bias may well be an efficient way of dealing with very complex information environments. There is just too much information about politics for us to keep track of it all, and selecting information based on negativity might be one useful way of focusing on the information that matters most. As a consequence, humans focus on negative information; and we seem to have designed institutions that focus on the negative as well. That said, there may be long-term consequences of a political information environment that is predominantly negative. So while assessing the long-term impact of negativity is difficult, it is probably an important step in both understanding political behavior and in developing objectives for the design of mass media and political institutions.
.jpg)
_03.jpg)