How do voters make sense of the information they hear about candidates in the news and through social media? This question was at the heart of a collaboration between researchers at the University of Michigan, Georgetown University, and Gallup to study political communication that took place during the 2016 U.S. presidential election.
Mike Traugott, Ceren Budak, Lisa O. Singh, and Jonathan Ladd presented findings from the study at the Michigan Institute for Data Science (MIDAS) Seminar on November 14, 2019. The panel discussion, moderated by Rayid Ghani, covered results that will be published in a new book, Words That Matter, in May 2020.
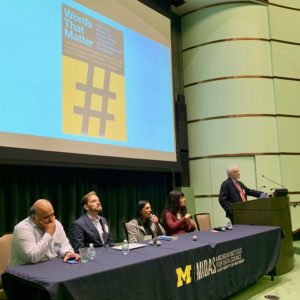
Rayid Ghani, Jonathan Lass, Lisa O. Singh, Ceren Budak, and Mike Traugott at the MIDAS symposium.
Genesis of the project
The project began when Gallup contacted Mike Traugott, a scholar of political communication who works in the area of attention to media using survey methods. In the four months leading up to the 2016 presidential election, Gallup conducted 500 interviews per day, asking respondents whether they had heard, read, or seen anything in the last few days about each of the two major-party candidates. In addition, the research team analyzed a sample of tweets from the public and from journalists. Finally, they compiled a database of news articles about the election, and also conducted an analysis of fake news.
Data visualizations were an important part of this work, said Traugott. As data was gathered and interpreted, the researchers created visualizations and analyses that were published on the Gallup website and in The Washington Post and other news outlets. Excellent graphics were essential to show complex data in an easily interpretable way.
Interdisciplinary strengths
Researching political communication using big data and data from multiple sources was an exciting challenge for the members of the team. When survey respondents are asked to recall what they’ve heard, read, or seen, there is the potential for error stemming from everything from memory problems to social desirability bias. Working with an interdisciplinary team was an opportunity to use new methods to analyze big data and mitigate such errors.
Closed-ended survey questions can be difficult to interpret; researchers sometimes try to find out what people actually mean by asking open-ended follow-ups. The surveys in this study only collected open-ended responses, allowing respondents to give more meaningful answers. With such a large sample of open-ended responses about what people remembered about the candidates, it was essential to find innovative ways to analyze the data.
Lisa Singh and Ceren Budak, both computer scientists, contributed expertise in computational social science and experience working with social media data. A variety of techniques were used in the analyses contained in the book: frequent word analysis, topic analysis, network analysis, sentiment analysis, and more. The open-ended text from the survey responses was so noisy and short that the algorithms were not enough to interpret the results. It took a team effort to interpret the data through a semi-automated process. The team at Gallup and the political scientists sorted words into topics and created synonym dictionaries to clean the data and remove inconsistencies. Developing these tools to be applied in domains where the text is not as rich and complete will be a focus of future work.
A long-lived narrative is worth more than many explosive stories
Ladd noted that by analyzing text data – tweets and open-ended survey responses – the research team found that people repeatedly remembered Hillary Clinton’s emails throughout the campaign. The fact that this one story dominated the narrative about Clinton seemed to have an effect on voters, and Ladd points out that Clinton echoed this finding in her book, What Happened, employing one of the project’s graphics in the text. On the other hand, people remembered many different news stories about Donald Trump over time. These stories appeared and disappeared quickly, and no one story made a big impression on respondents.
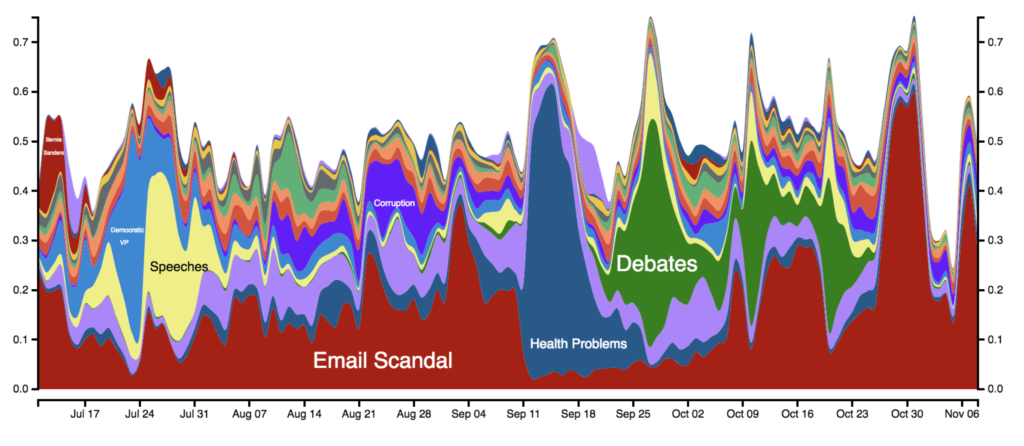
This figure highlights the changing topics that Americans remember about Clinton since July. The x-axis shows the date and the y-axis the fraction of responses that fall into a particular topic.
Another major finding of the study is that there were differences between the news that survey respondents recalled hearing and the text analysis of media articles, and both of those were different from what journalists were tweeting about. By analyzing streams of data from multiple sources, the researchers were able to conclude that journalists’ tweets and the text of newspaper articles did not favor either candidate.
Singh noted that Trump was masterful in keeping the issue of Clinton’s emails central to the campaign narrative. When the researchers analyzed new articles and tweets from journalists, email was not a dominant topic, as it was in the survey responses. She said that it was the Trump campaign that kept the narrative about the emails in the public’s awareness.
Connecting media coverage and voting behavior
Members of the research team who were not available to participate in the panel discussion contributed further analyses to the book. Stuart Soroka conducted a sentiment analysis of the open-ended responses, and Josh Pasek did work on story life and length of time an item was in the news. One limitation of this study was that Gallup did not collect any direct measure of voter preference, although they did collect favorability ratings of the candidates every day, which gave the researchers an indirect measure to work with. There was a lagged relationship between the net sentiment of Trump and Clinton in the news and the relative favorability of the two candidates.
We can’t know how fake news influenced votes, said Budak, who analyzed social media data in the 2016 election cycle. In a chapter on fake news in Words That Matter, she examined Clinton’s net favorability and found a strong relationship between fake news and her favorability rating. Specifically, Budak found that Clinton’s favorability would move first, and fake news responded to that. The creators of fake news were attuned to what was happening in the campaign and responded accordingly.
When Budak analyzed retained information data according to political leanings, she found that Republicans retained fake news coverage about Clinton, but not for Trump. The conversation about Trump changed a lot over time, while the narrative about Clinton stayed focused on her emails. According to Budak, “we can’t say fake news caused the outcome of the election, but it shaped the agenda.”