As a country grows and develops economically, most experts expect political behavior to develop as well, becoming more policy-oriented and programmatic and moving away from clientelism that characterizes less developed countries. However, this has not been the case in Ghana. In his new book, Electoral Politics and Africa’s Urban Transition, Noah Nathan traces the unexpected political patterns that are emerging in urban Ghana. Despite a growing middle class and increasing ethnic diversity, clientelism and ethnic voting persist in many urban neighborhoods.
Nathan focuses his research on Accra, Ghana, a diverse and growing metropolis of four million people. Not only is the population of the city growing, but it is becoming wealthier and better educated: data show that the middle class in Accra has tripled in size since Ghana democratized in 1992. The trend toward urbanization has also led to more diversity and contact between members of different ethnic groups in the city. Experts usually expect that higher incomes and levels of education will shift voter preferences away from politicians offering patronage and toward more policy-oriented candidates.
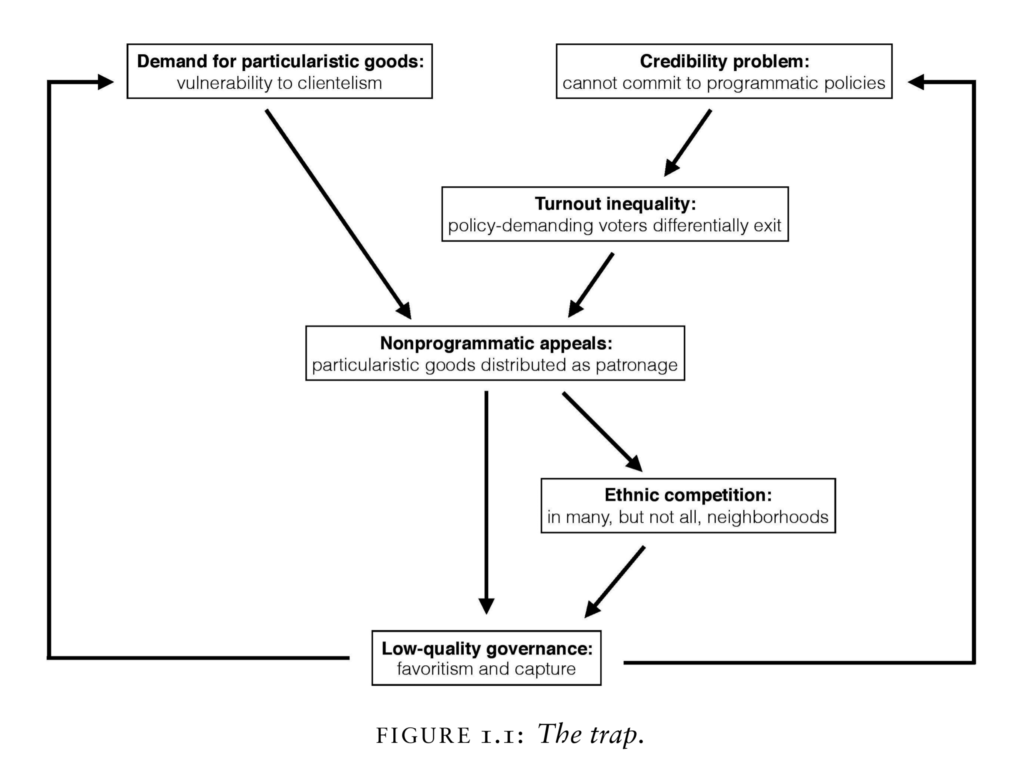
Political practices in Ghana have not transitioned as rapidly as the demographics have. Instead, Nathan shows, Ghanaian politics have become stuck in a trap. The trap is a cycle wherein voters expect goods and favors, which politicians deliver in the form of patronage. As a result, the government performs poorly and elected officials are seen as less credible. Policy-oriented citizens are left without programmatic candidates, and become more likely to decide to opt out of voting entirely. With those voters increasingly out of play, politicians face strong incentives to continue engaging in clientelism, sometimes creating ethnic competition.
Nathan, Noah L. Electoral Politics and Africa’s Urban Transition: Class and Ethnicity in Ghana. Cambridge University Press, 2019.
The key to understanding the political trap of clientelism is the neighborhood-level variations within cities. Voters with similar levels of wealth and education do not all vote alike across the city; voting behaviors differ greatly by neighborhood. Voters in poorer neighborhoods still expect favors from politicians, who respond accordingly. Taking this into account, many middle-class voters, those who are most likely to support a programmatic transition, opt out of voting because they view politicians engaging in patronage as lacking credibility.
Certain features of developing cities give further context to explain politicians’ and voters’ incentives. Developing countries have lower capacity to provide services and infrastructure to their citizens as a whole. The rapid pace of growth creates a scarcity of resources to go around. Without the credibility to promise broad improvements, politicians rely instead on promises to select groups. Cities tend to be comprised of neighborhoods that differ widely in their wealth and diversity, often within the same electoral district. Understanding these realities help explain why clientelism prevails, even as the electorate becomes wealthier, better-educated, and more diverse.
Nathan concludes his analysis of the political patterns in Ghana by drawing parallels with political systems seen in the United States in the late 19th and early 20th century, as well as in Latin American cities. In these cases the shift to more programmatic politics occurred politicians could no longer distribute government resources selectively. The rise of civil service reforms and broad social welfare programs supported the shift to policy-oriented systems. These parallels to similar transitions over time and in other developing countries may point the way to more policy-oriented political systems in the future.
Elections experts Ken Goldstein, Walter Mebane, and Vincent Hutchings analyzed the results and key lessons of the 2018 Midterm Elections at a round table discussion hosted by the Center for Political Studies on November 13, 2018. A recording of the event is available below.
Ken Goldstein, Professor of Politics at the University of San Francisco
Ken Goldstein began his presentation by noting that there are still races that do not have a clear winner a week after the election, including the Senate and Governor’s races in Florida and the Governor’s race in Georgia.
Leading up to the Midterm Elections, some observers anticipated big wins for the Democratic Party. Goldstein observed that while there was a general lack of exuberance on the part of Democrats on election night, further reflection reveals that there were meaningful shifts in this election. Although the “blue wave” of Democratic wins didn’t materialize, the number of congressional seats changing away from the President’s party was of similar magnitude to past midterm elections.
Goldstein drew attention to the behavior of independent voters. Exit poll data show that independents favored Republican candidates for the House of Representatives in the past two midterm elections, as well as the 2016 General Election. In contrast, independent voters were more likely to vote for Democratic House candidates in 2018 by a margin of 12 percentage points.
Were the polls leading up to the election predictive of the actual outcome? Goldstein said they were fairly accurate, but reminded the audience that many congressional seats were not in play in this election. There are few high-quality state-level polls, which makes forecasting less accurate. More probability-based surveys that weight responses for education and race of the respondent would improve the accuracy of predictions.
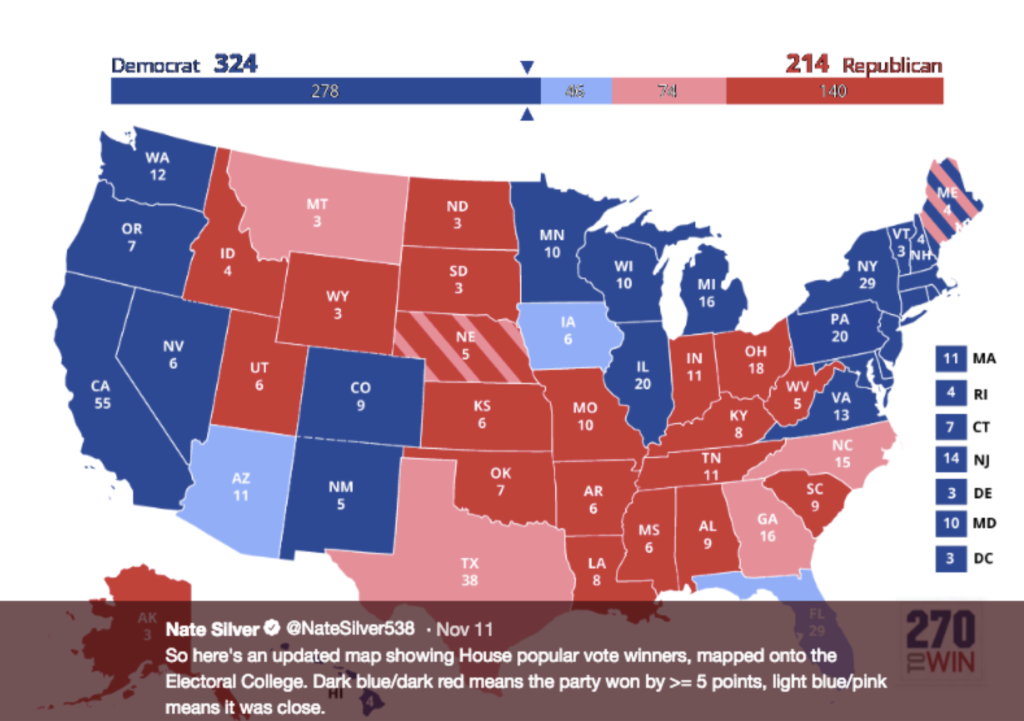
Looking at the big picture trends, Goldstein observed that there was a substantial increase in the number of women running for office and winning, as well as large increases in non-white voters. He shared a map showing what the results of the presidential election would look if votes followed the same partisan break-down as the 2018 midterms. However, Goldstein cautioned that presidential campaigns are very different from congressional campaigns, and that a presidential candidate running a nation-wide campaign will face challenges in changing districts, especially in the Midwest.
Walter Mebane, Professor of Political Science and Statistics at the University of Michigan
Next, Walter Mebane presented analyses he has conducted using election forensics. Mebane coined the term “election forensics” to describe a set of statistical methods he developed to determine whether the results of an election accurately reflect the intentions of the electors.
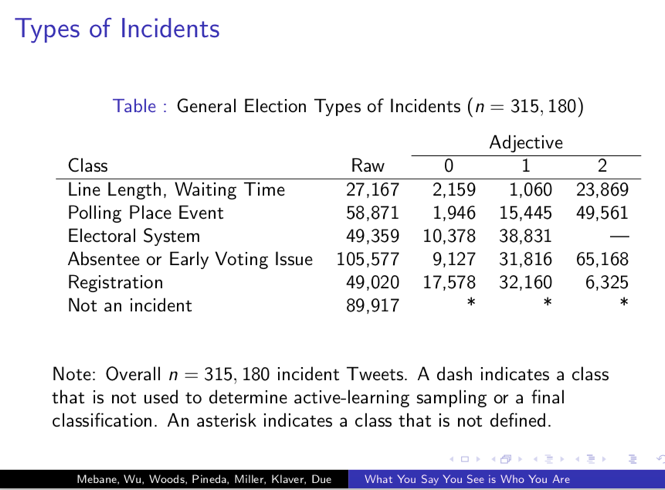
Using Twitter data from the 2016 General Election Mebane analyzed reports of election incidents, including wait times and problems with voting. During the 2016 General Election people used Twitter to report different kinds of election incidents depending on their partisan affiliation. These incidents tended to be reported in replies to people with similar partisan affiliations.
Mebane discovered that there are partisan differences in the types of incidents that Twitter users shared during the 2016 General Election. For example, Republicans were less likely to report a long line to vote, but more likely to report registration problems. A significant conclusion from this finding is that such observational biases and communication silos suggest partisans tended to form different impressions of how the 2016 election went, supported by the divergent reported experiences. These patterns will probably continue in 2018, according to Mebane.
Vincent Hutchings, Professor of Political Science at the University of Michigan
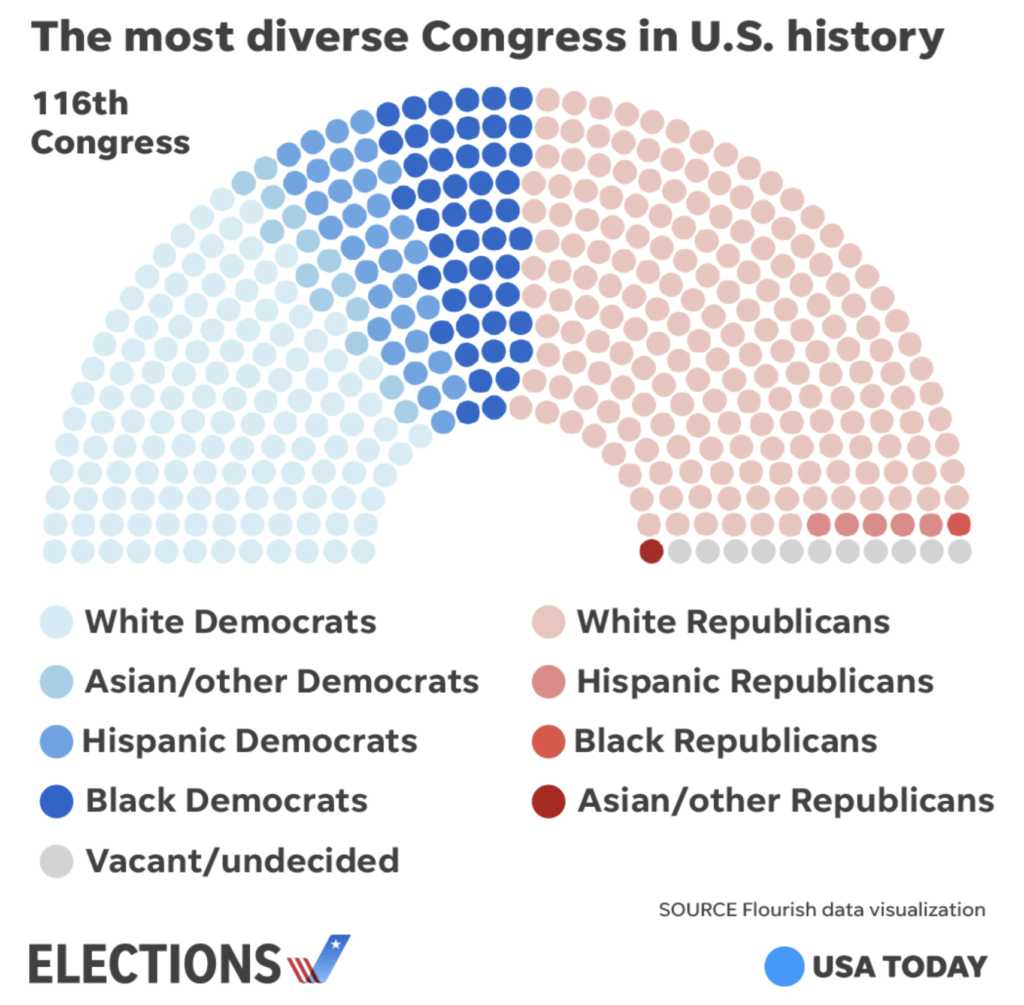
Vincent Hutchings analyzed the shifting demographics of the American electorate. Hutchings presented data showing that Democratic voters have become more racially diverse in the past 20 years, while Republican voters have remained predominately white. Similarly, the Congress elected in 2018 is the most diverse in the history of the United States, but the increase in diversity has been primarily among Democrats elected to Congress.
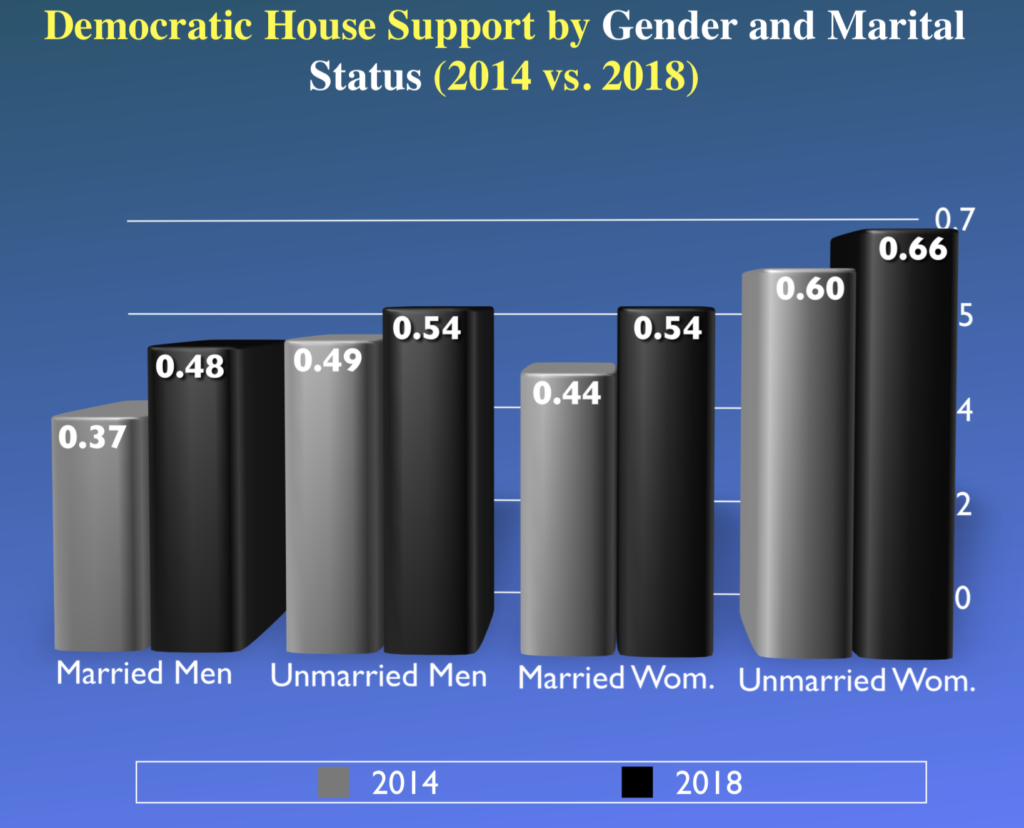
Reviewing voting data by race, gender, age, marital status, and education, Hutchings notes that each demographic group voted for Democrats at a higher rate than they did in the 2014 Midterm Elections. However, the magnitude of change was different for each group.
Some elections experts wondered whether women would vote for Democrats at higher rates in 2018 in response to the #MeToo movement, the contentious confirmation of Justice Kavanaugh, and controversial remarks about women made by President Trump. Hutchings showed that, among white voters, men and women both shifted toward Democratic candidates, but the gender gap didn’t change. Married men and married women both moved toward the Democratic Party House candidates at roughly equal rates in 2018 compared to 2014. No matter how Hutchings examined gender, he found no evidence that white women behaved differently than comparable men, relative to their preferences four years ago.
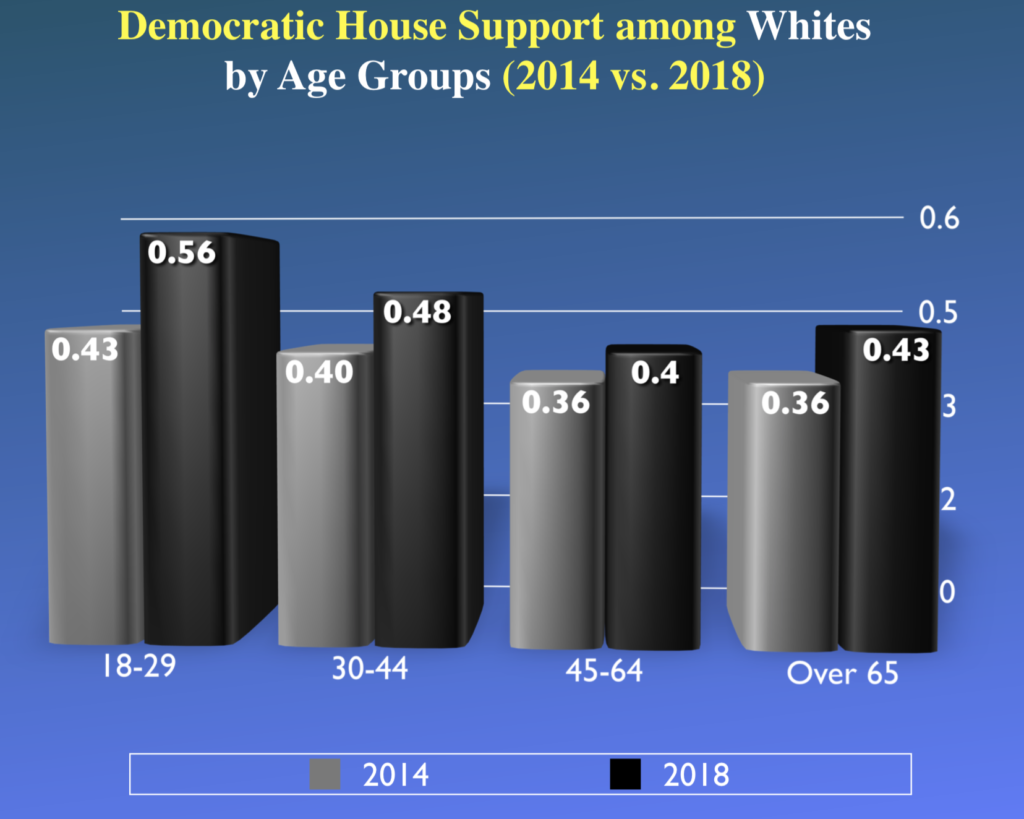
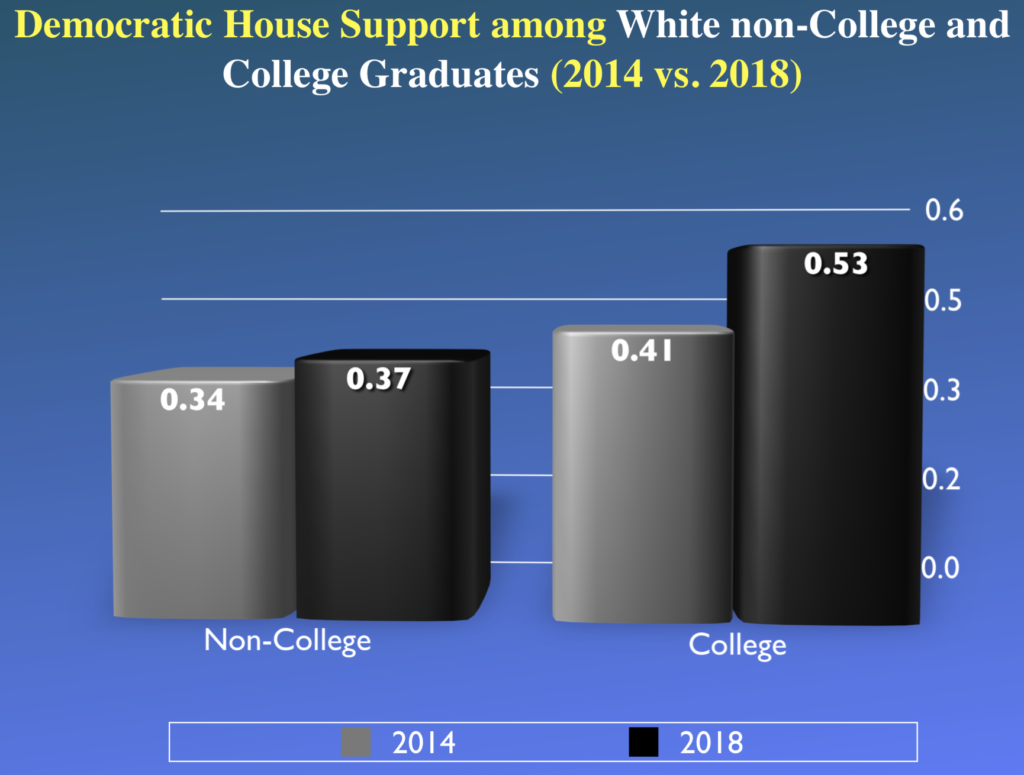
Similarly, Hutchings observed meaningful trends related to generation and education. Voters under 30 years old voted for Democrats at a higher rate than voters under 30 in 2014. Democrats also increased gains among college-educated white voters compared to the 2014 Midterm Elections. Hutchings concluded that, while media may focus on gender differences between Democratic and Republican voters, more important differences are emerging along generational and educational lines, and these are trends to watch
By Nicholas Valentino, James Newburg and Fabian Neuner
ICYMI (In Case You Missed It), the following work was presented at the 2018 Annual Meeting of the American Political Science Association (APSA). The presentation, titled “Dog Whistles to Bullhorns: Racial Rhetoric in Presidential Campaigns, 1984-2016” was a part of the session “Framing Politics: The Importance of Tone and Racial Rhetoric for Framing Effects” on Friday, August 31, 2018.
Political candidates’ use of coded language to express controversial attitudes on race is nothing new – but is it more common than in the past? Nicholas Valentino, James Newburg, and Fabian Neuner analyzed data from 1984 to the present that showed campaign rhetoric in 2016 included more racial rhetoric, negative racial group outreach, and negative mentions of racial groups than any other campaign they studied.
Beginning in 1968 through the late 1990s, the expression of explicitly racist attitudes seemed to be in decline, although racially charged imagery was still used in the news and media. While the rhetoric became subtler, prejudicial attitudes were still expressed through “racially coded” language. Over time, issues like crime, welfare, and immigration evoked negative racial stereotypes that could impact political choices without explicitly mentioning race.
The shift to less directly rhetoric is important because implicit references to race and racial stereotypes may have a greater impact on perceptions than explicit ones do. The authors of this study note that previous research shows that people may dismiss obvious appeals to racial bias, while actually being influenced by more subtle or coded language. They note that the strength of this effect is uncertain, and that recent studies show respondents more likely to accept explicit racial rhetoric.
After Barack Obama’s election in 2008, racially charged discourse became more explicit, shocking some Americans. It was impossible not to notice the change in the tone of racial language in the election of 2016. But when exactly did this shift occur? Did it happen gradually or all at once?
To answer these questions, the authors examine trends in racial rhetoric reported in the news between 1984 and 2016. They set out a hypothesis: If changes in rhetoric happened more gradually over time as a result of partisan realignment, they should see trends in the use of explicit racial rhetoric that predate the 2016 campaign, and perhaps even prior to 2008. If, on the other hand, the 2016 election and the candidacy of Donald Trump is the major cause of shifts in discussions of race and ethnicity in mainstream American politics, they would expect explicit group mentions, especially hostile ones, to spike in 2016.
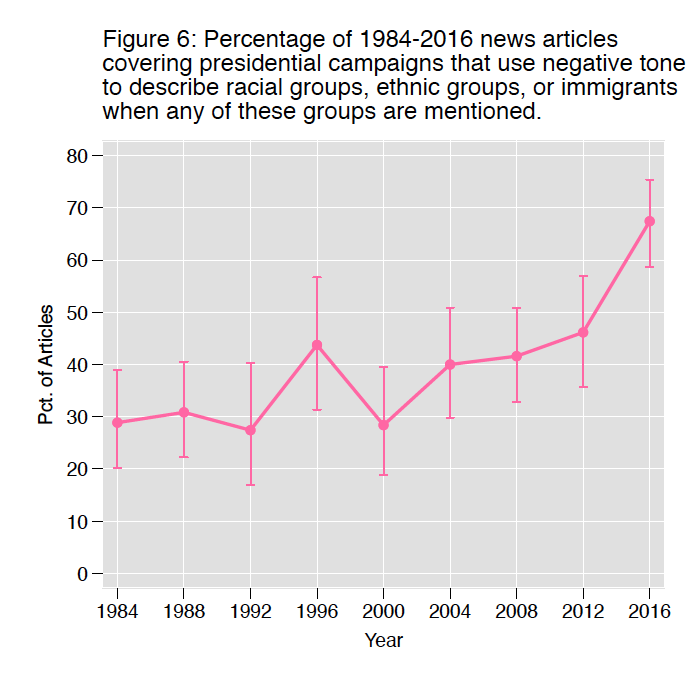
The researchers conducted a rigorous analysis of thousands of articles published in the New York Times and Washington Post between September 1 and Election Day during every presidential election year from 1984 to 2016. They found that while mentions of race were high throughout the study period, racial rhetoric spiked in 2016, especially with regard to immigrants and immigration.
Significant moments of presidential campaigns track with the rise and fall of explicit mentions of race in the news. As Republicans made electoral gains among Southern Whites, racial language reached a peak; during the more moderate campaigns of Bill Clinton and George W. Bush, racial language declined. Race became more prominent with the historic election of Barack Obama in 2008, but declined when Obama avoided discussions of race during his reelection campaign. The authors find that 2016 was unique in the high number of explicitly negative racial statements, but that partisan realignment had been causing this change had also been driving up the acceptability of these types of messages over several years.
They found that while the total amount of group coverage did not rise sharply until 2016, the coverage that was dedicated to groups got more negative gradually over time. Notably, an important factor in the secular increase of racial rhetoric was negative language describing Arab Americans, Latinos, and Immigrants in recent years. As American demographics continue to change and non-white groups grow in numbers and political strength, these trends in political language will grow even more significant.
“Gerrymandering”— when legislative maps are drawn to the advantage of one party over the other during redistricting—received its name in 1812, when Massachusetts Governor Elbridge Gerry signed off on a misshapen district that was said to resemble a salamander, which a newspaper dubbed a “gerrymander.”
But although the idea of gerrymandering has been around for a while, proving that a state’s legislature has deliberately skewed district lines to benefit one political party remains challenging.
The problem is that the mere presence of partisan bias in a district map tells us very little about the intentions of those drawing the districts. Factors such as racial segregation, housing and labor markets, and transportation infrastructure can lead to areas where one party’s supporters are more geographically clustered than those of the other party. When this happens, the party with a more concentrated support base achieves a smaller seat share because it racks up large numbers of “surplus” votes in the districts it wins, while falling just short of the winning threshold in many of the districts it loses.
Further, there are many benign reasons that legislatures may seek to redistrict voters—for example, to keep communities of interest together and facilitate the representation of minorities—that may have the unintended consequence of adding a partisan spin to the map.
The research of political scientists Jowei Chen and Jonathan Rodden is helping to differentiate cases of deliberate partisan gerrymandering from other redistricting efforts. Chen, Faculty Associate at the University of Michigan’s Center for Political Studies, and Rodden, Professor of Political Science at Stanford University, have devised a computer algorithm that ignores all partisan and racial considerations when drawing districts, and instead creates thousands of alternative district maps based on traditional districting goals, such as equalizing population, maximizing geographic compactness, and preserving county and municipal boundaries. These simulated maps are then compared against the district map that has been called into question to assess whether partisan goals motivated the legislature to deviate from traditional districting criteria.
We first wrote about Chen and Rodden’s work back in December 2016, detailing a 2015 paper in the Election Law Journal, which used the controversial 2012 Florida Congressional map to show how their approach can demonstrate and unconstitutional partisan gerrymander. Now, this work is back in the spotlight: Chen’s latest research has been cited in several cases of alleged gerrymandering that are currently working through the courts in Pennsylvania, North Carolina, Wisconsin and Maryland.
In January, Chen’s testimony as an expert witness was cited when the Pennsylvania Supreme Court threw out the state’s U.S. House of Representatives district map. In its opinion, the court said the Pennsylvania map unconstitutionally put partisan interests above other line-drawing criteria, such as eliminating municipal and county divisions.
The Pennsylvania districts in question were drawn by the Republican-controlled General Assembly in 2011. Immediately, the shape of the districts was an indicator that at least one traditional criterion of districting—compactness—had been overlooked.
Though few states define exactly what compactness means, it is generally taken to mean that all the voters within a district should live near one another, and that the boundaries of the district should be create a regular shape, rather than the sprawling polygon with donut holes or tentacles that characterized the Pennsylvania district map.
In particular, District 7—said to resemble Goofy kicking Donald Duck—had been called into question. “It is difficult to imagine how a district as roschachian and sprawling, which is contiguous in two locations only by virtue of a medical facility and a seafood/steakhouse, respectively, might plausibly be referred to as compact,” the court wrote.
Although there are more registered Democrats than Republicans in Pennsylvania, Democrats hold only five of the state’s 18 congressional districts. In the 2016 election, Democrats won each of their five House seats with an average of 75 percent of the vote while Republicans’ margin of victory was an average of 62 percent across their 13 districts. This is an indicator of “packing,” a gerrymandering practice that concentrates like-minded voters into as few districts as possible to deny them representation across districts.
Chen’s expert report assessed the district map and carried out simulations to generate alternative districting plans that strictly followed non-partisan, traditional districting criteria, and then measured the extent to which the current district map deviates from these simulated plans.
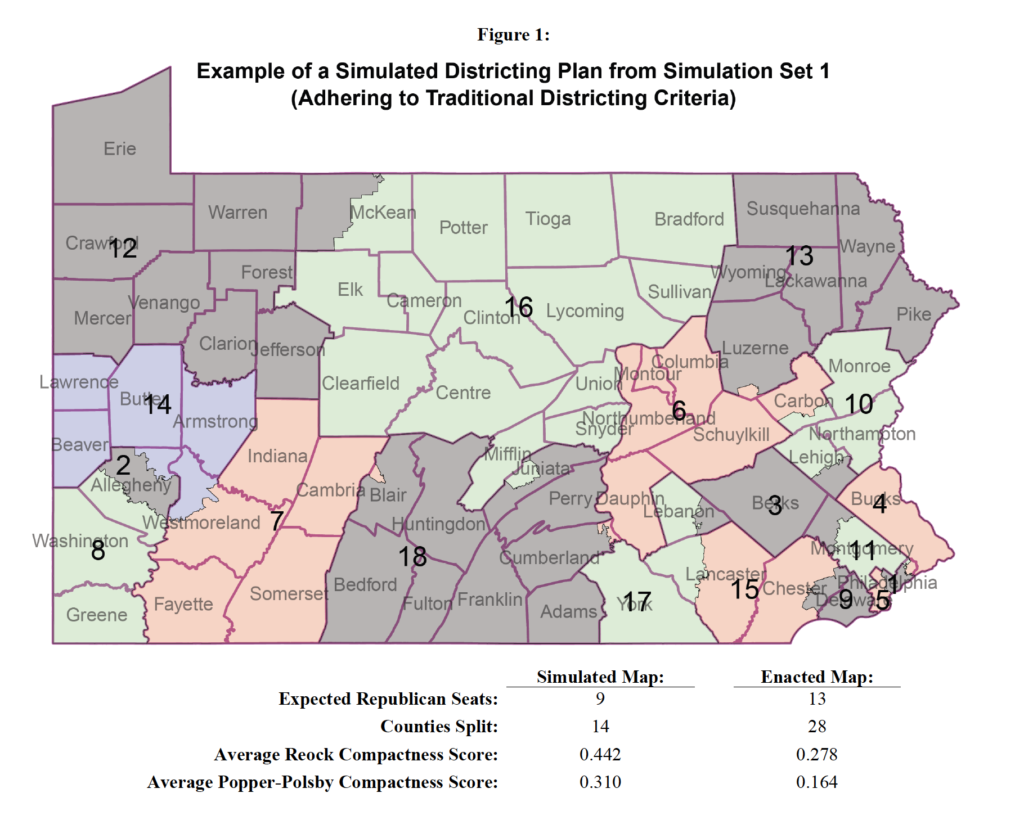
To measure the partisanship of the computer-simulated plans, Chen overlaid actual Pennsylvania election results from the past ten years onto the simulated districts, and calculated the number of districts that would have been won by Democrats and Republicans under each plan (see Figure 1).
The districting simulation process used precisely the same Census geographies and population data that the General Assembly used in creating congressional districts. In this way, the simulations were able to account for any geographical clustering of voters; if the population patterns of Pennsylvania voters naturally favor one party over the other, the simulated plans would capture that inherent bias.
Generally, the simulations created seven to ten Republican districts; not one of the 500 simulated districting plans created 13 Republican districts, as exists under the Republican-drawn district map. Thus, the map represented an extreme statistical outlier, a strong indication that the enacted plan was drawn with an overriding partisan intent to favor that political party. This led Chen to conclude “with overwhelmingly high statistical certainty that the enacted plan created a pro-Republican partisan outcome that would never have been possible under a districting process adhering to non-partisan traditional criteria.”
This table compares the simulated plans to the 2011 Pennsylvania district map with respect to these various districting criteria.
Following its ruling, on February 20 the Pennsylvania Supreme Court released a new congressional district map that has been described in a Washington Post analysis as “much more compact”. In response, the state’s Republican leadership announced plans to challenge the new map in court.
Election forensics is the field devoted to using statistical methods to determine whether the results of an election accurately reflect the intentions of the electors. Problems in elections that are not due to fraud may stem from legal or administrative decisions. Some examples of concerns that may distort turnout or vote choice data are long wait times, crowded polling place conditions, bad ballot design and location of polling stations relative to population.
A key component of democratic elections is the actual, and perceived, legitimacy of the process. Individuals’ observations about how elections proceed can provide valuable, on-the-ground insight into any flaws in the administration of the election. In some countries there are robust systems for recording citizen complaints, but not in the United States. So, a team* of University of Michigan researchers led by Walter Mebane used Twitter to extract observations of election incidents by individuals across the United States throughout the 2016 election, including primaries, caucuses and the general election. Through their observations, the team shows how reported phenomena like waiting in long lines or having difficulties actually casting a vote are associated with state-level election procedures and demographic variables.
The information gathered is the beginnings of what Mebane is calling the “Twitter Election Observatory.” The researchers collected tweets falling within a ten-day window around each primary/caucus election day and collected tweets continually during the October 1- November 9, 2016 lead up to the general election.
Mebane and his team then coded all of the tweets to extract the “incident observations” — tweets that mentioned an issue or complaint that an individual may have experienced when casting their vote. From the Twitter data, the researchers found that incidents occurred in every state during the general election period. Among the tweets that had recorded location information, the highest count of tweet observations occurred in California, Texas, Florida and New York and the smallest amount in Wyoming, North Dakota, South Dakota and Montana.
Additionally, the researchers calculated the rate of incidents relative to the population of the each state. On a per capita basis, the District of Columbia stands out with the highest rate of incident observation followed by Nevada and North Carolina with Wyoming as the lowest.
Every indication is that Twitter can be used to develop data about individuals’ observations of how American elections are conducted, data that cover the entire country with extensive and intensive local detail. Mebane notes that the frequency, and likely the diversity, of observations may vary depending on how many people care and want to participate in, observe and comment on an election. Ultimately, Mebane would like to dig further into the geolocation information of these tweets to try and pinpoint any incidents with exact polling locations.
Earlier this year, the National Academy of Sciences (NAS) announced the election of the Institute for Social Research’s Donald Kinder, the only University of Michigan professor to be named in 2017 and the 28th professor to be named in U-M’s history. Established by Congress in 1863, the private, non-profit NAS promotes science through its consortium of more than 2,000 distinguished scholars, of which nearly 500 have won Nobel Prizes. NAS serves as an independent advising entity to the government, and provides recommendations and guidance on matters of scientific or technological importance to the nation.
Donald Kinder
“It is a thrilling surprise to be elected to the National Academy of Sciences,” says Kinder. “I was very pleased when I received the call about my election, and I look forward to working with members on a variety of new projects.” As a member, Kinder will attend NAS membership meetings and help review papers for the multidisciplinary journal, Proceedings of the National Academy of Sciences, as well as provide his expertise on subject-related projects or efforts.
Kinder, a Research Professor at ISR’s Center for Political Studies, is notable for his research on prejudice and how it impacts contemporary American politics. “Most of my work over the last 20 years has focused on racial politics in the United States, as I’ve tried to understand the foundations of public opinion and the role that race plays in elections,” says Kinder. “This area of study has been a long-standing interest of mine that actually started in graduate school. I was in a specific time in a specific place at UCLA in the early 1970s and I became interested in how white suburban voters were affected by the racial identity of one of the mayoral candidates.”
More recently, Kinder’s work has revolved around ideology in the study of American politics and his newest book, Neither Liberal Nor Conservative, debuted in May. “This book is about American politics and how American elites seem highly ideological yet most American citizens are not,” says Kinder. “This is a condition that has been present over the past 50-60 years. In some ways, it’s a surprising argument to make because people who study politics and think about politics usually make the presumption that ordinary people think deeply about politics, too. But the reality is that regular citizens have better things to do with their lives and, as a consequence of that, their thinking is more casual and less organized and certainly less ideological.” The book, written with Louisiana State University professor, and U-M grad, Nathan Kalmoe has received several long-form journalism reviews including in VOX and Washington Monthly.
As Kinder reflects on both his current work and his new election to NAS, he says, “I’ve been at U-M for going on 40 years and what I love about the place is the endless parade of super smart graduate students who come through. I think of my election to the National Academy of Sciences as a reflection of this remarkable place, my great colleagues and wonderful students.”