Sep 5, 2015 | Elections, Innovative Methodology, International
Post developed by Yioryos Nardis in coordination with Walter Mebane.
ICYMI (In Case You Missed It), the following work was presented at the 2015 Annual Meeting of the American Political Science Association (APSA). The presentation, titled “Election Frauds, Postelection Legal Challenges and Geography in Mexico,” was a part of the session “Detecting and Concealing Patterns in Data” on Saturday September 5th, 2015.
Political Science and Statistics Professor and Center for Political Studies faculty member Walter Mebane previously examined electoral fraud in Russia. Professor Mebane, in collaboration with Research Assistant Jonathan Wall, now turns his focus to Mexico and the Presidential elections of 2006 and 2012.
This new research by Mebane and Wall investigates if the numbers of casillas (i.e. ballot boxes) and votes challenged and nullified in Mexico reflect political strategies or genuine election irregularities. In the 2006 elections in Mexico, nullification petitions by runners up were filed against 21% of ballot boxes (27,109/130,788), even though only .56% of votes (237,736/41,791,322) were actually nullified. Similarly, in the 2012 elections, 22% of ballot boxes (32,151/143,132) were challenged and .38% of votes nullified (184,725/49,087,466).
Mebane and Wall examine how the types of nullification claims relate to ballot-box level measures of election fraud and whether the reasons cited for the challenges are uniform across the two elections and/or geography. That is, are complaints geographically clustered or does a complaint depend on geographically clustered frauds?
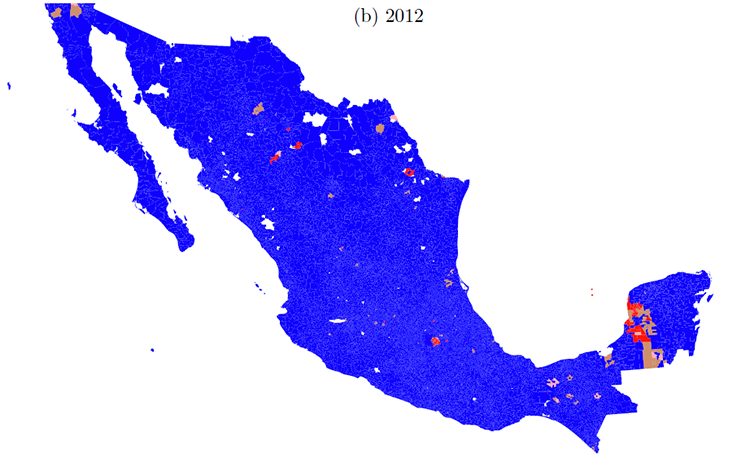
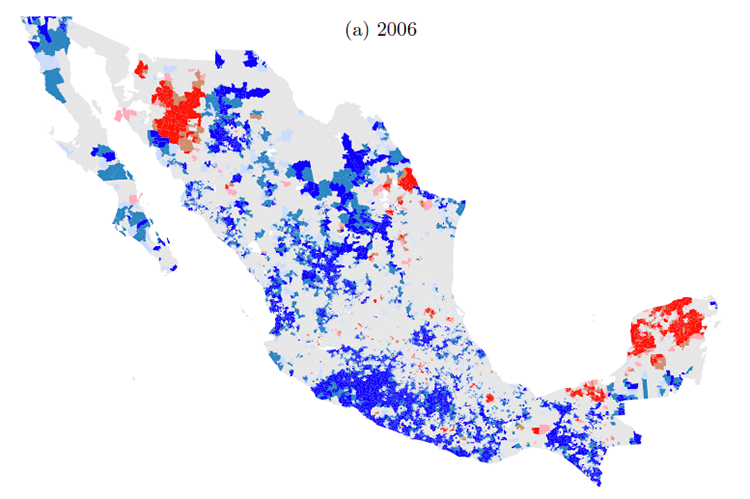
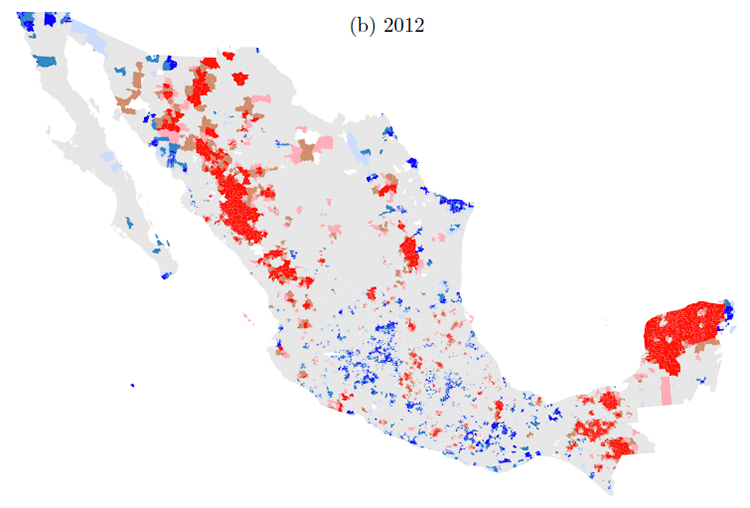
Ballot-box level measures of election fraud are estimated using casilla vote count data. Hotspot analysis is used to show how nullification petition challenges to casillas are distributed across geography. This technique identifies which locations have local means that are higher than the overall average values and which have local means that are lower than the overall average. A redder color indicates a cluster of locations with higher than average values, and a bluer color indicates a cluster of locations with lower than average values. Grey indicates a cluster of locations that does not differ significantly from the overall mean.
Figure 1 represents nullification complaints of type corresponding to willful misconduct or error in the vote count in the two Presidential elections, and Figure 2 represents incremental fraud probabilities for nullification complaints. Comparing Figure 2 to Figure 1 indicates that the pattern of geographic clustering for the incremental fraud probabilities does not correspond well with the pattern for nullification complaints.
Figure 1: Nullification complaints of type corresponding to willful misconduct or error in the vote count, Mexico, 2006 and 2012 Presidential election Casillas.
Seccion (precint) geographic cluster hotspots
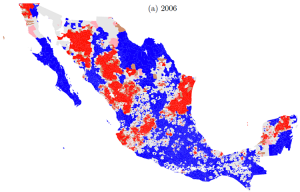

Figure 2: Incremental fraud, Mexico, 2006 and 2012 Presidential election casillas.
Seccion (precint) geographic cluster hotspots

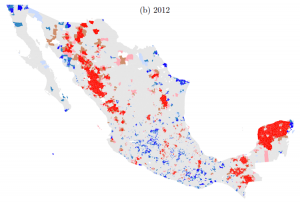
In 2006 there are more widespread regions with clusters of casillas having above average frequencies of complaints than there are regions in which there are clusters of casillas with above average incremental fraud probability values. Some of the above average type clusters overlap with above average incremental fraud clusters, but more than half do not. In 2012 on the other hand, we observe the opposite. Clusters of casillas with above average incremental fraud probabilities are much more prevalent than are clusters of casillas with above average frequencies of complaints.
Such patterns indicate that it is unlikely that the relationship between incremental fraud probabilities and the incidence of complaints are positively related. This therefore suggests that the occurrence of nullification petitions is related to the strategic and tactical incentives of political parties.
To read the full paper please visit: https://drive.google.com/open?id=0By8J0EDg6IC3MDgxOWlUVGdfakE
Feb 11, 2015 | Elections, International
Post developed by Katie Brown and Nahomi Ichino.
In many new democracies in developing countries, political parties are identified with particular ethnic groups, and voters tend to vote for the parties identified the same ethnicity as themselves – but not always.
Assistant Professor of Political Science and faculty associate of the Center for Political Studies (CPS) Nahomi Ichino addresses this issue in a recent article with Noah Nathan published in American Political Science Review.
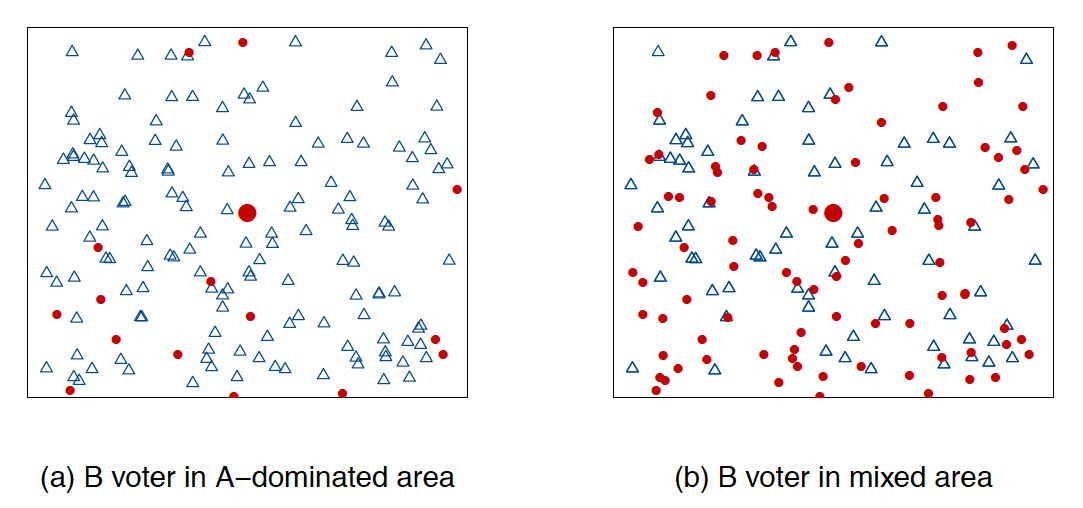
Voters tend to believe that politicians will reward their co-ethnic supporters by building schools and health facilities and providing other services that benefit a limited local area. For voters who live among mostly people of their own ethnic group, it makes sense to vote for the party of their own group.
But voters sometimes find themselves living in an area dominated by another group or in a mixed area, and the calculation is more difficult. Take for example the first visualization (a) offered by the authors. A voter (circle) is surrounded by others of a different ethnicity (triangles). That voter might do better if a party of the other group (triangles) won the election and directed more benefits like schools to this area than if the party of her own group (circles) won the area and directed benefits to a different area with many of her own group (circles). If that same voter were in (b), where she is surrounded by more members of her own group (circles), then she becomes more likely to vote for the party of her own group than if she were in (a).
Voter Ethnicity Illustration
Ichino and Nathan tested these predictions Ghana. First, the authors mapped ethnic concentration and diversity with data from the 2000 Ghana Population and Housing Census. Then, they geocoded polling stations results to look at how elections results vary with local ethnic composition in rural areas.
Ichino and Nathan first focused on the 2008 presidential election results in Ghana’s Brong Ahafo, a region that is both rural and ethnically diverse and find support for their ideas. Polling stations in areas surrounded by more Akans had higher vote shares for the political party associated with the Akan. The authors also tested their hypothesis with survey results from the Afrobarometer. They similarly find that Ghanaians were more likely to intend to vote for a political party associated with an ethnic group when they were surrounded by more members of that group.
The authors believe their findings nuance the generally accepted idea that people in new democracies simply vote for candidates who share their ethnicity. Ichino and Nathan conclude that their study “demonstrates how local community and geographic contexts can modify the information conveyed by ethnicity and influence voter behavior.”
Dec 4, 2014 | ANES, Elections, Innovative Methodology, National
Post developed by Katie Brown and Shanto Iyengar.
The inaugural Michigan Political Communication Workshop welcomed renowned political science and communication scholar Shanto Iyengar from Stanford University. Iyengar presented a talk entitled “Fear and Loathing across Party Lines.”
Iyengar began by considering the current polarized state of American politics. Both parties moving toward ideological poles has resulted in policy gridlock (see: government shutdown, debt ceiling negotiations). But does this polarization extend to the public in general? To answer this question, Iyengar measured individual resentment with both explicit and implicit measures.
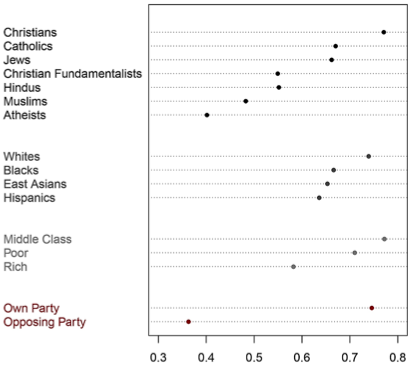
2008 ANES: Party vs Other Divisions
For an explicit measure, Iyengar turned to survey evidence. The American National Election Studies (ANES) indeed illustrates a significant decline in ratings of the other party based on feeling thermometer questions. Likewise, social distance between parties has increased over time, as measured by stereotypes of party supporters and marriage across party lines. In fact, this out-group animosity marks a deeper divide than other considerations, even race (see graph below).
But these surveys gauge animosity at the conscious level. Iyengar also believes mental operations concerning out-party evaluations occur outside of conscious awareness. So, along with Sean J. Westwood, Iyengar pioneered implicit measures of out-party animosity. Specifically, Iyengar and Westwood adapted the Implicit Association Test— originally used to capture racism – to political parties. Interestingly, the IAT also captured this animosity, although the polarization was more pronounced with the explicit survey measures. The chart on the left shows the starker divide between Democrats and Republicans using the feeling thermometer; the chart on the right shows the difference with the IAT.
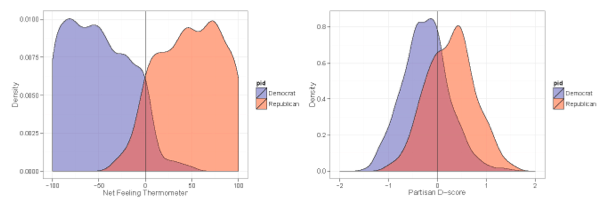
Comparing Implicit with Explicit Affect
Iyengar also adapted classic economic games to test implicit out-party animosity. Both games allow the participant to share a proportion of money provided by the researchers. Interestingly, participants gave less to out-party opponents. Iyengar cites this as evidence of implicit out-party bias.
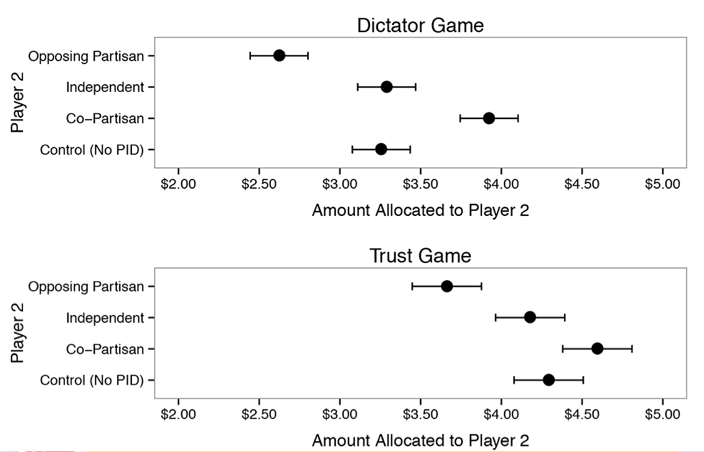
Economic Game Results by Party
Together, these results suggest marked party polarization. The hostility is so strong that politicians running on a bipartisan platform are likely to be out of step with public opinion.
Nov 3, 2014 | Elections, Innovative Methodology, National
Post developed by Katie Brown and Kristyn L. Karl.
It’s election time again. And elections bring advertising assaults by Internet, radio, and TV. In Michigan and Iowa, there is one political TV ad every two minutes. But what effect does this have on potential voters?
Center for Political Studies (CPS) affiliate and Ph.D. Candidate in Political Science at the University of Michigan Kristyn L. Karl investigated this question. Where previous research in this area uses self-reported measures of emotional response, Karl tackled the issue with a randomized experiment capturing a direct measure of physiological arousal – skin conductance. She was interested in the impact of emotional arousal from political ads on citizens’ intention to participate in politics.
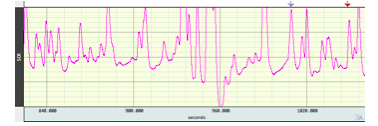
Sample Skin Conductance Output
For the study, Karl brought participants into the lab and measured their skin conductance while watching a political advertisement. The ad was fictitious and created in a way that gave Karl control over the message, images, music, and structure. Karl designed four ads: a positive Democratic or Republican ad, and attack ads on Democrats or Republicans. Participants randomly watched one of the four ads while their physiological arousal was captured; after the ad, they reported their current emotions and their willingness to participate with regard to 1) signing a petition, 2) initiating a conversation on a political topic, and 3) attending a meeting, rally, or demonstration.
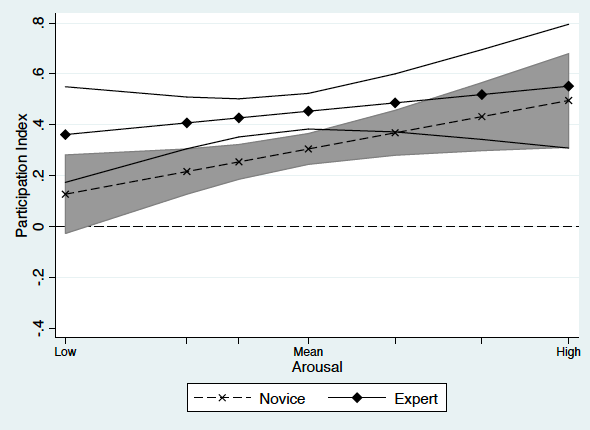
Karl finds some key differences between political novices and more experienced participants. For political novices, both physiological arousal and self-reported negative emotion positively predicted participation in politics. Among political experts, however, the connection between arousal, self-reported emotion, and intended participation is more muted. Specifically, while the trend is still positive, the effect fails to reach statistical significance.
The Marginal Effect of Physiological Arousal on Political Participation by Political Sophistication
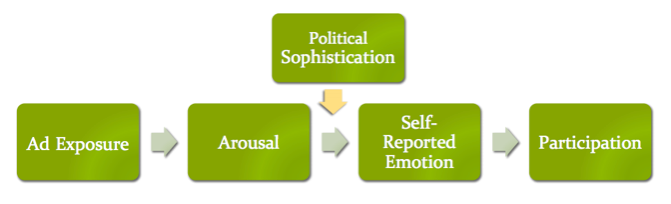
Karl turns to theory to explain the limited effect of arousal on intention to participate among experts. Experts have a well-developed cognitive network about politics which, for better or worse, allows them to more easily interpret and condition their emotional responses to political stimuli. Political novices do not have this expansive network and so react in a more instinctual way. The model below captures this:
This experiment highlights the importance of using alternative measures of emotional arousal as a complementary tool to self-reported measures. Moreover, it draws attention to the question of for whom political ads are motivating and how do they work.
Oct 31, 2014 | Elections, National
Post developed by Katie Brown and Josh Pasek.

Photo credit: ThinkStock
With each election cycle, the news media publicize day-to-day opinion polls, hoping to scoop election results. But surveys like these are blunt instruments. Or so says Center for Political Studies (CPS) Faculty Associate and Communication Studies Assistant Professor Josh Pasek.
Pasek pinpoints three main issues with current measures of vote choice. First, they do not account for day-to-day changes. Second, they capture the present moment as opposed to election day. Finally, they can be misleading due to sampling error or question wording.
Given these problems, Pasek searched for the most accurate way to combine surveys in order to predict elections. The results will be published in a forthcoming paper in Public Opinion Quarterly. Here, we highlight his main findings. Pasek breaks down three main strategies for pooling surveys: aggregation, prediction, and hybrid models.
Aggregation – what news companies call the “poll of polls” – combines the results of many polls. In this approach, there is choice in which surveys to include and how to combine results. While aggregating creates more stable results by spreading across surveys, an aggregation is a much better measure of what is happening at the moment than what will happen on election day.
Prediction takes the results of previous elections, current polls, and other variables to extrapolate to election day. The upside of prediction is its focus on election day as opposed to the present and the ability to incorporate information beyond polls. But, because the models are designed to test political theories, they typically use only a few variables. This means that their predictive power may be limited and depends on the availability of good data from past elections.
Hybrid approaches utilize some combination of polls, historical performance, betting markets, and expert ratings to build complex models of elections. Nate Silver’s FiveThirtyEight – which won accolades for accurately predicting the 2012 election – takes a hybrid approach. Because these approaches pull from so many sources of information, they tend to be more accurate. Yet the models are quite complex, making them difficult for most readers to understand.
So which pooling approaches should you look at? That depends on what you want to know. Pasek concludes, “If you want a picture of what’s happening, look at an aggregation; if you want to know what’s going to happen on election day, your best bet is a hybrid model; and if you want to know how well we understand elections, compare the prediction models with the actual results.”
Oct 17, 2014 | Elections, International, Uncategorized
Post developed by David Howell and André Blais.
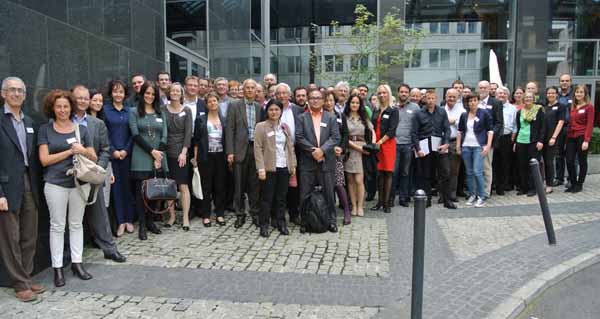
The Comparative Study of Electoral Systems (CSES) project recently celebrated its 20th anniversary during a Plenary Session of collaborators in Berlin, Germany, with thanks to the Wissenschaftszentrum Berlin für Sozialforschung (WZB) for their generous organizational and financial support of the event.
At the event, 31 election studies from around the world made presentations about their research designs, plans, challenges, and data availability, with most of their slide sets being available for viewing at the Plenary Session website.
It was especially appropriate to return to Berlin this year, the city having hosted the initial planning meeting for the project 20 years previously. The original event was sponsored by the International Committee for Research into Elections and Representative Democracy (ICORE). Originally anticipated as an outgrowth of ICORE, the CSES grew and eventually replaced it.
A CSES module consists of a 10-15 minute questionnaire that is inserted into post-election surveys from around the world. The project includes collaborators from more than 60 countries, with 50 election studies from 41 countries having appeared in the CSES Module 3 dataset. The CSES design is such that each module has a different theme which is intended to address a new “big question” in science. The project combines all of these surveys for each module, along with macro data about each country’s electoral system and context, into a single dataset for comparative analysis. There is no cost to download the data, and there is no embargo or preferential access. Every citizen in the world is able to download the data from the project’s website at the very same time as any of the project’s collaborators.
The recent Berlin meeting involved the first public presentation and discussion of content proposals submitted for CSES Module 5, for which data collection will be conducted during 2016-2021. After a public call, 20 proposals in total were received – a record number. Interested persons can view a presentation about the proposals, on topics ranging from corruption to populism to personality traits to electoral integrity. The theme for Module 5 will be selected, and the questionnaire developed and pretested, over the next one-and-a-half years. Prior modules have had as their themes: the performance of democracy, accountability and representation, political choices, and distributional politics and social protection.
As of the Berlin meeting in 2014, André Blais and the CSES Module 4 Planning Committee have handed over their role to a new CSES Module 5 Planning Committee, with John Aldrich as chair. John is an outstanding scholar who, in addition to having held leadership positions in many professional associations, has a long association with both the American National Election Studies and CSES.
While at its core CSES is a data gathering and disseminating organization, it has produced many other benefits as well. CSES considers an important part of its mission to be to create a community for electoral researchers, and to encourage election studies and local research capacity building around the world. CSES enables scholarship not just in political science, but other related disciplines – over 700 entries now appear in the CSES Bibliography on the project website.
The majority of funds for the CSES project are provided by the many organizations that fund the participating post-election studies. The central operations of the project are supported by the American National Science Foundation and the GESIS – Leibniz Institute for the Social Sciences.
We’d like to thank our many collaborators, funding organizations, and users for their support of the CSES, and we look forward to developing an engaging CSES Module 5!