Making Education Work for the Poor: The Potential of Children’s Savings Accounts

Post written by Katherine Pearson

Dr. William Elliott contends that we need a revolution in the way we finance college education. His new book Making Education Work for the Poor, written with Melinda Lewis, takes a hard look at the inequalities in access to education, and how these inequalities are threatening the American dream. Elliott and Lewis present data and analyses outlining problems plaguing the system of student loans, while also proposing children’s savings accounts as a robust solution to rising college costs, skyrocketing debt burdens, and growing wealth inequality. In a presentation at the University of Michigan on October 3, 2018, Elliott presented new research supporting the case for children’s savings accounts and rewards card programs.

This video of Elliott’s talk was recorded by Poverty Solutions at the University of Michigan.

There is a prevailing belief that education provides a path to success and greater income. However, Elliott points out that income provides a means to survive, whereas assets determine who will thrive. Our current educational financing system, which relies mainly on student loans, may help some students reach higher income levels, but it does not equalize the wealth gap. In fact, the high debt burden of student loans actually widens that gap.

Defining the Problem

College access is more than a matter of having enough money to pay for a college education. Elliott asks a different question: are you better off going to college than not going? And does college pay off equally whether or not you graduate with debt.

Student loans have become the dominant means to finance a college education. In 2000, student loans made up 38% of net tuition, fees, room, and board; by 2013 they made up 50% (Greenstone, Looney, Patashnik, and Yu, 2013). Programs such as income-based repayment seem popular because they decrease loan defaults, but they actually increase debt burden by extending the length of time it takes to pay off the loan.

Data shows that assets matter

Elliott uses data to show that students who have to pay for college with student loans do not achieve the same outcomes as students who do not have to take out loans. According to the Government Accounting Office, assuming a standard ten-year payback at 7% annual interest, average cumulative undergraduate educational debt exceeded $18,000 in 2000. This means that students who take out loans pay $6,000 more in interest than their peers who did not take loans. Elliott challenges us: does this sound like equal opportunity? Furthermore, data shows that low-income students and African Americans earn less from their college degrees as adults. If education is to equalize these disparities, the return on the investment in a college a degree must be higher for all children, particularly those with low incomes and students of color.

Wealth inequality contributes to having higher amounts of student debt. Racial disparities in income and wealth account for over 35% of the black-white student loan debt in young adulthood. (Huelsman, 2015) This debt contributes to education’s failure to deliver on the opportunity to achieve the American dream. Research finds that acquiring the relatively small amount of $10,000 in student loans is associated with an 18% decrease in the rate of achieving median net worth.

In short, growing up in a family with less wealth contributes to having more student debt, and having more student debt contributes to having less wealth as a young adult creating a cycle of inequality from one generation to the next.

Small Dollar CSAs Build Wealth

Elliott shows that children’s savings accounts (CSA) have a positive effect on a family’s ability to save for college. However, small dollar CSAs haven’t been able to fully overcome the fact that low-income and minority families often have little money after they pay for basic needs.

The graphic above shows contribution value and total CSA value for the Harold Alfond College Challenge (HACC).

The graphic above shows contribution value and total CSA value for the Harold Alfond College Challenge (HACC).

One answer to this dilemma may be rewards cards. Elliott presented data from programs set up by grocery stores that offer a percentage of their sales to CSA programs, on the expectation of increasing sales volume. This intervention transforms spending into saving. Not only are families able to save without tapping into already very limited financial resources, it shapes the children’s expectations that they will be able to go to college, and start planning for their future with a greater sense of control.

Looking forward, Elliott and fellow researchers are launching three randomized control trials of rewards card programs in Wabash County, Indiana; St. Louis, Missouri; and Lansing, Michigan. These trials will examine whether or not families will actively save for college using a rewards card, how much they are able to save, and whether or not families will make a contribution to the CSA in addition to saving with the rewards card. Already, early results show an increase in savings. The rewards cards tripled the number of households actively saving via rewards cards, and consequently increased the averaged dollars saved after only 3 months. Behavioral and financial literacy attempts have not been effective way to increase college savings among the poor because low-income people have little money to contribute regardless of their level of financial literacy. Rewards programs, on the other hand, appear to be a promising way to help low-income families participate in saving in CSAs.

Promise Indiana 3 month results

An Asset Building Agenda for the 21st Century

Elliott likens CSAs to the plumbing, the most basic infrastructure, of a new system of education financing for the 21st century. Rewards cards add a new layer to that system that allows poor families to access the system of saving for college.

Creating a system where more people can build assets is a direct way to start closing the wealth gap in America. However, students with fewer assets end up paying much more for education when they can access it. Elliott argues that the idea of a wealth transfer is completely consistent with American history and with our collective narrative of individual effort. It is about equipping all children with tools that complement their own contributions. There are historical precedents for this type of wealth transfer, too: the Homestead Act and the GI Bill. Both required considerable individual effort, yet offered real promise to change the distributional consequences of existing systems—property ownership, on the one hand, and higher education, on the other—in ways that helped to transform power and pathways to prosperity, for generations. In the 21th Century there has yet to be such a wealth transfer, although the need has never been more urgent.


Tracking the Dynamics of the 2016 Election

This post was developed by Catherine Allen-West, Stuart Soroka and Michael Traugott

It’s an election year in America, and with that comes an endless string of media coverage of the political campaigns. If you are like 70% to 80% of Americans over the past 12 weeks, you’ve read, seen or heard some information about the top two presidential candidates, Hillary Clinton and Donald Trump, on any given day.

These are the findings from an ongoing research collaboration between Gallup, the University of Michigan and Georgetown University. Since July 11, 2016 Gallup has asked 500 respondents per night what they have read, seen or heard about Clinton or Trump that day. The resulting data include open-ended responses from over 30,000 Americans thus far.

Content analyses of these open-ended responses offer a unique picture of campaign dynamics.  The responses capture whatever respondents remember hearing about the candidates over the previous few days from traditional media, social media, or friends and family. As Gallup points out in the article above, results from this project are noteworthy because while most survey research tracks Americans’ opinions on candidates leading up to an election, this study looks directly at the information the public absorbs, on a daily basis.


For up to date results from this project visit: www.electiondynamics.org


Tracking the ‘Tone’ of What Americans Have Read, Seen or Heard

In this blog post, we offer some supplementary analysis, focusing on the tone of responses to the “read, seen or heard” question.  Positive and negative tone (or sentiment) are captured using the Lexicoder Sentiment Dictionary, run in Lexicoder.  The Lexicoder Sentiment Dictionary includes roughly 6,000 positive or negative words.  We count the frequency of both, and produce a measure of tone that is the % positive words – % negative words, for every response, from every respondent.

Taking the average tone of responses daily provides insight into the content that American citizens are receiving (and remembering) during the campaign.  In this analysis, we focus on measures of “candidate advantage,” where “Clinton advantage” is the gap between the tone of responses to the “read, seen or heard” question about Clinton, and the tone of responses to the “read, seen or heard” question about Trump.  Positive values reflect a systematic advantage for Clinton; that is, a tendency for recalled information about Clinton to be more positive than recalled information about Trump.  Negative values reflect the opposite.

As would be expected, when we look at partisanship, Republicans have more a net positive assessment for Trump. This is particularly true in the first weeks of September.  Democrats show a similar tendency in that they have more net positive assessments for Clinton.  That said, the first few weeks of September show, at best, a very weak advantage for Clinton among Democrats.  During the early weeks of September, Democrats’ recalled news was not markedly more positive for Clinton than it was for Trump.  ‘Read, seen or heard’ comments from Democrats even turned to Trump’s advantage in the period from September 16th to 18th, before trending more positive towards Clinton again.  This shift from Democrats followed concerns about Clinton’s health, but it also (and relatedly) reduced mentions of emails. This trend continued after the recent bombings in New York and New Jersey became prominent. And then came her performance in the debate.  All of this coverage led to a steady increase in Clinton’s advantage among Democrats.

figure_cand_tone_daily_clinton_sept29

For Republicans, the picture is nearly the opposite.  The gap between recalled information about Trump and recalled information about Clinton was striking through the first few weeks of September.  While Democrats did not recall information favorable to Clinton, Republicans clearly recalled information favorable to Trump.  But responses started to shift in the middle of the month and the ‘Trump Advantage’ in the tone of recalled information from Republicans has continued to fall since the first debate.

figure_cand_tone_daily_trump_sept29-1

What do these findings suggest about the presidential campaign thus far?  While these results do not capture vote intentions, nor are they direct assessments of the candidates, these data do give us a unique sense for the information that voters remember.  Whether shifts in ‘read, seen or heard’ mentions are predictive of attitudes towards the candidates remains to be seen.  Exploring this possibility is one objective of the ongoing project.

The Gallup, Michigan, Georgetown Working Group consists of: Frank Newport, Lisa Singh, Stuart Soroka, Michael Traugott, and Andrew Dugan.

Related Article: After the Debate, Trump is still dominating news coverage. But Clinton is getting the good press. The Washington Post.

Trading hard hats for combat helmets: The economics of rebellion in eastern Ukraine

Post developed by Yioryos Nardis in coordination with Yuri Zhukov.

In March and April 2014, angry mobs and armed men stormed administrative buildings and police stations in eastern Ukraine. Waving Russian flags and condemning the post-revolutionary government in Kyiv as an illegal junta, the rebels proclaimed the establishment of ‘Peoples’ Republics’ of Donetsk and Luhansk, and organized a referendum on independence. Despite initial fears that the uprising might spread to other provinces, the rebellion remained surprisingly contained. While 61% of municipalities in Donetsk and Luhansk fell under rebel control during the first year of the conflict, just 20% experienced any rebel violence. What explains these local differences in rebellion across eastern Ukraine? Why have some towns remained under government control while others slipped away? Why might two municipalities in the same region experience different levels of separatist activity?

Yuri Zhukov

Yuri Zhukov

The latest research by Yuri Zhukov, faculty member in the Center for Political Studies and Assistant Professor of Political Science, uses new micro-level data on violence and economic activity in eastern Ukraine to examine these questions. In the paper “Trading hard hats for combat helmets: The economics of rebellion in eastern Ukraine” (forthcoming in the Journal of Comparative Economics) Zhukov evaluates two prominent explanations on the causes and dynamics of civil conflict in eastern Ukraine: ethnicity and economics.

Identity-based explanations expect conflict to be more likely and more intense in areas where ethnic groups are geographically concentrated. According to this view, the geographic concentration of an ethnolinguistic minority – in this case, Russians or Russian speaking Ukrainians – helps local rebels overcome collective action problems, while attracting an influx of fighters, weapons and economic aid from co-ethnics in neighboring states.

According to economic explanations, as real income from less risky legal activities declines relative to income from rebellious behavior, participation in the rebellion is expected to rise. This framework maintains that violence should be most pervasive in areas potentially harmed by trade openness with the EU, austerity and trade barriers with Russia.

Zhukov finds that local economic factors are much stronger predictors of rebel violence and territorial control than Russian ethnicity or language. Pro-Russian rebels in Ukraine are “pro-Russian” not because they speak Russian, but because their economic livelihood depends on trade with Russia.

The study uses new micro-level data on violence, ethnicity and economic activity in the Donbas region of eastern Ukraine, to understand how these two explanations are related to rebel violence and territorial control. The spatial units are 3037 municipalities (i.e. cities, towns, villages) in Donetsk and Luhansk provinces. For each municipality, Zhukov estimated the proportion of the local labor force employed in three industries: machine-building (which is heavily dependent on exports to Russia), metals (less dependent on Russia, and a potential beneficiary of increased trade with the European Union), and mining (vulnerable to International Monetary Fund-imposed austerity and cuts in state-subsidies). He also calculated the proportion of Russian speakers in each locality.

Rebel violence data are based on human-assisted machine coding of incident reports from multiple sources, including Ukrainian and Russian news agencies, government and rebel press releases, daily ‘conflict maps’ released by both sides, and social media news feeds. This yielded 10,567 unique violent events in the Donbas, at the municipality level, recorded between the departure of President Viktor Yanukovych in February 2014 and the second Minsk ceasefire agreement of February 2015. To determine territorial control, particularly whether a populated place was under rebel or government control on a given day, Zhukov used three sources: official daily situation maps publicly released by Ukraine’s National Security and Defense Council (RNBO), daily maps assembled by the pro-rebel bloggers ‘dragon_first_1’ and ‘kot_ivanov’, and Facebook posts on rebel checkpoint location.

zhukov_all
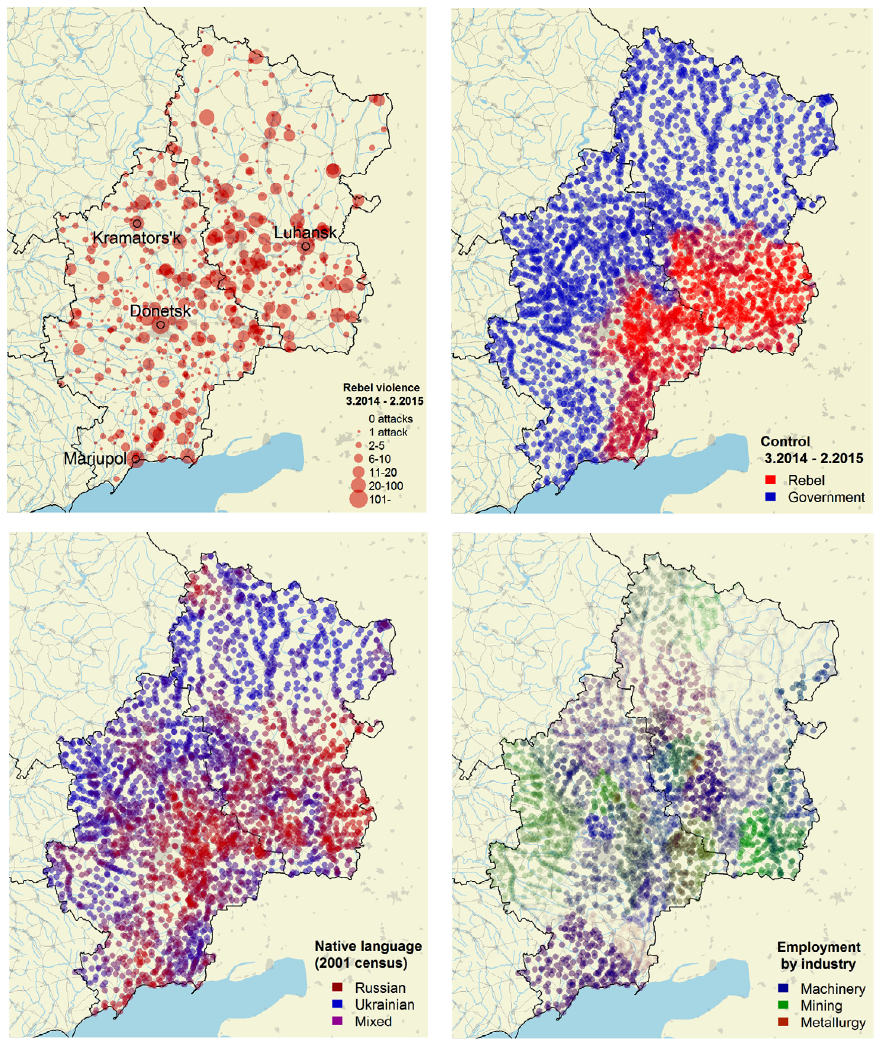
To evaluate the relative explanatory power of ethnic and economic explanations of violence in the Donbas, the study uses Bayesian Model Averaging. It finds that a municipality’s prewar employment mix is a better predictor of rebel activity than local ethnolinguistic composition. Municipalities more exposed to trade shocks with Russia experienced a higher intensity of rebel violence throughout the conflict. Municipalities where machine-building represented a small share of local employment (2%, the lowest in the data) were 38% less likely to experience violence than municipalities where the industry was more dominant — and the local population more vulnerable to trade disruptions with Russia. Such localities also fell under rebel control earlier – and took longer for the government to liberate – than municipalities where the labor force was less dependent on exports to Russia. On any given day, a municipality with higher-than-average employment in the beleaguered machine-building industry (26%) was about twice as likely to fall under rebel control as a municipality with below-average employment in the industry (4%).

By contrast, ethnicity and language had no discernible impact on rebel violence. Municipalities with large Russian-speaking populations were more likely to fall under rebel control, but only where economic dependence on Russia was relatively low. In other words, ethnicity only had an effect where economic incentives for rebellion were weak.

The seemingly rational economic self-interest at the heart of the conflict stands in sharp contrast with the staggering costs of war. In the twelve months since armed men began storming government buildings in the Donbas, over 6000 people have lost their lives, and over a million have been displaced. Regional industrial production fell by 49.9% in 2014, with machinery exports to Russia down by 82%.Suffering heavy damage from shelling, many factories have closed. With airports destroyed, railroad links severed and roads heavily mined, a previously export-oriented economy has found itself isolated from the outside world.

References:

2001 Ukrainian Census (State Committee on Statistics of Ukraine, 2001).

Bureau van Dijk’s Orbis database (Bureau van Dijk Electronic Publishing, 2015).

Segodnya, 2015. Ekonomika donetskoy oblasti v upadke iz-za voyny – gubernator kikhtenko. [Donetsk region’s economy in stagnation because of the war – Governor Kikhtenko]. Segodnya.

Stasenko, M., 2014. Novaya ekonomika ukrainy budet stroit’sya bez rossii i donbassa [Ukraine’s new economy will be built without Russia or the Donbas]. Delo.ua.

Power and the Vote: Elections and Electricity in the Developing World

Post developed by Yioryos Nardis in coordination with Brian Min.

Across the developing world, debate persists on whether democracy benefits the poor and how governments decide who gets access to public goods like electricity, water, and education. However, answers are limited because we lack reliable data on what states actually do in many of the world’s poorest areas where data are unavailable or of unknown quality.

Brian Min bookPower and the Vote: Elections and Electricity in the Developing World, a new book by Center for Political Studies Faculty Associate and Assistant Professor of Political Science Brian Min, overcomes fundamental data challenges by leveraging new satellite imagery that provides objective and consistent evidence on access to electricity, even in villages in the most remote parts of the world. New data and tests measure and observe state actions in the developing world where traditional data collection strategies are inadequate. Using satellite images of nighttime lights and other high-resolution geo-coded data across the world and over time, the book analyzes how political institutions affect the delivery of electricity to the poor.

The first book to use satellite data to study public goods and development, it offers an evaluation of how governments treat their citizens. The book builds on Min’s past work on the measurement of rural electrification in Senegal and Mali and electricity and electoral competition in India to provide a new political theory of public goods provision. Min argues that public goods are valuable to democratic leaders not only because they reach many voters and are valued by the public, but also because of the political externalities they generate for electorally minded politicians. Min’s research shows that the provision of seemingly universal public goods is intricately shaped by electoral priorities. Combining cross-national evidence with detailed sub-national analysis and village-level data from India, the book suggests that the targeting of electricity provision peaks during election periods when voter attention is highest and where the political opportunity and capacity for change is highest.

Power and the Vote points to the influence of electoral incentives in shaping the distribution of public goods, and challenges the view that democracy is a luxury of the rich with little relevance to the world’s poor. Policymakers and international development practitioners will appreciate the focus on the energy challenge facing the world’s poor, and insights on how politics shapes the delivery of even technical services like electricity.

The fifth module of the Comparative Study of Electoral Systems (CSES)

Post developed by David Howell and André Blais.

The Comparative Study of Electoral Systems (CSES) project recently celebrated its 20th anniversary during a Plenary Session of collaborators in Berlin, Germany, with thanks to the Wissenschaftszentrum Berlin für Sozialforschung (WZB) for their generous organizational and financial support of the event.

At the event, 31 election studies from around the world made presentations about their research designs, plans, challenges, and data availability, with most of their slide sets being available for viewing at the Plenary Session website.

It was especially appropriate to return to Berlin this year, the city having hosted the initial planning meeting for the project 20 years previously.  The original event was sponsored by the International Committee for Research into Elections and Representative Democracy (ICORE).  Originally anticipated as an outgrowth of ICORE, the CSES grew and eventually replaced it.

CSES Berlin 2014 Group Photo

A CSES module consists of a 10-15 minute questionnaire that is inserted into post-election surveys from around the world. The project includes collaborators from more than 60 countries, with 50 election studies from 41 countries having appeared in the CSES Module 3 dataset. The CSES design is such that each module has a different theme which is intended to address a new “big question” in science. The project combines all of these surveys for each module, along with macro data about each country’s electoral system and context, into a single dataset for comparative analysis.  There is no cost to download the data, and there is no embargo or preferential access.  Every citizen in the world is able to download the data from the project’s website at the very same time as any of the project’s collaborators.

The recent Berlin meeting involved the first public presentation and discussion of content proposals submitted for CSES Module 5, for which data collection will be conducted during 2016-2021.  After a public call, 20 proposals in total were received – a record number.  Interested persons can view a presentation about the proposals, on topics ranging from corruption to populism to personality traits to electoral integrity.  The theme for Module 5 will be selected, and the questionnaire developed and pretested, over the next one-and-a-half years.  Prior modules have had as their themes: the performance of democracy, accountability and representation, political choices, and distributional politics and social protection.

As of the Berlin meeting in 2014, André Blais and the CSES Module 4 Planning Committee have handed over their role to a new CSES Module 5 Planning Committee, with John Aldrich as chair. John is an outstanding scholar who, in addition to having held leadership positions in many professional associations, has a long association with both the American National Election Studies and CSES.

While at its core CSES is a data gathering and disseminating organization, it has produced many other benefits as well.  CSES considers an important part of its mission to be to create a community for electoral researchers, and to encourage election studies and local research capacity building around the world.  CSES enables scholarship not just in political science, but other related disciplines – over 700 entries now appear in the CSES Bibliography on the project website.

The majority of funds for the CSES project are provided by the many organizations that fund the participating post-election studies.  The central operations of the project are supported by the American National Science Foundation and the GESIS – Leibniz Institute for the Social Sciences.

We’d like to thank our many collaborators, funding organizations, and users for their support of the CSES, and we look forward to developing an engaging CSES Module 5!