Mar 20, 2014 | Current Events, Elections, Innovative Methodology, International
Post developed by Katie Brown in coordination with Kirill Kalinin.
Photo credit: Thinkstock
An earlier post on the Center for Political Studies (CPS) Blog covered Kirill Kalinin’s work concerning election fraud in Russia. That post showed evidence from empirical work that polls ahead of the 2012 Russian presidential election were flawed, setting the stage for subsequent election fraud. This post returns to Kalinin’s work to consider why.
Political Science Ph.D. candidate Kirill Kalinin studies election fraud. Along with Professor of Political Science, Professor of Statistics, and Center for Political Studies Faculty Associate Walter Mebane, Kalinin authored a paper – Understanding Electoral Frauds through Evolution of Russian Federalism: from “Bargaining Loyalty” to “Signaling Loyalty” – arguing that Russia’s election fraud can be understood as rooted in federalism and a formal signaling game model.
Kalinin and Mebane support this argument with empirical analysis. The researchers find that the occurrence of 0s and 5s in the last digit of election turnout percentages to be suspicious. In fact, using statistical modeling, they find it to be linked to election fraud connected with post-election rewards and punishments. From 2000 on, fraud appears to be widespread.
But why? In 2000, Putin came to power and initiated a process of recentralization. From the mid 1990s through the 2000s, regional governors made changes based in rational strategy to Russia’s federal relations.
In the mid-1990s, the central government rewarded governors with political, institutional, and financial resources in exchange for favorable election results. In the 2000s, this escalated to election fraud.
As Kalinin concludes, “Over the most recent election cycles Russian elections have become increasingly unfree and unfair, characterized by suppression of electoral competition, rising levels of administrative interference and drastic growth of electoral frauds.” That is, the rewards for fraud have rendered Russian elections inherently fraudulent.
Mar 13, 2014 | ANES, ANES 65th Anniversary, Elections
Post developed by Katie Brown and Morris P. Fiorina.
 This post is the first in a series celebrating the 65th anniversary of the American National Election Studies (ANES). The posts will seek to highlight some of the many ways in which the ANES has benefited scholarship, the public, and the advancement of science. Do you have ideas for additional posts? Please contact us by email ([email protected]) or Twitter (@umisrcps).
Ahead of the 2012 Presidential election, Morris P. Fiorina, who is the Wendt Family Professor of Political Science at Stanford University and Senior Fellow at the Hoover Institution, wrote an op-ed for the New York Times.
In the article, Fiorina used American National Election Studies (ANES) data to consider the role of the personal qualities of candidates in election outcomes. Fiorina referenced a research report published in the British Journal of Political Science (with Samuel Abrams and Jeremy Pope) after the 2000 presidential election in the United States. The report sought to explain Al Gore’s defeat in the election during a time of peace and prosperity. The report utilized a battery of questions from the ANES that asks respondents to detail what would make them vote for or against each candidate. The authors coded the respondents’ responses to measure candidates’ personal qualities.
What was the relationship between this rating of candidates’ personal qualities and election outcomes? Looking at thirteen elections from 1952 to 2000, Fiorina and his colleagues found that in four elections the electorate gave a noticeable edge to one of the candidates, but the outcomes were not what pundits would have expected. For example, the highest rated Democratic candidate was Jimmy Carter, who lost to the lowest rated Republican candidate, Ronald Reagan, in 1980. And the lowest rated Democratic candidate was Bill Clinton, who won a landslide re-election in 1996.
In the op-ed, based on these findings, Fiorina challenged those citing Romney’s likability deficit relative to Obama as an unlikely cause of the election outcome. As Fiorina wrote, “If Romney loses, it will be because the public believes that Obama has done a good enough job to continue or that Romney has not advanced a credible recovery program. ‘Voters didn’t like my personality’ is a loser’s excuse.”
In subsequent media interviews, Fiorina emphasized how the ANES, funded by the American National Science Foundation (NSF), is far more than another database; it is a 60 year political history of electoral politics in the US. As Fiorina commented, “ANES provides an accurate history of modern American politics, as seen through the eyes of voters at the time, not filtered through the lenses of academic historians or biased journalists.”
Feb 18, 2014 | Current Events, Elections, Innovative Methodology, International
Post developed by Katie Brown in coordination with Kirill Kalinin
Photo credit: Thinkstock
In March of 2012, Vladimir Putin was elected to his third term as President of Russia, after a four year leave serving as Prime Minister. Massive protests and speculation about electoral manipulation and fraud accompanied the election. Yet at the same time, polls ahead of the election predicted a landslide victory by Putin.
Are both the polls and election results incorrect? Could this be explained by social desirability?
Political Science Ph.D. student Kirill Kalinin studies election fraud. Along with Professor of Political Science, Professor of Statistics, and Center for Political Studies (CPS) Faculty Associate Walter Mebane, Kalinin conducted a series of studies that consider the role of social desirability (or the tendency to answer questions not truthfully but in line with public opinion) in the most recent Russian presidential election. This work is possible due to financial assistance from the Department of Political Science at the University of Michigan, Weiser Center for Emerging Democracies at the University of Michigan, and fruitful cooperation with Henry Hale (George Washington University) and Timothy Colton (Harvard University) within the project of Russian Election Study.
Kalinin focuses on a particular kind of social desirability: preference falsification. Preference falsification pertains to when an individual’s private preferences diverge from public preferences in the context of an election. In the case of Russia 2012, Russian public opinion overwhelmingly supported a strong ruler, i.e., Putin. But did this then push people who would vote against Putin to report to pollsters they planned to vote for him anyhow?
To test this, Kalinin and Mebane conducted a series of list experiments. Run in the month before and after the 2012 election, potential Russian voters were given a list with four statements. Those randomly selected into the sensitive statement condition saw a fifth statement, either about Putin’s electoral support or about voter turnout. Participants indicated how many of the statements they agree with.
Their results overwhelmingly point to preference falsification both ahead and after the election. Specifically, there appears to have been over-reporting both of turnout and electoral support for Putin.
Kalinin concludes that, “In an authoritarian setting like Russia, covering up election fraud is important. This study, however, shows that electoral polling may also be susceptible.” This sets the stage for subsequent election fraud. That is, if Putin is mis-predicted to win, then election fraud can make this win a reality. Poll and election results match but neither is true.
Jan 15, 2014 | Elections, Innovative Methodology, Michigan, National
Developed by Katie Brown in coordination with Arthur Lupia.

Photo credit: Thinkstock
Voters are ignorant and we must fix them. This belief has spawned much political science research and many efforts to inform the “ignorant. ” But what if this premise is false?
In a forthcoming book – The trouble with voters and those who try to fix them – Center for Political Studies (CPS) researcher and professor of political science Arthur Lupia suggests that voters aren’t as ignorant as many fear.
First, it is impossible to know all potentially relevant political information. Lupia presents his own position as a citizen as a case study. To be informed about all legislation that could affect him, Lupia should know about the more than 2,000 laws passed by the United States Senate and signed by the President. He should also know about the 40,000 additional proposed bills. As a resident of Michigan, Lupia should know about the 1,239 proposed bills, 42 concurrent resolutions, 26 joint resolutions, and 174 resolutions from the Michigan House of Representatives, as well as the 884 bills, 25 continuing resolutions, and 19 joint resolutions from the Michigan Senate in 2011 alone. Living in Ann Arbor, Lupia should also know about the many city ordinances passed in recent years. Does he know the gist, let alone the details, of each of these? No. Does he or anyone need to? No.
Second, even if you could know all potentially relevant political information, shortcuts can get you there faster. That is, voters without certain knowledge tend to vote the same as if they possessed that knowledge. Lupia likens this to traffics signals. It is impossible for a driver to know the traffic flows and locations of all vehicles in all directions when approaching an intersection. A traffic light signals the optimal time to go and stop. Voters can therefore seek out signals in a saturated, sometimes chaotic political environment to make informed choices.
So, voters are not crippled by ignorance. What then of those who try to fix voters? Lupia sees fixers as playing an integral role in civic society. But these fixers would benefit from changing their baseline assumption. Voters are not broken. With this paradigm shift in place, fixers could appeal to this group with precision and tact. To this end, Lupia offers the latest from biology and brain science, strategic communication, and marketing to help fixers better deliver their messages.
Lupia summarizes his argument in succinct terms: “From these facts alone, we can draw an important conclusion. When it comes to political information there are two groups of people. One group is almost completely ignorant of almost every detail of almost every law and policy under which they live. The other group is delusional. There is no third group.”
Nov 5, 2013 | Elections, National
Developed by Katie Brown in coordination with Josh Pasek.
Photo credit: Thinkstock
American elections are traditionally held the first Tuesday in November. On this first Tuesday in November, we present a post on ballots in honor of elections.
Ballots list all candidates officially running for a given office so that voters can easily choose between them. But could the ordering of candidate names on a ballot change some voters’ choices? A new study by Center for Political Studies (CPS) Faculty Associate and Assistant Professor of Communication Josh Pasek suggests just such a possibility.
Pasek studies the impact of new media and psychological processes on political attitudes, public opinion, and political behavior. In a forthcoming paper – with Daniel Schneider, Jon Krosnick, Alexander Tahk, Eyal Ophir, and Claire Milligan – Pasek considers the effect of ballot ordering on election results.
The study uses data from all California elections between 1976 and 2006. California randomizes the order of candidate names on ballots by district, creating a natural chance to test this question.
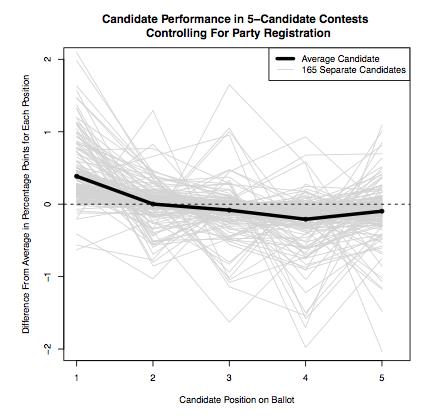
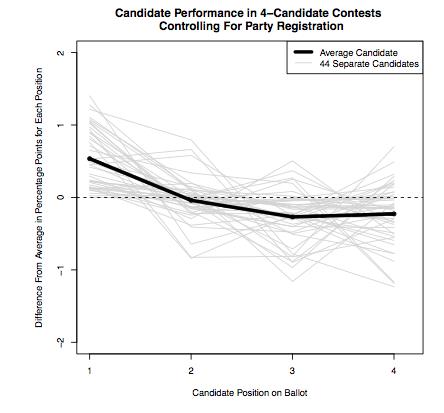
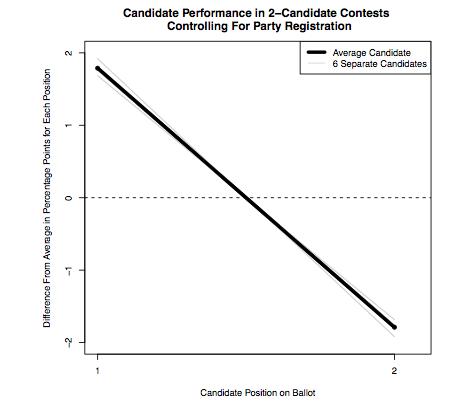
Pasek and his colleagues analyzed the data in a variety of ways. No matter the approach, candidates listed first on the ballot had a slight advantage. This effect was largest for races (1) with little publicity, (2) when more votes were cast, and (3) when there was a bigger win. These factors support the idea that name order may influence those with minimal information about or investment in the race.
The graphs at the bottom of this post show this advantage for contests with (a) five candidates, (b) four candidates, and (c) two candidates. The horizontal axis shows the position of each candidate on the ballot. The vertical axis shows how that candidate’s votes would be expected to change. As we can see, candidates tend to perform best when listed in the first position on the ballot and worse when listed farther down on the ballot, with the exception of the last spot on the ballot where there is a slight rebound.
Although the overall size of the effect is small, Pasek notes that the size of the effect is far greater than the margin of victory in many elections. For example, George W. Bush beat Al Gore by less than 0.009 percent (a few hundred votes out of six million cast) in Florida in the 2000 election for the President of the United States. Randomizing the order of names on a ballot may therefore be important for ensuring a fair, democratic process.
a.
b.
c.
Sep 23, 2013 | Elections, Innovative Methodology, National
Post developed by Katie Brown in coordination with Cara Wong.
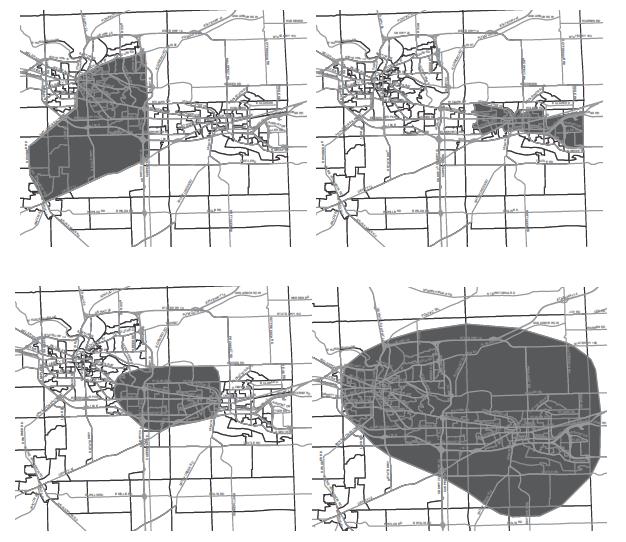
The maps below show the same small city. The shaded area shows how residents delineate their community. The differences are notable. But do these internal maps impact how people make political decisions?
Center for Political Studies Adjunct Faculty Associate and University of Illinois Associate Professor of Political Science Cara Wong studies perceptions of communities and how this impacts policy support. With colleagues Jake Bowers and Tarah Foster Williams of the University of Illinois, and Katherine Drake Simmons of the Pew Research Center, Wong published a paper in the Journal of Politics that considers how these mental maps relate to policy support.
In the study, participants were shown a map of the blocks surrounding their home and a map of their county, and asked to highlight their local community on either. Two thirds focused on the block maps, while one third shaded communities on the county maps. The size highlighted ranged from smaller than a block to larger than two cities. Some participants even highlighted non-contiguous areas.
Then, the participants were asked to describe the demographics of the area they highlighted. Questions included the proportion of blacks and whites, Democrats and Republicans, and unemployed. Next, they were asked about their take on these factors in the United States in general. Results show that participants view their communities and the United States at large as having more blacks (15% more on average) and fewer whites than the census. Unemployment and racial distortions are bigger than partisan distortions. All three are distorted to some extent across the block, community, and country levels.
The highlighted areas varied between participants. Their internal maps of their communities also differ from how the government creates administrative boundaries. But to what effect?
These discrepancies can play out in the voting booth and in day to day {day-to-day} behaviors. As Wong et al. explain:
The ‘fear of crime’ literature in sociology has explained that personal and altruistic fear—regardless of accuracy—leads to purchases (e.g., guns), behavioral changes (e.g., not going out at night), and abandonment of locations (e.g., parks and industrial areas). Political scientists need to understand whether perceptions of community heterogeneity and interracial competition have equally serious consequences for political actions and outcomes.