
Oct 24, 2024 | ANES, ANES 75th Anniversary, Elections
At 75 years, the American National Election Studies (ANES) now comprises data on a third of all presidential elections in U.S. history. Duke political scientist John Aldrich has written that the ANES has provided a research design and common core measurement instrument to study dynamics of public opinion and collective action over an increasingly long historical sweep: “This time-series is unprecedented in its breadth of questions, length of time, and commonality of research design and instrumentation,” he wrote in “The ANES as ‘Gold Standard’ for Survey Research in the Twenty-First Century” (March 2017). “From this, an understanding of historical dynamics is only now becoming fully possible.”
In recognition of the ANES’s 75th anniversary, the Center for Political Studies reached out to scholars to ask what the study has revealed about key moments, decades, or patterns in American history. Their answers captured two prevailing themes: Increasing polarization and partisan alignment around issues of race. Here are a few of the responses we received:

“The first thing that comes to mind is the major realignment of the American party system that occurred (mostly during the 1960s) because of the civil rights movement, desegregation, and busing. Everything we know about affective polarization among the general public comes from survey data, much of it gathered by the ANES. We are now learning about the alarming recent growth of conspiracy beliefs and anti-democratic populism beliefs among the American public.”
– Richard R. Lau, Professor of Political Science at Rutgers University

“The ANES has been pivotal in the emergence of research on polarization – especially work on the way partisans feel about both their own party, and the other party. It is only through the over-time aspect of the ANES – and the consistency in measurement – that scholars saw fundamental changes in people’s feelings toward the opposing party.”
– Yanna Krupnikov, Professor of Communication and Media, University of Michigan; Faculty Affiliate, Center for Political Studies
![DAVID O. SEARS UCLA Donald Kinder used the ANES to make a strong case for changes in the nature of white racism in America and for its continued political clout. [Others] used it effectively to demonstrate how racialized the 2008 and 2012 presidential elections were. Nick Valentino and I used it... to make a case for the gradual partisan realignment of the white South in the last half of the 20th century around racial issues.](https://cpsblog.isr.umich.edu/wp-content/uploads/2024/10/Screenshot-2024-10-24-at-2.39.22 PM-1024x575.png)
“Donald Kinder used the ANES to make a strong case for changes in the nature of white racism in America and for its continued political clout. Then Michael Tesler and I (2010) and Kinder and Dale-Riddle (2011) used it effectively to demonstrate how racialized the 2008 and 2012 presidential elections were. Nick Valentino and I (2005) used it in a more historical sense, to make a case for the gradual partisan realignment of the white South in the last half of the 20th century around racial issues”
– David O. Sears, Distinguished Professor Emeritus, UCLA

“I think that the single most important contribution of ANES to the study of American politics was the concept of party identification. In the 1940s, the study of US politics was done through demographic analysis at the local level. Then in the 1948 and 1952 studies, Michigan began to organize national studies of the electorate. In 1952 they started measuring attitudes about Eisenhower and Stevenson and the role of parties, and with the “Michigan Model” they were able to move from group-level analysis to national analysis. You can’t see a study of the electorate now without a reference to the difference between Democrats and Republicans, and that can be traced directly back to the 1952 ANES study. …As elections have become more polarized, the ANES’ feeling thermometer questions measuring affective polarization have become increasingly important. In the 1990s, political elites became more polarized and began voting in bodies. Voting across party lines began disappearing. Citizens learned from these votes what it meant to be a Democrat or a Republican and began to divide in the same way. …It’s impossible to disentangle this from the rise of cable TV with commentaries on issues from the Left and the Right. These shifts in the presentation of politics on TV occurred simultaneously with changes in Congressional voting caused a change in voting behavior.” –Michael Traugott, Center for Political Studies
– Michael Traugott, Professor of Communication Studies, Research Professor, Center for Political Studies, University of Michigan

May 14, 2024 | ANES, Elections, National
A new book by leading scholars of partisanship explores the recent consequences of political hostility, and how it does and doesn’t affect democratic functioning
Is partisan hostility damaging American democracy?
The short answer is yes: Political animosity, which scholars recognize as the defining feature of American politics this century, can degrade democratic functioning. But the question begs for a long answer: To see and face the implications of partisan hostility, we need a nuanced understanding of its effects and its boundaries.
A forthcoming book by some of the foremost scholars of polarization amasses empirical evidence of the consequences of political hostility in recent years, and offers a theory of when it affects political beliefs and behaviors.
Partisan Hostility and American Democracy: Explaining Political Divisions and When They Matter (University of Chicago Press: 2024) will be released June 12 from authors James N. Druckman, Samara Klar, Yanna Krupnikov, Matthew Levendusky, and John Barry Ryan.
Study after study has shown a striking rise in negative feelings Americans hold toward the opposing party– a concept scholars call affective polarization. Roughly 8 in 10 partisans report these negative feelings, according to Pew Research Center, and the majority use pejorative words– such as “hypocritical,” “closed-minded,” and “immoral” to describe their counterparts. While partisans have maintained stable attitudes toward their own party over time, their “ratings” of the other party have plummeted since 1980 and notably in the last decade. The authors cite New York Times columnist David Brooks’s taut summation– in the age of affective polarization, “we didn’t disagree more– we just hated each other more.”
“We find that partisanship does shape political beliefs and behaviors, but its effects are conditional, not constant,” said co-author Yanna Krupnikov, an affiliate of the Center for Political Studies at the University of Michigan Institute for Social Research and a professor in the Department of Communication and Media. “It seems most likely to guide beliefs on issues that don’t have direct personal consequences, and it’s most powerful when parties send strong, clear cues on an issue.”
The authors test that framework using panel survey data from a 21-month period spanning 2019, 2020, and 2021– three tumultuous years that occasioned the COVID-19 pandemic and vaccine distribution; the murder of George Floyd and subsequently the largest protest movement in US history; the 2020 election and January 6 insurrection; two impeachments, and a shift in the congressional majority.
The best data for measuring animosity over time, according to the authors, is the “feeling thermometer” in the American National Election Studies (ANES) survey, where respondents rate their feelings toward a party or issue on a 101-point scale, in which “50 degrees” is the neutral fulcrum between “warmer” or “colder” feelings. The authors use that measure in their own data along with additional measures: trust questions, trait ratings– where respondents evaluate how well positive and negative traits describe each party– and “social distance measures,” where respondents rank their comfort level in situations like having their child marry someone from the other party.
They find the effects of political hostility are most concentrated in individuals with comparatively high animosity, who are a distinctive group in America– with particularly strong political identities and high levels of political engagement. These “high animus” partisans are more likely to take and act on party cues about where they “should” stand, and more likely to reject the possibility of their own party compromising.
We can observe that animosity can fuel polarization on issues that might otherwise be informed by independent deliberation. In 1997, for example, Democrats and Republicans were equally likely to believe in climate change science; today, there’s a pronounced divergence that can only be explained by parties staking a claim on the issue, Krupnikov said.
The authors focus particularly on the case of politicization that drove the gap between Democrats and Republicans’ behavior during the COVID-19 pandemic. Political hostility is more likely to shape partisan evaluations of party leaders, they report, but the case of Dr. Anthony Fauci demonstrates how party cues can politicize specific targets. The authors also found the effects of COVID’s politicization on behaviors like vaccine or mask resistance diminished when actors confronted the personal stakes of the illness. To further understand these party signal dynamics and when they matter, the authors investigated the effect of animosity on policy positions in cases where issues are politicized by both parties, one party, and neither party.
“The advantage of our theory is its recognition that partisan divides are not inevitable and on many issues most people agree,” said John Barry Ryan, also an affiliate of the Center for Political Studies. “Overall, we see that animosity shapes decision-making by heightening the effects of party cues.”
The authors argue that while partisan hostility has degraded US politics—for example, politicizing previously non-political issues and undermining compromise—it is not in itself an existential threat. Political hostility has little effect on popular beliefs in fundamental norms, and it’s unlikely to directly lead to democratic breakdown or collapse, they say. They also find that overall, partisans do not strongly support undemocratic practices.
Yet there is considerable cause for concern that partisan hostility may erode democracy over time. Political hostility can result in blind loyalty and decision-making based purely on team mindset– with worrying implications– and animosity can spiral because it has self-perpetuating effects.
“We find that animosity has clear, predictable effects on prioritizing party over other considerations, especially for issues that lack clear and immediate consequences to a person,” Ryan said. “It affects policy positions that make democratic functioning difficult– like our willingness to compromise, or our judgments of party leaders, and how we respond to the pandemic.”
“Political elites can politicize issues and can potentially seize on division in hopes of gaining support,” said Krupnikov. “There is often a focus on voter division, but the future of American democracy depends often on how politicians– more than ordinary voters– behave.”
This post was written by Tevah Platt, communications specialist for the Center for Political Studies.

Apr 15, 2024 | ANES, ANES 75th Anniversary, Elections
The American National Election Studies (ANES) has been recognized by the American Association for Public Opinion Research (AAPOR) with its Policy Impact Award– given annually to outstanding projects making a clear impact, improving policy decisions, practice and discourse. The ANES was selected for “making public opinion available to policymakers, informing public discourse, and allowing evaluation of the functioning of democracy.”
With this award, AAPOR recognized the ANES as the longest-running and most widely used and cited time series of public opinion and voting behavior data in the world.
“The entire ANES team is humbled by this award,” said ANES Primary Investigator Nicholas Valentino, Professor of Political Science and Research Professor in the Center for Political Studies (CPS) at the University of Michigan Institute for Social Research. “In our democracy, public opinion is meant to guide elected representatives’ policy decisions, so informed policy discourse and assessments of democracy require information about public opinion. The ANES collects high-quality data on opinion and behavior that inform policy discourse and allow evaluation of the functioning of democracy.”
AAPOR noted that the ANES has been the leading source of data on public opinion in electoral politics for decades, noting that “nearly all leading issues of national policy in the United States since the 1950s are addressed by the study, including, especially, racial inequality, economic inequality, social capital, campaign finance, voter ID laws, and attitudes and opinions about government institutions.”
The ANES is a national infrastructure project for research about the public’s relationship with government, Valentino said. For 75 years, it has provided public access to high-quality data built around two main outcome variables: turnout and candidate choices in elections for federal office. To explain these outcomes, ANES questionnaires cover policy preferences, identity, prejudice, values, behavior, knowledge, and demographics, with an emphasis on high quality sampling and measurement. “The resulting datasets inform policy discourse and take the vital signs of democracy.”
As illustrations of the durable and far-reaching impact of the ANES, AAPOR noted the breadth, number, and diversity of organizations that have cited or relied on the data in their policy advocacy or discourse– including the high branches of government, the lower federal courts, foreign and internationally-focused organizations, policy think tanks and advocacy organizations. In an increasingly polarized media environment, AAPOR recognized that ANES is frequently cited in the news media, and by all sides. The model established by the ANES has been the inspiration for national election studies in over 30 countries around the world. The impact on research about democratic society is illustrated by over 8,000 papers, books, and other publications that have used ANES data over the past 75 years. Finally, AAPOR cited the ANES as the most cited dataset in peer-reviewed articles about public opinion and political behavior in the leading political science journals — used by thousands of scholars, journalists, students, and citizens to understand American democracy.
“ANES policy impact is broad, but two important and timely foci are campaign finance and voter ID laws, where ANES is regularly cited in legal briefs, policy advocacy, and non-partisan reports,” said Valentino.
This year marks the 75th anniversary of the ANES: Since 1948, the definitive study of American political attitudes and behavior has run national surveys of citizens before and after every presidential election, providing a rigorous, non-partisan basis for understanding contemporary issues as well as change over time.
Valentino noted that the ANES has a legacy of AAPOR recognition as scholars using ANES data have been lauded over decades. The first winner of the AAPOR Award for career achievement, Angus Cambpell, won largely for the work he did to create the ANES, Valentino said. Numerous subsequent AAPOR Award winners – including Philip Converse (1986), Howard Schuman (1994), Norman Nie (2006), Michael Traugott (2010), Stanley Presser (2011), Jon Krosnick (2014), and Lawrence Bobo (2020) – each rely heavily on ANES data in their work (and Converse and Krosnick were ANES principal investigators).
“It is a great honor for ANES to continue in this intellectual tradition, and we would all like to thank the selection committee at AAPOR,” said Valentino. “[It is also important] to mention that the ANES staff is large and makes a huge contribution to the project’s success.”
The ANES is a collaboration of the University of Michigan and Stanford University, with Duke University and the University of Texas, and is funded by the National Science Foundation.
AAPOR has offered the Policy Impact Award annually since 2004. Last year’s winners were the National Health and Aging Trends Study (NHATS) and the National Study of Caregiving (NSOC); previous honorees include the U.S. Census Bureau, the Henry J. Kaiser Family Foundation, the RAND Corporation, and the Urban Institute.
In addition to Valentino, Shanto Iyengar of Stanford University is a principal investigator of the project. The Associate PIs are D. Sunshine Hillygus of Duke University and Daron Shaw of the University of Texas at Austin. David Howell and Matthew DeBell are the Directors of Operations at Michigan and Stanford, respectively.
The Center for Political Studies has recently published a series on the 75th anniversary of the ANES: Including a Q&A about the project with Nicholas Valentino, a visual history of the project, and reflections from scholars who have been impacted by the ANES.
Two CPS students also received awards from AAPOR this year: Francy Luna Diaz and Zoe Walker, both Institute for Social Research Next Generation Scholars, won AAPOR Student-Faculty Diversity Pipeline Awards, which aim to recruit faculty-student “pairs” interested in becoming AAPOR colleagues to study public opinion and survey research methodology.
This post was developed by Tevah Platt.

Feb 13, 2024 | ANES, ANES 75th Anniversary, Elections
 This year marks the 75th anniversary of the American National Election Studies– the definitive study of American political attitudes and behavior. The ANES has run national surveys of citizens before and after every presidential election since 1948, providing a rigorous, non-partisan basis for understanding contemporary issues as well as change over time. According to the National Science Foundation, the ANES provides “gold-standard data on voting, public opinion, and political participation in American national elections.” The Center for Political Studies interviewed ANES Principal Investigator Nicholas Valentino to gather his reflections on the history of the ANES, what we’ve learned from it, and where we’d be without it. This interview has been edited and condensed.
It’s the 75th anniversary of the ANES. What do you want people to know about it?
VALENTINO: It’s really important to remind ourselves about how important the ANES has been in terms of a gold standard survey, both methodologically and substantively, that other polling outfits use as a benchmark. We don’t often talk about those things, because we assume it is well known how important the ANES is for the entire discipline. But it is important that the ANES collects the highest quality samples; we care a lot about measurement, and we don’t change measures unless we know that the alternative is a better measure of the concept that we’re trying to tap. Every year, hundreds of dissertations and publications are written using ANES data. That means ANES data appear in thousands of scientific works per decade, and tens of thousands over the life of the project.
This is the most centrally important study of American public opinion and political behavior in existence.
What’s unique about the ANES survey?
VALENTINO: With the rise of other less expensive samples and sampling methods, especially volunteer internet samples, entire generations of students are now able to collect data on their own rather than rely on infrastructure projects like the ANES. This is no doubt a great innovation, because each scholar can learn a lot about new topics and perform survey experiments for which the ANES is not well suited. But these new samples and sampling techniques can’t match ANES’s data quality both in terms of measurement practices and the sampling quality. They can’t provide valid and reliable estimates of opinions that the population holds because they do not collect representative samples of the country. They can’t replace address-based samples and the face-to-face interviewing methodology that the ANES has employed (with the COVID-year exception in 2020) for 75 years. And, perhaps equally importantly, with its time series questions, the ANES allows one to measure population level change in opinions over time. The ANES is very unique for both of these reasons, and so we think it has made good on the hopes of its founders 75 years ago.
Let me say a bit more on how the ANES represents truly invaluable infrastructure for the entire discipline. The Department of Astronomy at Michigan recently invested in the instrumentation program for the Extremely Large Telescope (ELT), which is a consortium of universities and partners building the largest optical telescope in the world. Few universities can afford to build their own telescopes; instead, they buy into a measurement strategy that is fundamentally collaborative. The National Science Foundation supports these big projects, because they know that scholars from universities around the country can use the telescope regardless of the research budgets on their home campus. Well, that’s what the ANES is doing for the study of public opinion and political behavior. We include questions on the survey that have been asked before because we want continuity of measurement, and that are interesting to the broadest array of users in the community. The user community has several mechanisms for influencing the content of the ANES, including specific proposals and by serving on the large and diverse Advisory Board.
Where would we be today were it not for the ANES?
Valentino: One example is that we are currently very concerned about affective polarization or the polarization of society along lines of party. It was once the case that Democrats and Republicans didn’t dislike each other very much at all. In fact, if you ask Democrats and Republicans how warmly they felt toward their own party and toward the out-party, they once gave both roughly the same score. If you track this in the ANES over time, we see that after the 1980s there was a dramatic, continuous increase in how much Americans disliked members of the other party. That discovery has triggered a wide ranging set of inquiries about whether it was driven by elite preferences, differences in the party platforms, or by something that was changing in the electorate. We’re still trying to answer this question about why. But we wouldn’t really have known how big the problem was, or when it started, if not for the ANES. The ANES tells us when it started, and how fast it grew. And those pieces of information are very critical for understanding why it happened.
What kinds of questions have been asked continuously over the history of the ANES?
Valentino: It must have been very hard in 1950 to know which questions to ask, especially if one wanted to begin a time series that would last 75 years. You can imagine how different the world was when Warren Miller and his colleagues started thinking about what questions they should ask. One example of a question we have asked continuously over time is, “How much do you trust the government to do what’s right?” If you look up the trend on government trust on the accessible web page– the ANES Guide to Public Opinion and Electoral Behavior– you will see a dramatic decline in the percentage of people who say they trust the government to do what’s right. This trend is one of the things people point to when they worry about democratic backsliding and the deterioration of democratic norms. Back in the late 1950s, in the Eisenhower era, almost 80% of Americans said they could trust the government “most of the time or just about always.” Now that number has decreased to about 20%. Another question has been asked for quite some time on this topic: “Are governmental officials crooked?” At one time the vast majority of Americans responded “not many,”or “hardly any.” Since 2008, there has been a massive increase in the share of the electorate from either party who say “quite a few” elected officials are crooked. So that’s a massive shift and a decrease in trust that we’re aware of because of the ANES asking the same questions consistently over time. Americans’ trust in government hit its nadir in 2020– making the future of the ANES particularly valuable for understanding how democracies react to declines in public confidence.
What have we learned from the ANES about how voters select their candidate?
Valentino: One of the early discoveries of the founders of the ANES was that psychological attachments to parties themselves are group identities.
Party identification is the core predisposition shaping political beliefs and behaviors. In other words, it may be that votes are driven most strongly by those partisan identities rather than a citizen’s individual preferences on a bundle of policies. That discovery can have a very scary set of implications.
Most definitions of democracy insist that citizens have the ability to freely choose candidates who represent their issue preferences and hold elected officials accountable when they fail to produce results consistent with their campaign promises. So what if pre-existing attachments to parties drive vote choices even when candidates are not delivering on issues or economic performance? In that system, leaders could pursue policy interests divorced from the majority’s will. It reduces the impact that issues, trends, and performance have on democratic elections. If so, elections increasingly resemble sports events, in which it is forbidden to criticize the home team.
The ANES has documented a long-term shift in party identification, and especially a decline in Democratic dominance from the 1950s to the present. Over time, there is a lot of variation in partisan attachments that is not predicted by social group memberships. You might look at individual-level psychological forces to explain, for example, how white, blue-collar Democrats were pushed toward the Republican party after the Civil Rights movement. That is a dynamic you couldn’t understand by looking solely at social group memberships or by considering material interests. The early scholars of the ANES were among the first to discover that, contrary to popular belief, people don’t vote with their personal pocketbooks. People are motivated less by their own financial security than by how they think the country is doing as a whole. Americans, at least until very recently, support the incumbent if the country is doing well, even if that candidate is from the other party. The ANES was central in discovering this pattern. It will also be central for understanding how these long-term linkages between economic performance and support for incumbents may be breaking down.
What have we learned from the ANES about why some voters participate in politics and others don’t?
Valentino: It is often remarked that political science has few “laws” – theories that are so powerful and elegant that they have reached the status of a settled scientific explanation for important phenomena. One exception is the Civic Volunteerism model of participation proposed by Verba, Schlozman and Brady (1995). This theory claims that people turn out because they want to, because they’ve been asked to, or because they can. Those forces– engagement, recruitment, and resources– are all measurable, and the ANES measures them over time. The model has done a fantastic job explaining who will participate in politics in a variety of ways.
But short-term forces also matter. For example, people with a lot of resources participate in some elections but not others, and some people who have very few of these advantages participate, even though the model might predict that they wouldn’t. The short-term forces are also measurable, and many political psychologists are working on those. We have, for example, identified short-term emotional dynamics that can drive people to the polls– sometimes, but not others– even holding resources constant. You need to ask people about the emotional intensity they are experiencing in a given election, the intensity of competition between the candidates, about campaign negativity, and the tone of political discourse. These factors have also been measured by the ANES, and so our theories of participation are getting stronger and more comprehensive.
How and why are new questions added to the ANES?
Some parts of the ANES every election are about mapping long-term trends, but about 30% of the content on the ANES is concerned with the contemporary moment. People think that the ANES is only about asking the same questions, 75 years straight, but that is a profound misconception. The project solicits input from the user community every cycle, and relies on its diverse Advisory Board to identify contemporary issues it must explore. The ANES actively cultivates new questions about very new issues that might be driving the dynamic in a given election year, but may or may not be permanent parts of our landscape. And we try to balance those new inquiries against the space needed in order to measure long-term trends. Only then can political science as a discipline understand how we got to this point, and predict where we might be going.
Takeaways:
- The ANES is a centrally important study of American public opinion and political behavior.
- The ANES provides gold-standard data on voting, public opinion, and political participation in American national elections, priding itself on sampling quality and measurement quality.
- Looking at long-term trends, we currently stand at a low-point for Americans’ trust in government and an all-time high for affective polarization. These trends are understandable because the ANES’s time series questions track change over time.
- The ANES has demonstrated that political identity plays a strong role in determining how voters choose candidates.
- People participate in politics when they are interested, asked to participate, and have the resources to participate. But short-term factors like the emotional intensity of an election also matter. The ANES survey measures all of these factors.
- In recent cycles, about 30% of the survey has been dedicated to new questions investigating contemporary issues based on input from its community of users.
- Tens of thousands of dissertations and publications have been based on data from the ANES over the project’s history.
Nicholas Valentino is Professor of Political Science at the University of Michigan and a Research Professor affiliated with the Center for Political Studies at the Institute for Social Research. He received his Ph.D. from the University of California, Los Angeles, in 1998. His research focuses on political campaigns, racial attitudes, emotions, and social group cues in news and political advertising. His current work examines the intersection between racial attitudes and emotion in predicting political participation and vote choice, as well as the sources of public support and opposition to immigration in the U.S. and cross-nationally.
The ANES is currently a collaboration of Duke University, the University of Michigan, Stanford University, and the University of Texas at Austin, with funding from the National Science Foundation.
This post was developed by Tevah Platt.
Oct 31, 2023 | ANES, Economics, Elections, expert analysis, International, National, Policy, Social Policy
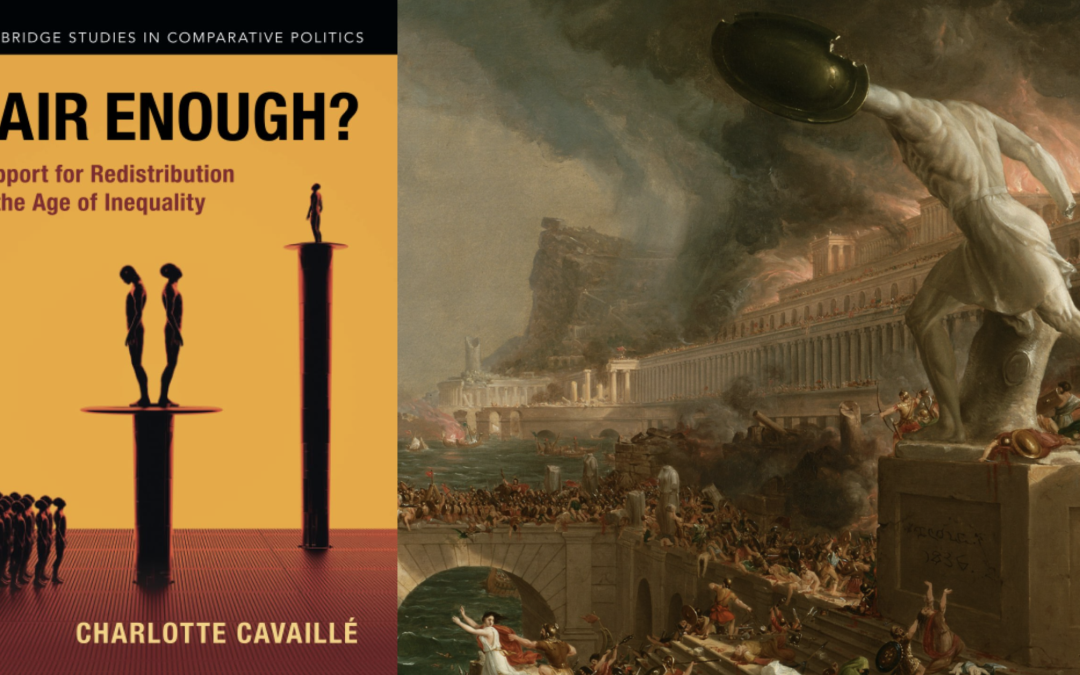
In the past, excessive economic inequality has ended… badly. As Charlotte Cavaillé points out in her new book that studies the public’s reaction to rising inequality, “only mass warfare, a state collapse, or catastrophic plagues have significantly altered the distribution of income and wealth.” Will this time be different?
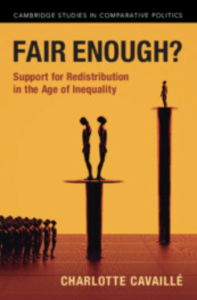
Through income redistribution, democratic and political institutions today have a clear mechanism to peacefully address income inequality if voters demand it. Still, as highlighted by Cavaille in Fair Enough?: Support for Redistribution in the Age of Inequality (Cambridge University Press), greater wealth and income inequality are not leading to greater demand for an egalitarian policy response as many would expect.
Cavaillé reports there is little evidence of rising support for redistribution, especially among the worse off. Consider public opinion in the two Western countries with the sharpest increase in income inequality: In Great Britain, public support for redistribution is decreasing, and in the United States, the gap between the attitudes of low-income and high-income voters is narrowing. What, asks Cavaillé, can we conclude about public opinion’s role as a countervailing force to rising inequality?
 Based on Cavaillé’s doctoral work, Fair Enough? introduces a framework for studying mass attitudes toward redistributive social policies. Cavaillé shows that these attitudes are shaped by at least two motives: material self-interest and fairness concerns. People support policies that would increase their own expected income. On the other hand, they also support policies that, if implemented, “would move the status quo closer to what is prescribed by shared norms of fairness.” Material interest comes most into play when policies have large material consequences, according to Cavaillé, but in a world of high uncertainty and low personal stakes, considerations of fairness trump considerations about one’s personal pocketbook.
How fair is it for some to make a lot more money than others? How fair is it for some to receive more benefits than they pay in taxes? Cavaillé emphasizes two norms of fairness that come into play when we think about such questions: proportionality, where rewards are proportional to effort and merit, and reciprocity, where groups provide basic security to members that cooperatively contribute. Policy disagreement arises because people hold different empirical beliefs regarding how well the status quo aligns with what these norms of fairness prescribe.
With fairness reasoning in the picture, Cavaillé writes, “baseline expectations are turned on their heads: Countries that are more likely to experience an increase in income inequality are also those least likely to interpret this growth as unfair.”
Should we expect growing support for redistribution to be a driving force behind policy change in the future? A change in aggregate fairness beliefs, Cavaillé argues, will require a perfect storm: a discursive shock that repeatedly exposes people to critiques of the status quo as unfair on the one hand, and a large subset of individuals whose own individual experience predispose them to accept these claims as true on the other. Policy changes in postindustrial democracies are possible, Cavaillé concludes– but they are unlikely to be in response to a pro-redistribution shift in public opinion.
 Charlotte Cavaillé is an assistant professor of public policy at the University of Michigan’s Gerald R. Ford School of Public Policy and an affiliate of the Center for Political Studies at the Institute for Social Research. Her dissertation, on which ‘Fair Enough’ is based, received the 2016 Mancur Olson Best Dissertation Award.
Tevah Platt and Charlotte Cavaillé contributed to the development of this post.
May 11, 2023 | Elections, National, Policy, Social Policy
Post by Joshua Thorp
The 20th century Disability Rights Movement (DRM) is among the most successful and durable mass protest movements in American political history. Throughout the 20th century, DRM activists fought for equal political and economic rights– the desegregation of classrooms and public accommodations, the dismantling of coercive residential institutions, and an accessible built environment. Disabled activists and their allies occupied warehouses and university campuses, chained themselves to city buses, and took sledgehammers to inaccessible street curbs in an effort to make their voices heard. These remarkable episodes of political cohesion culminated in the 1990 passage of the Americans with Disabilities Act (ADA), a bill heralded by senator Tom Harkin, its chief congressional champion, as “the emancipation proclamation for people with disabilities.”
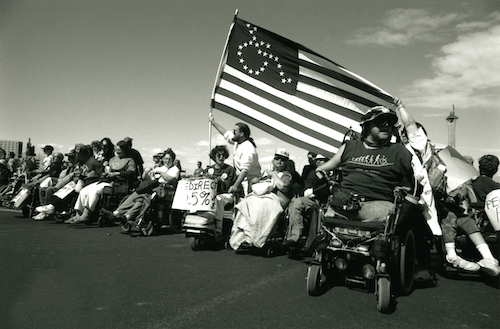
width=”871″ height=”573″ /> Used by permission. © Tom Olin Collection, Ward M. Canaday Center for Special Collections, The University of Toledo Libraries.
Despite the prominence of disability in American political history, political scientists have only a thin understanding of how disability shapes political behavior. For the most part, existing research focuses on election accessibility and emphasizes the role of disability in curbing political participation. Several studies find that despite being no less interested in politics, people with disabilities are substantially less likely to turn out to vote than their non-disabled peers.
However, researchers have largely overlooked the potential impact of disability on political psychology. In particular, we don’t know whether disabled Americans see their disability as a politically meaningful feature of their social identities, or whether disability might serve as a basis for political cohesion or collective action. While the history of disability rights activism suggests disability may be politically mobilizing for a small minority of activists, less is known about whether or to what extent disability may also shape political identity in the mass public.
In a recent working paper, I find that disability is indeed an important dimension of political identity for many disabled Americans.
While disabled Americans do not appear mobilized along party lines, a sense of belonging to the disability community is associated with ideological liberalism and support for a range of social and redistributive policies.
Measuring disability as a social identity
I used an online survey of 700 Americans with disabilities to investigate two questions: Who embraces disability as a social identity? And how does identifying as a person with disability shape political attitudes? To collect the sample for this study fielded by Forthright Panels, I screened participants using the same measure of functional disability used by the U.S. Census and the CDC. I asked respondents a range of questions about their everyday experience of disability. I asked them how old they were when they first acquired their disability, how visible or noticeable their disability is by others, and how much functional limitation they experience in everyday life. Then, I asked respondents a series of questions about the degree to which their disability shapes their social identity: their sense of who they are as individuals and their place in the social world.
I compiled these items into a new measure of disability as a social identity– what I call the “Disability ID” scale. Those who score higher on the Disability ID scale consider disability to be an important feature of their personal identity, and place a high value on belonging to the disability community. A sizable minority of Americans with disabilities, about 35%, fall “high” on this scale.
Who embraces disability as a social identity?
I looked at the various characteristics that are associated with higher scores on the Disability ID scale. This analysis yielded two main findings. First, Disability ID is closely tied to impairment characteristics. Respondents with more severe, visible, and long-standing impairments were all more likely to report strong Disability ID. Second, Disability ID is stronger among those who participate in social and political institutions for people with disabilities. Specifically, Disability ID was stronger among those who reported receiving disability accommodations at school or at work, and among those who reported receiving financial assistance from the government on account of their disability.
How does Disability ID shape political attitudes?
Next, I wanted to understand how Disability ID shapes political outcomes. I first looked at the relationship between Disability ID and two key outcomes of interest to political scientists: ideology (liberal or conservative), and partisanship (Democrat or Republican).
The results of this analysis were intriguing. On the one hand, those higher in Disability ID tend to be more politically liberal. On the other hand, Disability ID has no discernible impact on political partisanship. In other words, those who identify strongly with their disability tend to support ideas often associated with liberalism, like government support for social services, but aren’t more likely to identify as Democrats.
I also wanted to understand the potential impacts of Disability ID on policy preferences. Given the particular forms of social and economic disadvantage that accompany disability, I predicted that Disability ID would be associated with support for government policies aimed at improving material well-being for people with disabilities. To test this prediction, I asked participants a series of questions about their level of support for a variety of social and redistributive policies.
A clear pattern of results emerged. Disability ID is strongly positively associated with support for a range of redistributive policies, especially those aimed at increasing financial security, public safety, and access to healthcare. In fact, in several instances the magnitude of the effect of Disability ID on policy attitudes is similar to that of explicitly political variables, such as political partisanship and ideology. On the other hand, Disability ID has relatively little impact on attitudes toward policies theoretically more peripheral to disabled Americans, such as public schools or border security.
Validity testing
To test the validity of these results, I conducted a similar analysis using data from the 2022 Cooperative Election Study (CES), a prominent national political survey fielded by YouGov and researchers from Harvard University. Unlike the Forthright Panels study, the CES survey was collected in two waves, where the same set of participants were interviewed before and after the 2022 midterm elections. I included questions about Disability ID on the pre-election survey fielded in the fall, and questions about policy attitudes on the post-election survey fielded in January 2023. This survey design allowed me to conduct a stronger test of the relationship between Disability ID and policy attitudes. By asking participants about their policy preferences in the post-election survey, I am able to observe the relationship between Disability ID and political attitudes in a context where participants have not already been primed to think about their disability.
Results from the CES mirror those found in the Forthright study. Again, Disability ID is strongly positively associated with support for redistributive policies, most notably those aimed at increasing financial security and access to healthcare. Furthermore, as in the Forthright Study, the magnitude of these effects is often similar to that of explicitly political variables, such as political partisanship and ideology.
Why does this matter?
These results should encourage researchers to think differently about the role of disability in shaping political behavior. More than 30 years after the passage of the ADA, disability remains an important dimension of socioeconomic inequality and disadvantage. People with disabilities are roughly twice as likely as their non-disabled peers to be unemployed and living in poverty, and are nearly four times as likely to be victims of violent crime. Addressing these inequalities is likely to require political engagement and collective action. While existing work has emphasized the role of disability in curbing political participation, these results suggest that for many disabled Americans, a shared social identity as members of the disability community may be an important source of political cohesion and empowerment.
 Joshua Thorp is a PhD candidate in Political Science at the University of Michigan. His research focuses on political psychology in the United States and other developed democracies, with a particular focus on the politics of disability. Thorp’s dissertation examines disability as a dimension of political identity in the United States. He is an Institute for Social Research Next Generation scholar at the Center for Political Studies, and was the recipient of the 2022 Converse-Miller fellowship in American political behavior.
The Forthright survey was generously funded by the Center for Political Studies (CPS) and the Rapoport Family Foundation. The CES data was collected as part of the University of Michigan team module of the Cooperative Election Study at CPS, led by Donald Kinder.
Tevah Platt and Julia Lippman contributed to the development of this post.