A major challenge confronting our society is the intensity of partisan disagreements, even about what constitutes fact. To address this challenge, fact-checking was initiated by organizations such as FactCheck.org and PolitiFact in the 2000s to assess the accuracy of political claims. For fact-checking journalism to be helpful, there should be widespread public trust in such websites. Yet about half of Americans believe fact-checkers are biased.
Two decades after its emergence, why has fact-checking failed to get traction among the public? What changes can help fact-checking sites earn greater trust?
Research shows that FactCheck.org, PolitiFact, and Washington Post Fact Checker in recent years often corrected Republicans at a greater rate than Democrats. These asymmetries indicate a specific way in which fact-checkers pursue objectivity. Unlike traditional journalism that in principle seeks objectivity by covering all sides equally, fact-checking’s coverage decisions are guided by what is consistent with the best available evidence. Thus, fact-checking sites at times disproportionally critique one party more often than the other as guided by evidence. However, this approach poses a dilemma. Their asymmetric coverage may reflect genuine imbalances in reality, but it can also undermine trust in fact-checking sites among partisans.
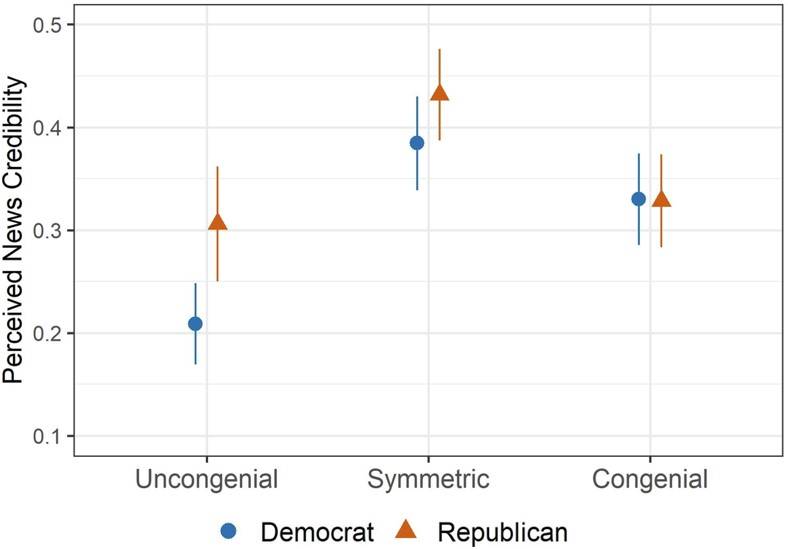
To examine how asymmetric coverage affects partisans’ source credibility perceptions, I conducted a survey experiment in 2020. Participants were asked to assess a news source based on a set of headlines where the majority of headlines challenged 1) Republicans, 2) Democrats, or 3) both parties equally (baseline condition). The condition where most headlines challenged Republicans was considered as uncongenial to Republicans and congenial to Democrats (vice versa for the condition in which most headlines challenged Democrats).
The results indicate that partisans perceive a source to be less credible when its coverage corrects their own party more often than the other (uncongenial asymmetry, i.e., most headlines challenge in-group), compared to when the source corrects each party at a similar rate. Contrary to popular belief that Republicans tend to be more resistant to uncongenial news and facts, Democrats reacted more negatively to uncongenial asymmetric coverage than Republicans. Even when a source challenged the opposite party more often (congenial asymmetry, i.e., most headlines challenge out-group), partisans found the source to be less credible than symmetric coverage. In fact, the results show that partisans found congenial asymmetry to be particularly less credible when a portion of coverage challenged their own party on a highly polarized topic such as immigration, which is the type of issue that fact-checking sites often cover.
This study highlights a difficult dilemma that fact-checkers face in their coverage decisions. While asymmetric coverage of political parties is at times needed in response to evidence, it can alienate partisans from both sides. We might believe that balance for its own sake should be avoided, but more symmetric coverage of political parties and further efforts to signal nonpartisanship can help build broader public trust in fact-checking sites.
Hwayong Shin is a Ph.D. candidate in Political Science at the University of Michigan. Her research investigates ways to mitigate the partisan divide and build common ground by increasing the credibility of evidence-based information and by invoking shared emotions and experiences. Shin is a Next Generation scholar at ISR’s Center for Political Studies and was awarded the 2022 Garth Taylor Fellowship in Public Opinion.
Post developed by Anne Pitcher, Rod Alence, Melanie Roberts, and Katherine Pearson
Secure elections are essential to democracy. ObSERV, a new study by researchers at the Electoral Institute for Sustainable Democracy in Africa (EISA) and the University of Michigan, with support from the University of Witwatersrand (Wits), presents a data collection methodology that improves the placement of election observers in order to improve the quality of their observations regarding the electoral process.
Election Observation Missions (EOM) seek to provide impartial observation of the electoral process in order to ensure the peaceful conduct of elections and to protect the rights of citizens to participate and to vote. On the African continent, however, the deployment of observers has been driven more by practical convenience than by a representative and systematic approach to deployment. Deploying observers just taking convenience into consideration potentially results in the collection of information from observers that is biased or misleading. Subsequently, this information can influence the content and tone of election reports that EOMs issue regarding the extent to which elections are “free” and “fair”.
Observer data that is collected more systematically and is geographically referenced provides a more accurate and representative description of an election. Such data can also be linked more fruitfully to other sources of contextual information – from local demographics and infrastructure to partisan polarization and the prevalence of political violence. ObSERV’s approach to deploying observers not only supports the goal of assessing how free and fair the current election is, it also enables researchers to analyze and better understand the causes of deeper threats to democracy, such as election-related violence and electoral fraud.
How does ObSERV work?
ObSERV uses computer algorithms to group polling stations into local clusters and then to draw a random sample of clusters to be visited by observer teams. Stations are clustered to minimize driving distance for each team, which must cover at least 12 stations on election day, using routing tools similar to those used by modern carpooling apps. Clusters are then categorized between regions and urban and rural locations, and the required number of clusters is selected randomly within each category.
Clusters are subjected to a security assessment, to ensure that observers can safely access them. Where the security assessment (commissioned by the observer mission itself) identifies safety concerns with a cluster, it is removed and a substitute is drawn using the ObSERV method. Once in the field, observers use EISA’s Popola monitoring system to report on a range of election-related activities, from rallies to voting. The information captured helps the mission evaluate the overall conduct of the election, and a substantial part of it is curated for inclusion in the ObSERV data set.
The value of ObSERV
By collecting observer data systematically and attaching geographical coordinates, ObSERV facilitates linking to other data sets relevant for analyzing and better understanding localized patterns of election-related violence. Applications are not limited to issues of electoral security and violence. The data collected also include station-level details such as long voter queues, missing materials, voters being turned away, and voters showing up at the wrong station.
ObSERV’s approach can be adapted for anywhere observation takes place, as it accommodates the practical challenges of deploying an observer mission. By applying systematic methods, observers end up observing polling stations that have previously been overlooked, improving the quality of election observation. Over time, use of the ObSERV method will contribute to a cumulative body of research data, promoting better understanding and analysis of African elections and ultimately help protect the integrity of the democratic process.
The theme of the roundtable presented on April 8, 2021, was “Can Democracy Survive?” Ken Kollman introduced the event, noting that the survival of democracy was a question that Miller and Converse worried about. Their ambition was to study survey respondents and political parties and candidates much like other scientists studied cells and atoms and planets, but they cared about the fate of democracy. Their legacy of scientific inquiry into politics and society continues at ISR and CPS.
Ken Kollman: Moderation and Extremism in American Political Parties
Ken Kollman examines partisanship in a forthcoming book written with John E. Jackson, Dynamic Partisanship: How and Why Voter Loyalties Change. The book, from University of Chicago Press, presents a framework that relates the changes that political parties undergo, and the partisanship of the electorate in four countries: the United States, the United Kingdom, Canada, and Australia.
Political parties are changing and adopting new issue positions, says Kollman, and the mass public pays attention to these movements. Both partisanship and voting decisions respond to the people’s evaluations of these partisan positions relative to their own interests.
Kollman makes the case that both major parties in the United States are perceived to have moved away from the center since 2008. These patterns include a continuation of the shift of the working class towards the right and the Republicans the shift of more educated voters to the left and the Democrats. These shifts have consequences for politics and for the survival of democratic processes.
Most people in the US hold their partisanship for life, but notable portions of the electorate change over the course of their lifetime. The most common reason they change is that they perceive the major parties as moving away from them or toward them on issues of fundamental importance, including economics and racial liberalism. They change much less often because of the performance of a party in office or because they change their ideology or issue preferences.
In The American Voter, Miller and Converse wrote about partisanship as a result of socialization; they argued that partisanship shapes the perceptions of events, of candidates, and the vote. Kollman and Jackson don’t necessarily argue with this. The American Voter portrayal of partisanship remains robust and is good at predicting the vote. In contrast, Kollman and Jackson focus on the dynamics of partisanship and how partisanship changes. Group memberships based on interests and elements of socialization determines partisanship. It’s malleable and they model it as a form of what’s called Bayesian updating, a method of modeling how people incorporate new information in their decisions.
Kollman and Jackson are continuing to analyze the patterns from the past to predict what’s going to happen in the future if the two parties take different positions. The chart below shows how different groups of voters would respond if the Democratic Party moved to the left. What they find, first, is that partisanship becomes more Democratic for every group as the Republicans become more extreme. African Americans are complex in that they prefer the state of the Democratic Party in 2016, but their partisanship actually drops away if the Democratic Party moves to the left or moves to the right. Among white voters, the Democratic Party would lose partisans (and votes) if it moved to the left.
The trends of both parties away from the political center are worrisome for many people. Extreme party positions, including the pursuit of extralegal strategies to either pass policies or hold and maintain power, could become more likely as parties become more extreme.
Rob Franzese: What Causes People to Become Political Extremists?
What explains the rise of far-right nationalist-xenophobic and rightwing populism in the United States and other developed demoocracies? Robert Franzese presented research to address this question.
Scholars have noted that the rise of anti-immigrant, anti-globalization, anti-elite, anti-government sentiments correspond to a sea-shift of white working class voters to the right. One explanation for this shift is the notion that people have been left behind socioeconomically, and experience angst as a result. While support for parties farther to the right increased everywhere, it is especially notable in regions experiencing economic hard times, demonstrating support for these economic explanations of voting behavior.
Surveys have examined whether the shift to the right was attributable to socioeconomic malaise and decline, or whether it was due to cultural status threat. The data from these surveys seem to suggest that the political shift resulted from preceved xenophobic threats and it doesn’t have anything to do with the economic conditions.
However, Franzese contends that this conclusion is both wrong and wrong-headed. Instead of either/or explanations for political shifts, he suggests that we think in terms of both/and. Both neighborhood socioeconomic malaise and xenophobic anxiety associated with cultural change are both part of a broader sense of socioeconomic and cultural threat, as described in the graphic below. Franzese emphasized the importance of heterogeneity of perceptions. Some people are more susceptible to demagogic railing against the elite, the media, and foreigners. Other people will be immune, and may even become more repulsed by populist appeals.
This approach shows that the socioeconomic conditions the individual experiences are partly contributing to social-cultural threat perceptions that produce support for extremism. It’s not just economic hardship that creates the response, but economic hardship contributes to the sense in some respondents that their group is being left behind.
Extremism, especially far-right extremism, is a rising threat to democratic society. Therefore, understanding better the provenance of this rising far-right extremism and concomitant rise in rightwing populism is urgently essential. Casting the possible causal processes as some xenophobic or socioeconomic threat perception is unhelpful. These processes are better understood as complementary.
Pauline Jones: Democratic Survival, Using Lessons from the Muslim World
Pauline Jones notes that many people think that democracy is either unlikely or impossible and due to familiar tropes that Islam and democracy are somehow incompatible.However she contends that democracy and Islam are not incompatible at all. Muslim democracies exist all around the world. Several Muslim-majority countries have transitioned to democracy in the latter half of the 20th cenury, and there are Muslim-majority democracies in multiple diverse regions across the world.
Survey research shows popular support for democracy among Muslims, and that Muslims are mostly supportive of democracy as a form of government, and they do not view democracy as incompatible with their religious principles or institutions. Furthermore, democracy itself is in a constant state of struggle to survive. Jones describes democracy not as an outcome, but a process toward resilience. Democracies are constantly undergoing a test of vitality.
There are two key dimensions to typologizing varieties of democratic vitality. The first is duration: the length of time that a country maintains a certain level of democracy since its initial transition to democracy. Both geographically and temporarily, it’s important to consider the context of that particular democratic state. The second dimension is trajectory: the overall trend in a country level of democracy since its initial transition to democracy. Trajectory measures how consistently a country has improved or maintained the level of democracy over time, since its transition.
To measure the level of democracy, Jones uses the Varieties of Democracy Electoral Democracy Index (DDI). This score focuses on the role of elections as the core feature of democracy, and includes aspects of the political system that increase the likelihood that elections will result in democratic outcomes. She then created a typology based on the dimensions of duration and trajectory, which describes four modes of democratic survival, depicted in the graphic below. Democracies are grouped into categories including striving, thriving, waning, and backsliding.
Striving democracies have short duration, but an upward trajectory. The thriving category is the best case scenario: long duration and upward trajectory. In the waning category there is neither duration, nor trajectory. Democracy is just not taking hold, and this is where you might see the transition away from democracy. Democracies in the backsliding category have long duration, but have a downward trajectory.
Jones investigated eight Muslim majority countries and fit them to these modes: Albania, Malaysia, Mali, Tunisia, Indonesia, Senegal, Kyrgystan, and Turkey. She found, surprisingly, that for that most of the Muslim-majority countries in the sample were striving are thriving.
The key takeaway from this research is that democracy is an ongoing struggle to survive. Jones challenged the audience not to think about democracy as meeting some threshold, but rather as a sort of ongoing struggle, and to think about it as varying degrees of vitality, as opposed to focusing on the mortality of democracy. This, she concludes, allows us to have some degree of cautious optimism. Democracy faces constant challenges; survival is just a matter of the degree of the threat and the strength of the institutions meeting that threat.
In every U.S. presidential election since 1948, the American National Election Studies (ANES) has conducted pre- and post-election surveys of a large representative sample of American voters. ANES participant interviews looked different in 2020 than they did in the past; the COVID19 pandemic made traditional face-to-face interviews impractical and risky. The study team began planning for the extraordinary circumstances in March, without any idea what the conditions would be when interviews began in August. The team pivoted nimbly to redesign the study even as the onset of data collection approached.
The majority of interviews in 2020 were completed as web surveys, some following an online format similar to one used in 2016, and others using an innovative mixed-mode design. Respondents to the mixed-mode surveys were randomly assigned either to complete the questionnaire by themselves online, or to take the survey with a live interviewer via a Zoom video link. Few surveys conduct live video interviews, but the ANES study team felt that it was critical to explore the use of this technology as a potential means of balancing issues of cost, continuity, and data quality.
To answer online surveys, respondents must have reliable access to the Internet and comfort using computers. Under normal circumstances, people without access to computers or the Internet in their homes can gain access in public settings like libraries or at their workplace. With many of these places closed due to the pandemic, online access became a bigger challenge. In mixed-mode cases where it was difficult to complete a web or video interview, interviewers contacted the respondents to secure a phone interview. Providing phone interviews helped the team strengthen sample quality by reaching respondents without access to the Internet as well as those who are less comfortable using computers.
Data collection for the 2020 surveys, out of necessity, departed significantly from the practices of the past 70 years of the ANES. The study team will continue to monitor and address the implications of these changes. In the end, the team was pleased to field a very high quality survey with relatively high response rates, thoroughly vetted questions, and the largest sample in the history of ANES.
Pre-election surveys
Pre-election interviews began in August 2020. The pre-election questionnaire is available on the ANES website. The questionnaire includes time series questions dating back to the earliest days of the ANES survey, as well as new questions that reflect more recent developments in the study of American politics. The ANES team must always be prepared to add a few questions late in the design process to capture substantial developments in the presidential campaign or American society. In 2020 the survey added questions about election integrity, urban unrest, and COVID-19, among other topics.
The investigators, ANES staff, and their survey operations partners at Westat monitored the data collection closely, in case further adjustments in procedures or sample were required. The final pre-election sample consists of over 8,200 complete or sufficient-partial interviews. This includes a reinterview panel with the respondents from the ANES 2016 Time Series. Over 2,800 respondents from the 2016 study were reinterviewed, more than three quarters of the original group.
Post-election surveys
Post-election interviews began on November 8, 2020, and will be completed on January 4, 2021. This post-election effort includes additional respondents who took part in the 2000 study of the General Social Survey (GSS). Due to the pandemic-altered timing of the GSS data collection, it was not possible to interview these individuals prior to the election. However, these respondents completed nearly all of the ANES post-election interview, plus almost ten minutes of critical questions that appeared on the ANES pre-election interview, and several additional questions suggested by the GSS team.
ANES staff will continue to review and clean the data into the new year, including checks of respondent eligibility that may alter the final sample in modest ways. Pending this review, the team expects response rates to come in slightly below the 2016 web response rates.
Overall, despite the challenges of this past year, the ANES study team was able to gather robust data from a large probability sample of Americans, extending the longest-running, most in-depth, and highest quality survey of US public opinion and voting behavior, at a critical juncture for American society and democracy. The team will continue to share updates, here and on the ANES website, as data from this survey become available.
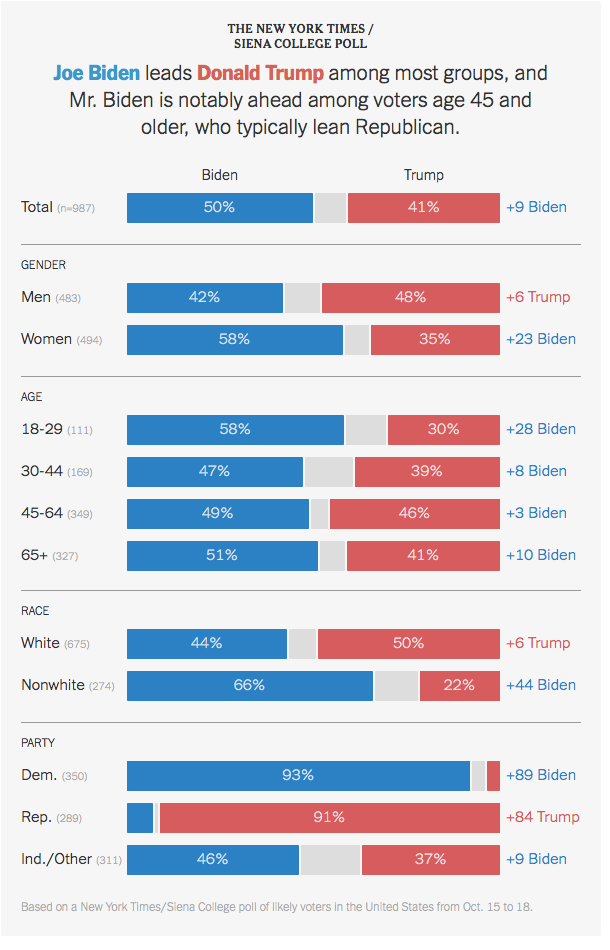
Vincent Hutchings outlined thedemographic shifts that are affecting levels of support for each party leading up to the 2020 election. As the makeup of the voting population changes in terms of gender, age, and race, the base of each major political party also changes. Hutchings presented results from a recent New York Times poll, which shows the state of the campaign as of October 2020. A recurring theme in the poll results is that Biden is performing better in the polls than recent Democratic candidates, while Trump is performing worse in the polls than previous Republican candidates.
Women have been a strong democratic constituency since 1980. Unsurprisingly, Biden is polling well among women in the current election cycle, performing even better than Clinton and Obama did in 2016 and 2012, respectively. Trump is underperforming in polls among women. Whereas recent Republican candidates have received around 40% support from women, Trump is polling around 35% support.
What is surprising is that Trump is underperforming among men, compared to recent Republican candidates. Typically, more than half of male voters support the Republican candidate; Trump is currently polling around 48% among men.
Younger voters are increasingly supporting Democrats. This is in part because younger voters are more racially diverse than older voters. Republicans typically capture around 35% of the youth vote, but in this cycle Trump is receiving even lower levels of support. Among older voters, the news for Republicans is even worse. Older voters tend to turn out to vote in higher numbers than younger voters. They are also more likely to be white, a constituency that leans Republican. In the most recent polls, Trump is polling at only 41%, which is significantly lower than expected for a Republican nominee; Biden is over-performing compared to recent Democratic candidates.
In the United States, whites have leaned Republican since 1968 – even higher during the Regan years. Trump is only polling around 50% support among white voters. The base of the Republican party has been non-Hispanic white voters for several decades. That share of the population has been declining, with important implications for support for both Democrats and Republicans.
The Importance of the Latino Vote
Angela Ocampo added to the conversation about the changing and diversifying electorate, with special emphasis on the growing Latino population. The non-white elegible voter population have accounted for 76% of growth in the electorate since 2000, said Ocampo. Latinos account for most of this growth, contributing 39% of the growth in the eligible voting population. The majority of this growth comes from US-born citizens who are turning 18 and becoming eligible to vote. In the 2020 presidential election, Latinos are projected to be the largest minority group among eligible voters for the first time.
Ocampo demonstrated that the differences in the growth of the Latino population at the state level is important. The proportion of Latinos in the voting population has increased sharply in key states, like California, Nevada, Arizona, and Texas. The emergence of these states as battlegrounds is largely attributable to an increase in Latino voters.
How consequential is the Latino vote? There has been a consistent trend toward increasing voter turnout among Latinos. Although immigration is often thought of as the most important issue for Latinos, polling shows that this group rates the COVID-19 pandemic, health care, and jobs as the most important issues in the upcoming election.
Ocampo notes that a record 32 million Latino voters will be eligible to vote in the 2020 election. Latino voters will continue to be influential in future elections. The Latino vote has grown, and the real question is how successfully candidates will be able to mobilize these voters.
The view from the states
Even if you only care about the outcome of the presidential election, said Jenna Bednar, you should still care about what’s going on in the states and in down-ballot races. Why? The electoral process is a product of the states. States structure elections by managing voter registration, identification requirements, and polling hours. States determine the qualifications of candidates and draw legislative districts. The electoral experience itself is determined by decisions about ballot design and whether states hold caucuses or primaries.
States shape the way we vote, and therefore the outcomes we get. Bednar reviewed the case of the butterfly ballot design in Palm Beach County, Florida, which led to voter confusion in the 2000 presidential election. Instructions for voters were confusing, and it was easy for voters to make mistakes. Following the irregular voting outcomes that stemmed from that ballot design, some people called for a standardized ballot. Bednar argued that slight differences in aspects like ballot design make for good experiments and innovation. She noted that ballots that are different in each state are not as easy to hack. Overall, these differences will rarely lead to problems.
Redistricting is a powerful way that states shape government at all levels. Bednar observed that Republicans have been more effective at drawing legislative districts to their benefit than Democrats. Democrats have been late to recognize the value of the states. Can we blame state governments for gerrymandering? Bednar said that while gerrymandering is not necessarily a good thing, you can’t blame a partisan process for having a partisan outcome. Many states, including Michigan, have adopted new laws to allow same-day voter registration, no-excuse absentee voting, and reforms to make the redistricting process less partisan. With all of this to consider, Bednar concludes that all voters should care about what’s happening at the state level, because the state laws and policies shape outcomes.
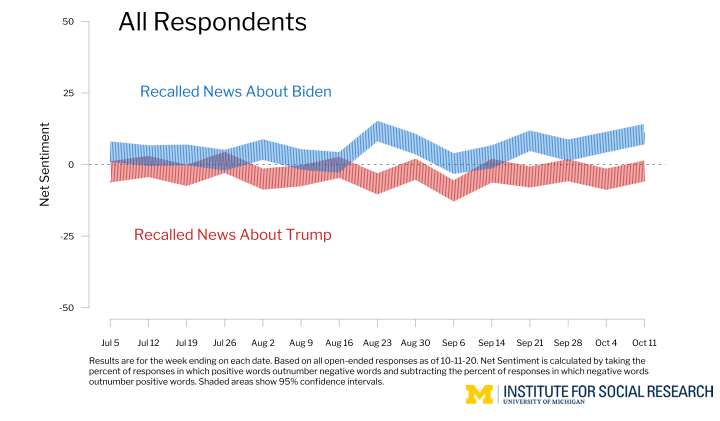
Stuart Soroka began his presentation by showing additional data from The Breakthrough, which assigns a sentiment to each response about the candidates, in order to track trends in the sentiment over time. This is not the sentiment of news content itself, but rather it’s the sentiment of the content that respondents remember. Soroka noted that the data show stability over time with a slightly positive average for Biden and a slightly negative average for Trump.
Sentiment of Recalled News about the Candidates
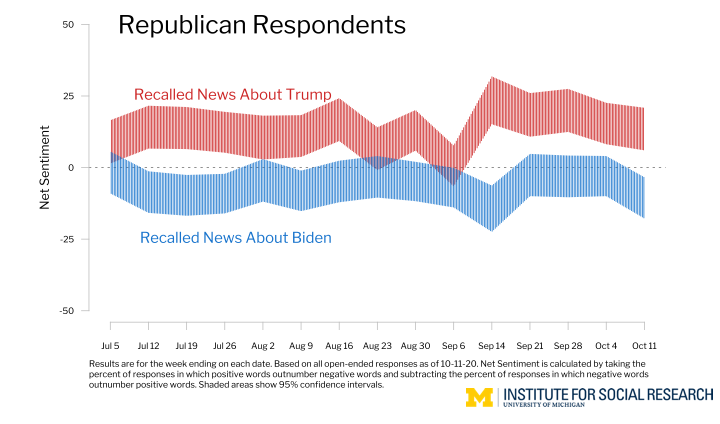
Amongst Republicans, Trump gets more positive recollections than Biden. Over the past month or so recollections of Trump have been a little more positive, albeit with a slight and statistically significant decline over the last month. Soroka said “That’s an interesting result because it runs contrary to what media observers might suggest. And contrary to what the Trump campaign’s own claims about negative coverage of Trump and mainstream media.”
Sentiment of Recalled News about the Candidates
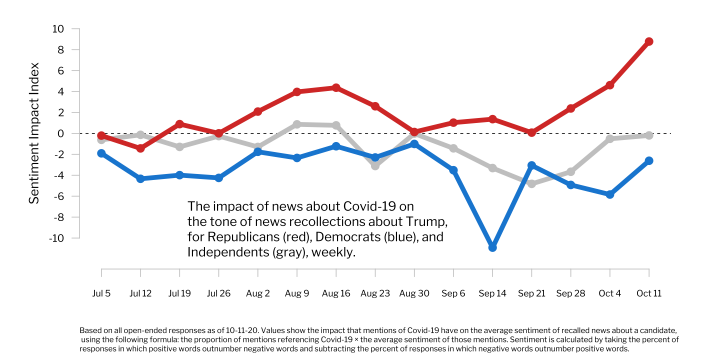
The Impact of COVID-19 on the Sentiment of Recalled News about Trump
Next, Soroka focused on the impact of COVID-realted content on recollections of news related to Trump for Republicans, Democrats, and independents. The data show that as COVID-related content is associated with negative sentiment among Democrats, it’s associated with increasingly positive sentiment among Republicans. That trend is not just the product of Trump’s quicker recovery in the week of October 11th. It’s evident in weeks prior to that as well. “In short,” Soroka said, “partisans see the same information in fundamentally different ways.”
The Impact of COVID-19 on the Sentiment of Recalled News about Trump
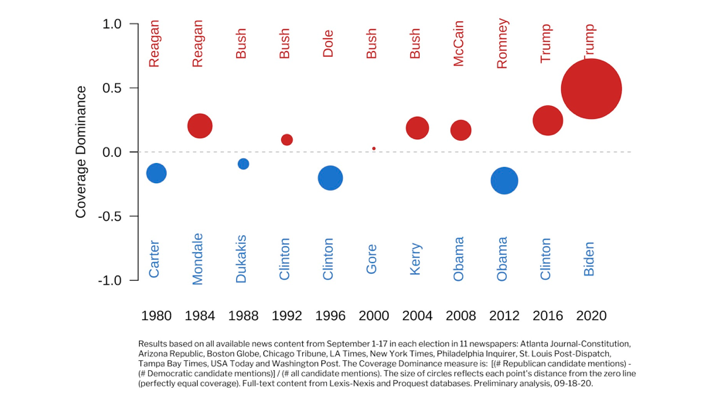
Switching to analyses of news content, Soroka showed data on the ratio of Republican candidate mentions to Democratic candidate mentions in the first week of September across 11 major newspapers for every election back to 1980. Incumbents get more coverage than challengers, and this has been equally true for both parties. We see this for Reagan, we see it for Clinton, we see it for Obama. That imbalance tends to be roughly a 20-percentage point gap. If there are ten candidate mentions, six of those are for incumbent, and four for the challenger. There are two outliers, first in 2016 Trump got incumbent style coverage in terms of imbalance although he was not the incumbent. After the election there was lots of discussion in the Academy, but publicly amongst journalists and the media as well, especially expressing concern that the media had focused too much attention on Trump.
Balance of Coverage, 1980-2020
Now that Trump is incumbent, Soroka said that Trump is getting outsized proportions of coverage. This year, for every ten-candidate mentions, seven to eight of them are about Trump, and two to three of them are about Biden. Are there differences across newspapers? Soroka said these differences are relatively slight, and have barely changed over time. He also noted that public opinion data show that partisans see information in different ways; researchers cannot reasonably assume that coverage of Trump is viewed as negative or positive on average.
Overwhelming coverage of Trump makes it very difficult for citizens to learn about Biden. In other words, Soroka pointed out, “the nature of media coverage that I have just reviewed makes it possible for voters to decide on whether or not to vote for Trump, but it gives very little information that helps voters decide whether or not to vote for Biden.” The imbalance of coverage is evident across media outlets throughout this campaign, and at a rate that is roughly twice as large as we’ve seen for the last 40 years.
Soroka concluded by highlighting the areas in which the media can play a critical role in fostering the well-informed citizenry. He directed the audience to https://mediafordemocracy.org to find a set of recommendations on how to improve coverage of this election, as well as various possible outcomes of this election. Soroka is one of the signatories of an open-letter, signed co-authored and signed by more than 60 professors, at more than 40 universities.They hope this will be a useful resource for people interested in the role that media can play in American democracy both leading up to and following the election.