
Apr 4, 2024 | ANES, ANES 75th Anniversary
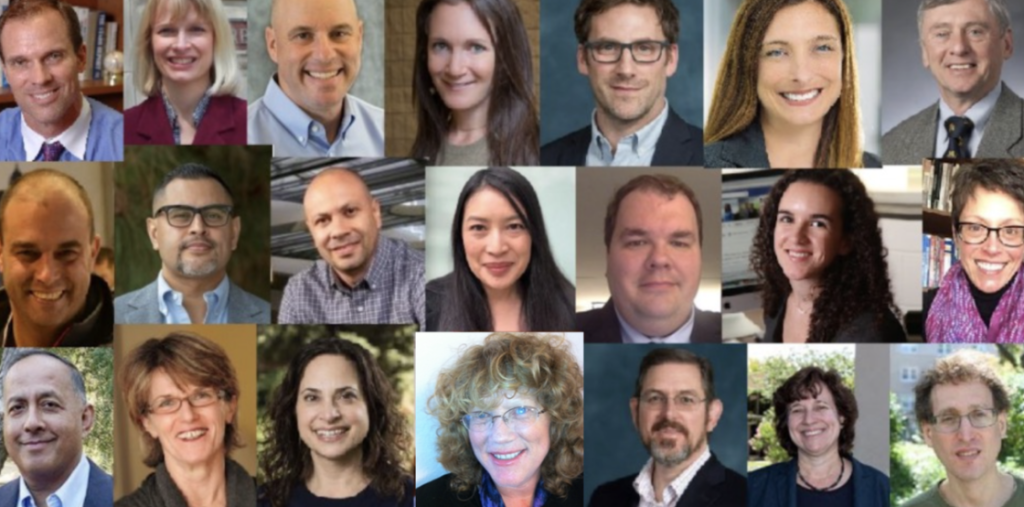
Every year, hundreds of publications, dissertations, and scientific conference papers are written using data from the American National Election Studies (ANES). The ANES has had a profound impact on the study of American political attitudes and behavior and the work of generations of scholars who have used this national resource. In recognition of the 75th anniversary of the American National Election Studies (ANES), the Center for Political Studies reached out to a few of those scholars to reflect on how the ANES impacted their research.
“To my mind, the ANES has been the single most important resource in my career in political psychology.”
–David O. Sears, Distinguished Professor Emeritus, UCLA
“When I was a graduate student in the 1970s I thought the study of American democracy was the study of public opinion and the study of public opinion was working with ANES data. My favorite party game was “Michigan Marginals” – competitive guessing the response distributions to questions in the NES codebooks. I’m older now and enthusiastic about different things, but I still believe the ANES is one of the world’s finest social science institutions, with its greatness only growing as the Time Series extends. I was incredibly lucky to have ANES data for my dissertation and later work, as have been hundreds of others.
“I would like also to say a few words about Warren Miller and Steve Rosenstone, the leaders of ANES in its formative period. I knew them at close range as a member of the ANES Board of Overseers and am still in awe. A couple of anecdotes: ANES data were released to the public at a set time and no one, not even Warren Miller, could peek ahead of time. I still remember him hovering nervously over a new data release, waiting until the clock reached noon to flop open the book to see how the numbers for his beloved variable, Party Identification, had been affected by the recent election. And Steve Rosenstone, a scholar of turnout, leading a study that concluded ANES’s investment in validated vote report was creating as many errors as it was correcting and should be terminated. The integrity, foresight, and political skill of these two leaders was an inspiration to behold. Near the end of my career now, I’ve been associated with many academic institutions, and I have no hesitation in saying that the ANES they led was hands down the finest.
“And can I end a tribute to ANES without mentioning Phil Converse, the greatest scholar of anything I know about? I never really knew him, but I wouldn’t be me without him.”
– John Zaller, Professor Emeritus of Political Science, UCLA
“I will forever be indebted to the ANES. Data from the cumulative file served as the basis of one of my dissertation essays, as well as my first solo-authored publication. It’s not an exaggeration, then, to say that the ANES played a big role in landing me my first (dream) job at Brown. That’s among the many reasons I was honored to serve on the Board for the 2016 election cycle. I can’t imagine a time when I won’t rely on ANES data for research and teaching – there’s no better source for trends in U.S. political behavior and elections.”
– Jennifer Lawless, the Leone Reaves and George W. Spicer Professor of Politics and Professor of Public Policy, University of Virginia
“I became a behavioral political scientist that day in the early 1960s when I first touched an “analysis deck” of the 1956 Michigan Election Study (not yet called ANES). Sixty or so years later the excitement of that moment is still with me. A fourth of a continent away from Ann Arbor and as an undergraduate I could test ideas that, at least so far as I knew, had never occurred to anybody before. My testbed then was the novel instrument called the counter-sorter and the method was literal cross-tabulation. I immediately began to think of myself as a voting behavior analyst, even before graduate school. And it stuck. Even though my scholarly trajectory has switched away from the micro behavior questions that initially motivated me, I have never been weaned from the ANES. I have exploited every biennial or quadrennial study and am sure that will eventually include the yet to come 2024 study — even in retirement. My debt to the ANES is everything I am.”
– James Stimson, Raymond Dawson Distinguished Bicentennial Professor of Political Science Emeritus, University of North Carolina at Chapel Hill
“Directly observing political behavior is important and often the most valid measurement—but we also need to understand what goes on in people’s heads. For that, surveys are indispensable. But not every survey is the same. The ANES provides a long-running, credible benchmark for many survey-based measurements in political science. Its historical value can’t be argued with, yet its significance in contemporary political science is just as great: Thanks to unrivaled resources and the pooled experience of many experts, the ANES continues to form a foundation on which all of us can build.”
– Markus Prior, Professor of Politics and Public Affairs at Princeton University
“The ANES time series has been invaluable to my research—at that of many other social scientists—on generations. This research focuses on whether Americans differ depending on when they were born and what they experienced when coming of age, and on whether generational replacement is fueling social and political trends, such as partisan realignment and dealignment; declining civic engagement, political participation, and trust; and growing secularism, liberalism, egalitarianism, and polarization. Studying generational dynamics requires what the ANES time series supplies: repeated population-based surveys stretching across decades. With each additional study, we gain more leverage for understanding the interplay of politics, history, and demographics.”
– Laura Stoker, Professor Emerita of the Graduate School in the Department of Political Science at the University of California, Berkeley
“My career as a political scientist is unimaginable without the ANES. I’ve been exploiting the wealth of data produced by the time-series studies and a variety of auxiliary studies for five decades. I’ve used them for dozens of journal articles, from my earliest in the 1970s through this year. NES* data were a prime inspiration for, and remain a core component of, The Politics of Congressional Elections, now in its 11th edition, and they have been important to my two more recent books on public opinion and the presidency. I doubt there are many more avid consumers of ANES data.
“Equally if not more important to my professional life was my involvement in helping to produce the data. I was toiling in obscurity as an assistant professor at Trinity College, working on a project that had me appending campaign spending data to NES data (using self-typed punch cards) and had the idea that the survey would be greatly enhanced (and my workload greatly reduced) if the studies included contextual data—on such things as campaign expenditures in the respondent’s district, of course—along with the survey data. My mentor, Dave Mayhew, suggested I make a proposal for the 1977 NES conference that would be considering ways to investigate congressional elections. I did, was invited to the conference, and ended up on the NES Committee on Congressional Election Research for the next decade, eventually chairing it. Later, I also served on the NES Board of Overseers and in that capacity chaired the committee that designed the 1990 Senate Election Study.
“From the beginning, working with NES was a fantastic experience. Not only did I get to see some of my ideas (usually greatly improved) work their way in to study designs and questionnaires that became the data I later analyzed, I also got to work with and befriend the finest election scholars from three generations: my heroes from the generation of Warren Miller and The American Voter, the hot shots of my own cohort, and a younger group of budding academic stars telling us how to get election studies right. Many became lifelong friends. If I tried to name them all I would use up all my space (for reference, most are thanked in the prefaces to PCE). I got a lot of my education as a social scientist well after graduate school, and my involvement with the ANES community was at the heart of it.”
*The ANES was known as the National Election Studies (NES) from 1977 to 2005.
– Gary Jacobson, Distinguished Emeritus Professor of Political Science, UC San Diego
This post is part of a series celebrating the 75th anniversary of the American National Election Studies (ANES). It was developed by Tevah Platt.
For a future post, we’re interested in your input on what the ANES has revealed about key moments, decades, or patterns in American history. Tell us what you think with this quick Google form.
Mar 5, 2024 | ANES, ANES 75th Anniversary
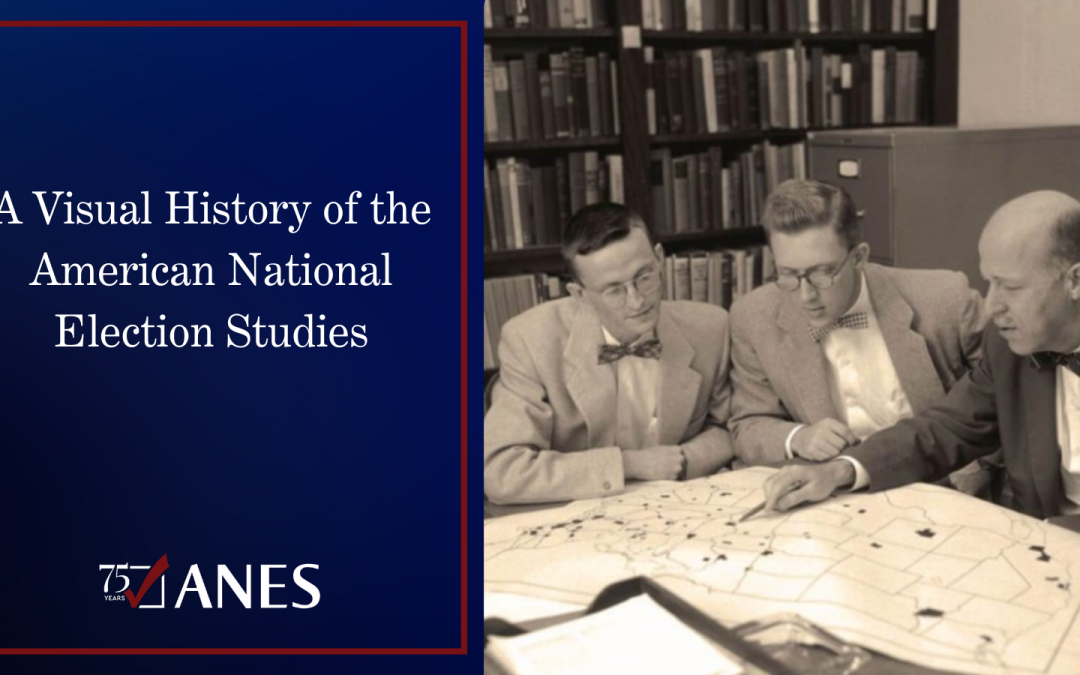
The American National Election Studies (ANES) is the definitive study of American political attitudes and behavior, recognized for setting “the gold standard” in survey research in political science. The project has surveyed American citizens before and after every presidential election since 1948. With a time series of core questions asked continuously across many elections, these surveys provide a window onto the sweep and the pivot points of historic change in American public opinion. In recent studies, new questions comprise about 30 percent of each survey, allowing users to understand contemporary issues that might be driving American political dynamics. Funded by the National Science Foundation since 1977, the ANES is both national scientific infrastructure and a touchstone of political science research.
The Beginning (1948-1952)
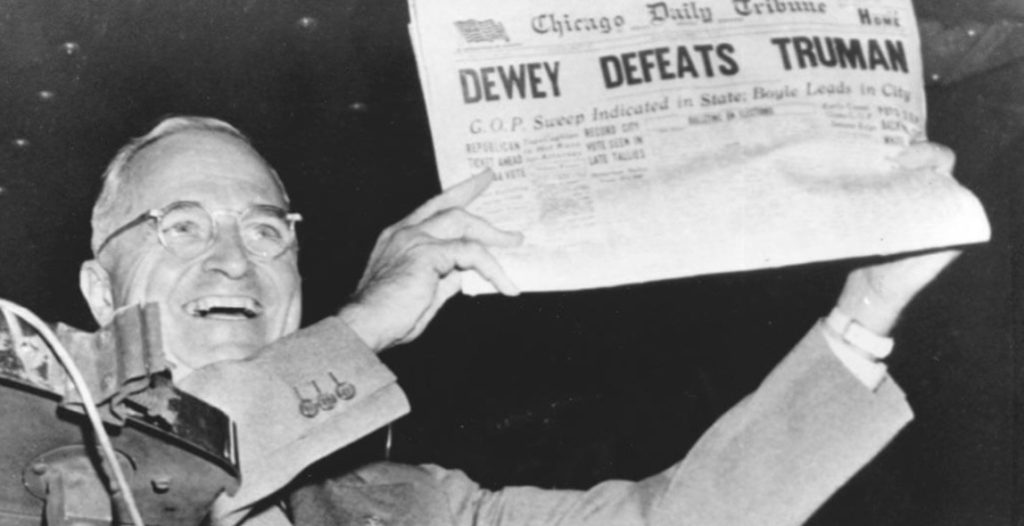
In 1948, under the direction of Angus Campbell and Robert Kahn, the Survey Research Center carried out what is viewed as a pilot study of the national electorate. Fortuitously, the study pioneered survey sampling methods that outperformed commercial polls in predicting the presidential race that year. The “Dewey Defeats Truman” debacle– when the Chicago Daily Tribune famously ran the incorrect banner headline on its front page following Truman’s upset victory– provoked an inquiry into election survey methodology. on matters such as sampling and personal interviewing that helped set a new standard for scientifically valid surveys, market research, and public opinion polling. The first Michigan monograph, The People Elect a President, by Robert Kahn and Angus Campbell, was based on pre- and post-election interviews of 662 respondents: and those original survey responses are still available from ICPSR.
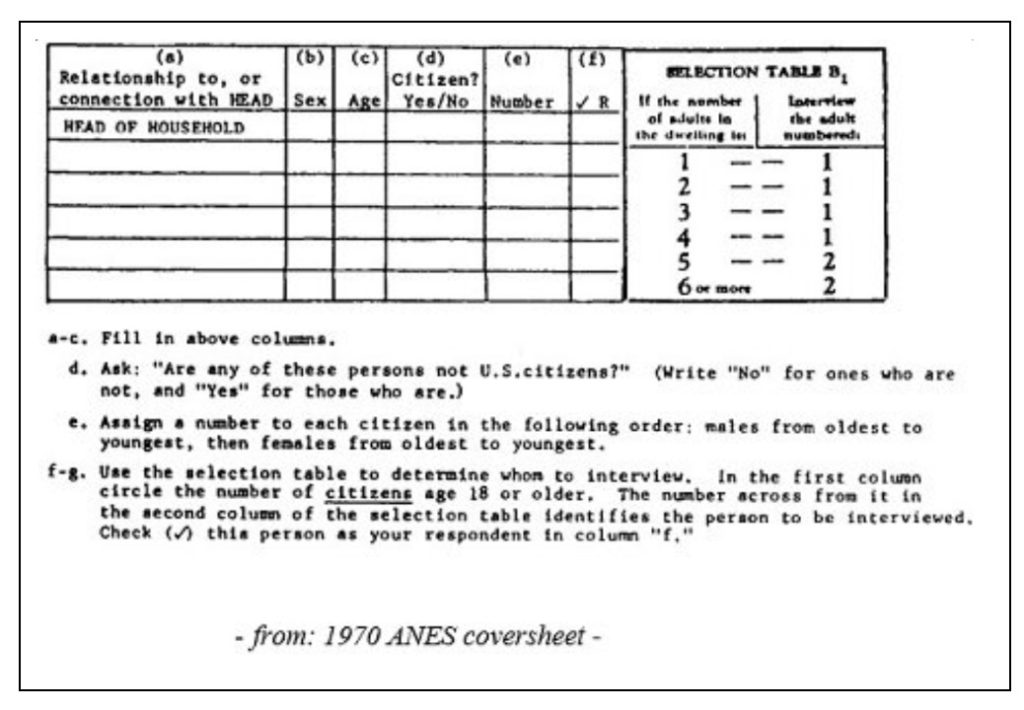
Since the early days of the study, a central goal has been to develop and implement the newest and best methods for conducting survey research. For example, the 1948 survey introduced the Kish grid, a method for randomly choosing household respondents, pictured below. As John Aldrich wrote in the ANES’s 2017 board report, the statistician Leslie Kish was also responsible for the “multi-stage cluster sampling approach that still defines the current backbone of the ANES study design.”
The Michigan Election Studies (1952-1976)
When Warren Miller was hired as the assistant study director of the Survey Research Center, his dissertation proposed a project that was adopted almost in its entirety in the 1952 election study, and used for planning further studies that became known as “the Michigan Election Studies” located at the University of Michigan Institute for Social Research (ISR). The Michigan studies would cover all 13 presidential and midterm elections between 1952 and 1976.
The Fifties
It’s worth pausing to imagine the intellectual environment of ISR in its early years. As former ANES PI Virginia Sapiro wrote in remarks on the ANES’s 50th anniversary, ISR’s formation in 1948 was based on a series of connections that brought founders of the blossoming new field of social psychology together with an interdisciplinary group of social scientists. This included psychologists such as Dorwin Cartright, Jack French, and Robert Zajonc at the Research Center for Group Dynamics, whose work on “ego strength” influenced concepts of “personal competence” and “political efficacy” that first appeared in the 1952 Michigan election study. In the years after World War II, there was wide interest in the study of authoritarianism and democratic norms. The election study benefited from this new force of social scientists at ISR, trained in new methodologies, many out of the Department of Agriculture and the wartime Office of Strategic Services. ISR had technical and mechanical resources, such as punch card machines, to code and analyze data, and teemed with opportunities for intellectual collaboration. For the election studies, Sapiro wrote, this period was marked by “the initiation of creative expansion of the research program that ultimately transformed it into one of the most influential social science projects of the post-World War II era.”
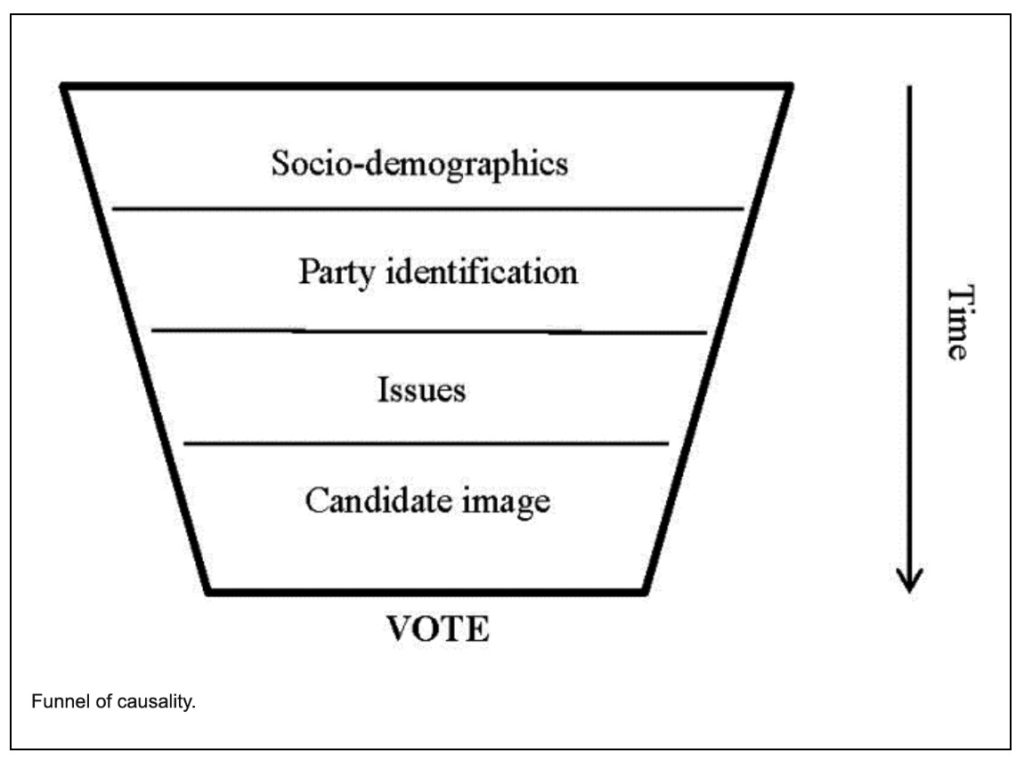
Over its first decade, the Michigan collaborators developed what’s known as the “Michigan model,” a theory of how voters make choices based on a “funnel of causality” involving sociodemographic factors, party identification, and, shorter-term, issue orientations and candidate evaluation.
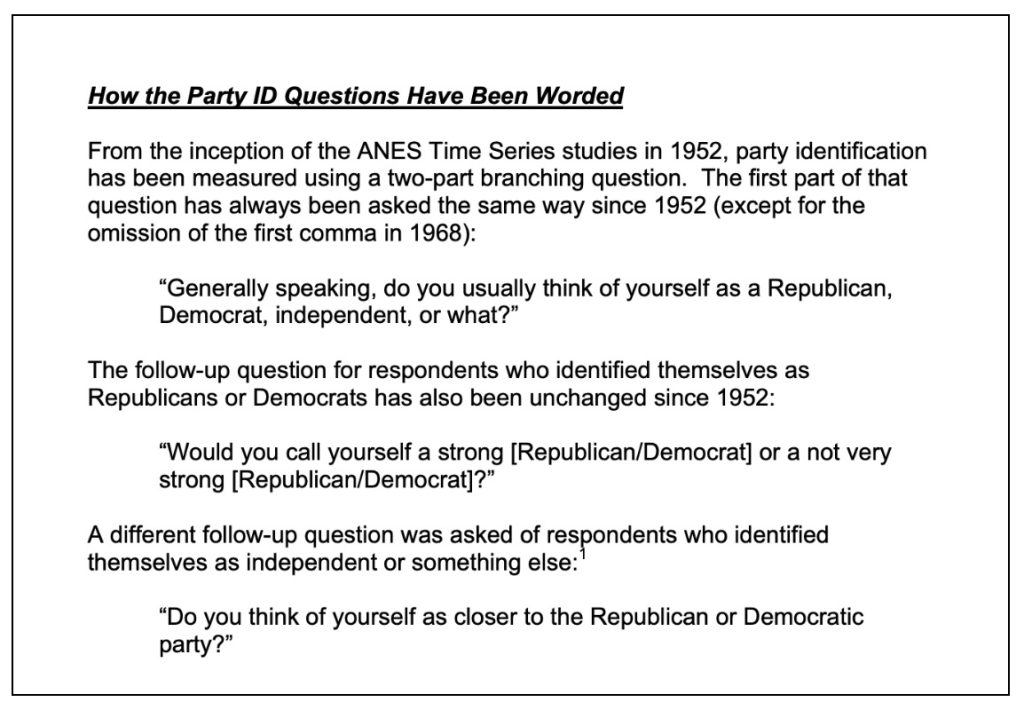
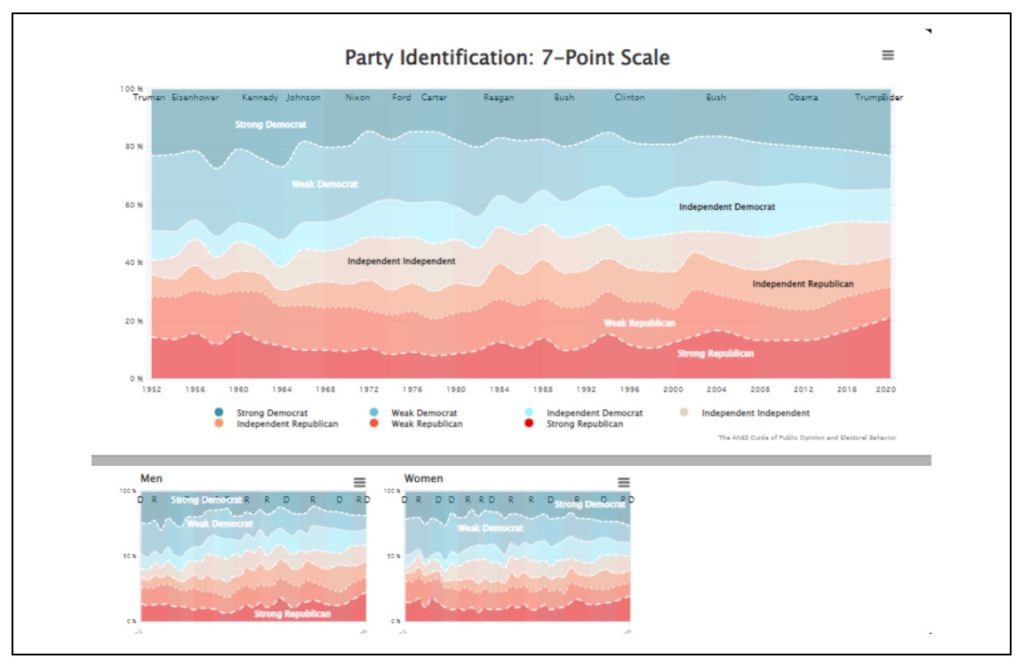
The 1952 ANES survey introduced the new measure of “party identification” to assess whether voters possessed deep psychological attachments to one of the parties. The idea that people acquire long and stable affinities for specific parties that transcended feelings about candidates and issues in any one election, then novel, has become central to our understanding of how people vote. Most scholars of political science now see this as the core predisposition shaping political beliefs and behavior.
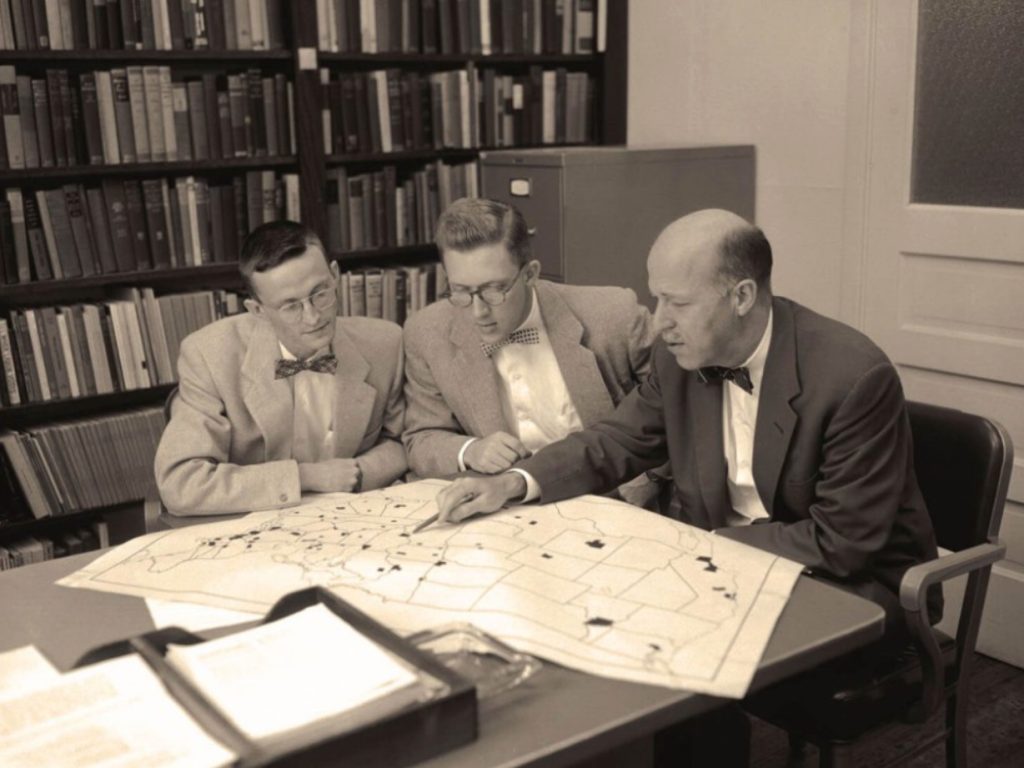
Pictured in this photograph from the Bentley Historical Library, from left to right are Philip E. Converse, Warren E. Miller, and Angus Campbell, circa 1956, as they review the sampling design of their new survey. Philip E. Converse and Donald E. Stokes, then promising graduate students, also joined the team that year.
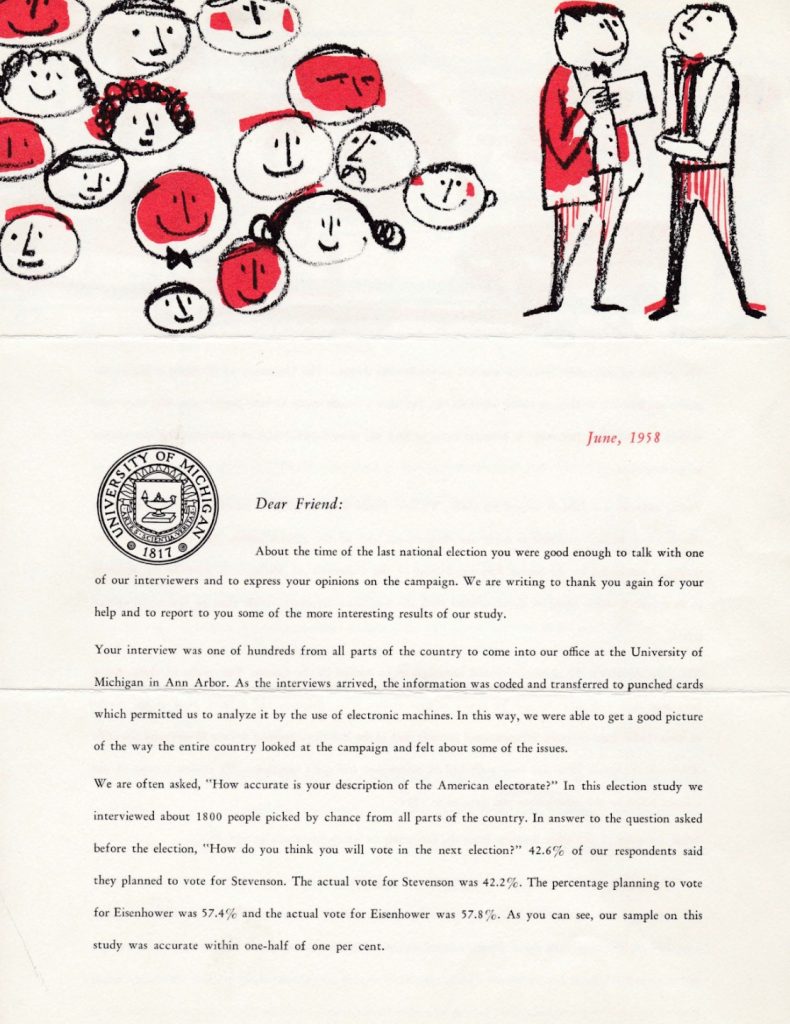
In the pictured letter, we see an example of a respondent letter mailed to survey participants after each election. This example, from 1958, describes the punch card system used to analyze interview content and the accuracy of the results. (The 1958 election study found the percentage planning to vote for Eisenhower was 57.4%. The actual vote was 57.8%.) This letter was sent by Angus Cambell, PI of the study from 1948 to 1960, to respondents who participated in the 1956 Time Series survey. (Find more about the history of the ANES principal investigators here).
The Sixties
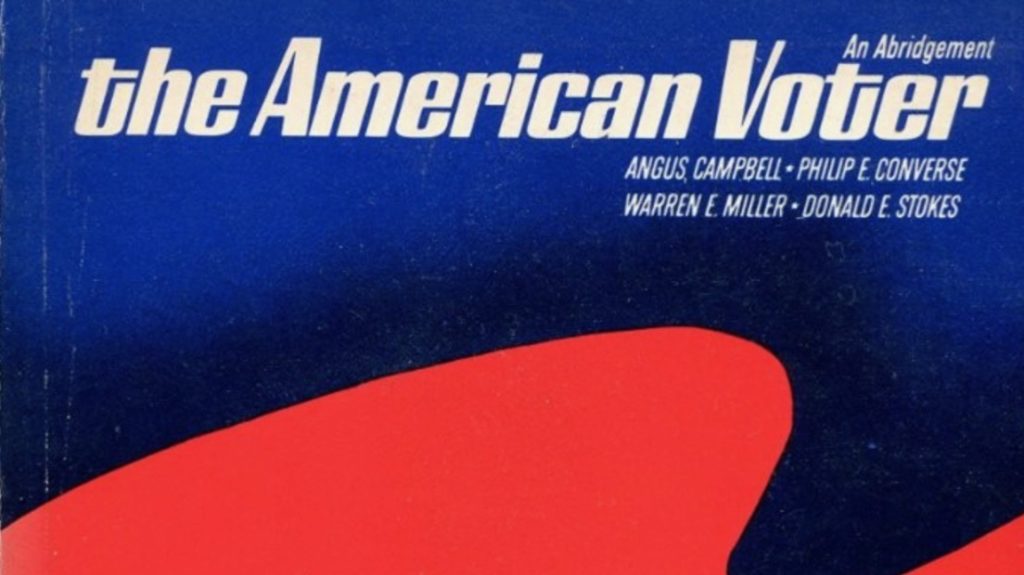
Capping the work of the prior decade, The American Voter, written by Campbell, Converse, Miller, and Stokes, was a seminal study based on ANES data, published in 1960. It launched a new field of research into the beliefs and attitudes that shape voter decision making.
The studies of the 1960s were responsive to changing national political circumstances. In 1960, for example, new questions emphasized the role of religion and helped capture the extent to which anti-Catholic sentiment reduced Kennedy’s margin of victory. In 1964, the study added a special sample to better understand the politics of Black Americans. In 1968, the survey addressed militarism, racism, and as Warren Miller phrased it, “[issues] having to do with the rather unique appeal of George Wallace to the older voter.”
The 1960s also occasioned what may be the most dramatic shift in American electoral history this century. As described by Rutgers Professor Richard Lau, the Michigan studies captured “the major realignment of the American party system that occurred mostly during the 1960s because of the civil rights movement, desegregation, and busing.”
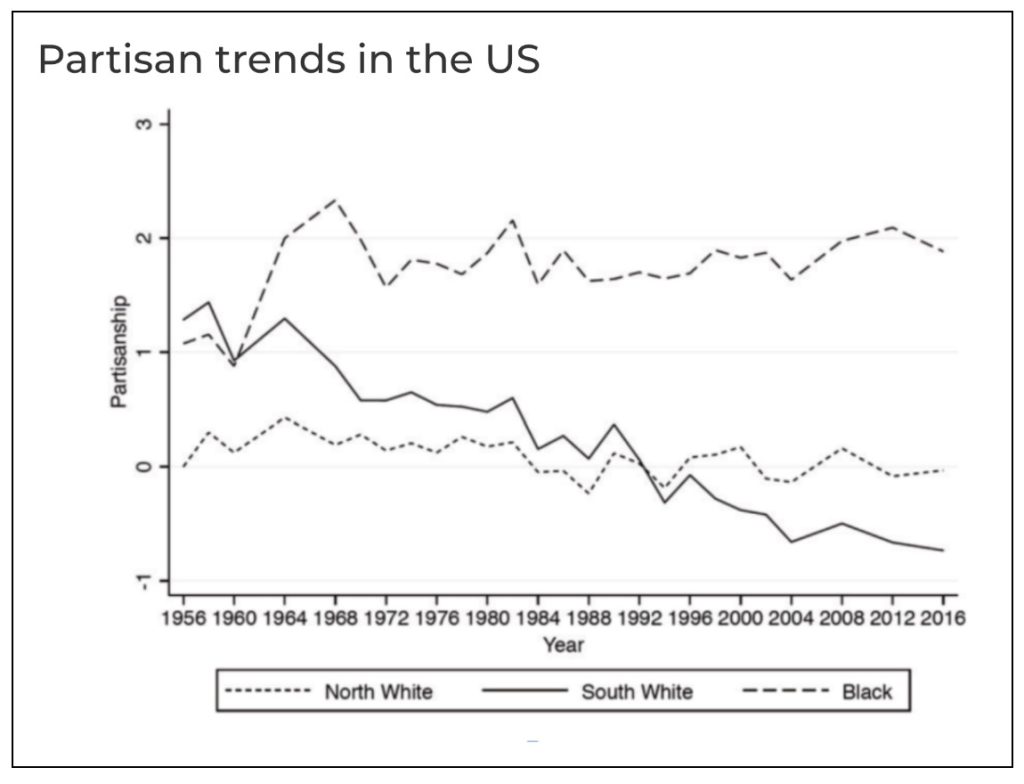
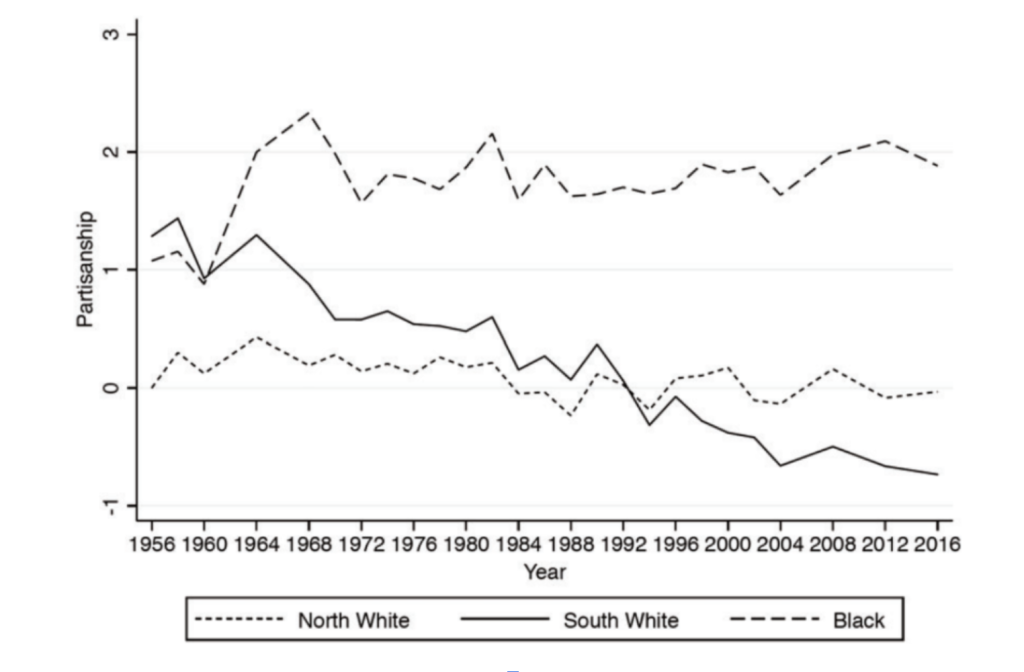
The graph below from Dynamic Partisanship: How and Why Voter Loyalties Change by Ken Kollman and John E. Jackson plots partisanship among three groups of the U.S. electorate– northern whites, southern whites, and Black voters– from 1956 to 2016, with Democratic partisanship increasing along the y axis. Northern white partisanship is particularly stable; Southern white partisanship shows a graduate shift from “moderately Democratic” to “weakly Republican” over six decades. But the 1964 election stands out as a critical turning point in African American partisanship, making a dramatic leap and remaining consistently high on the Democratic scale after the passage of the Civil Rights Act.
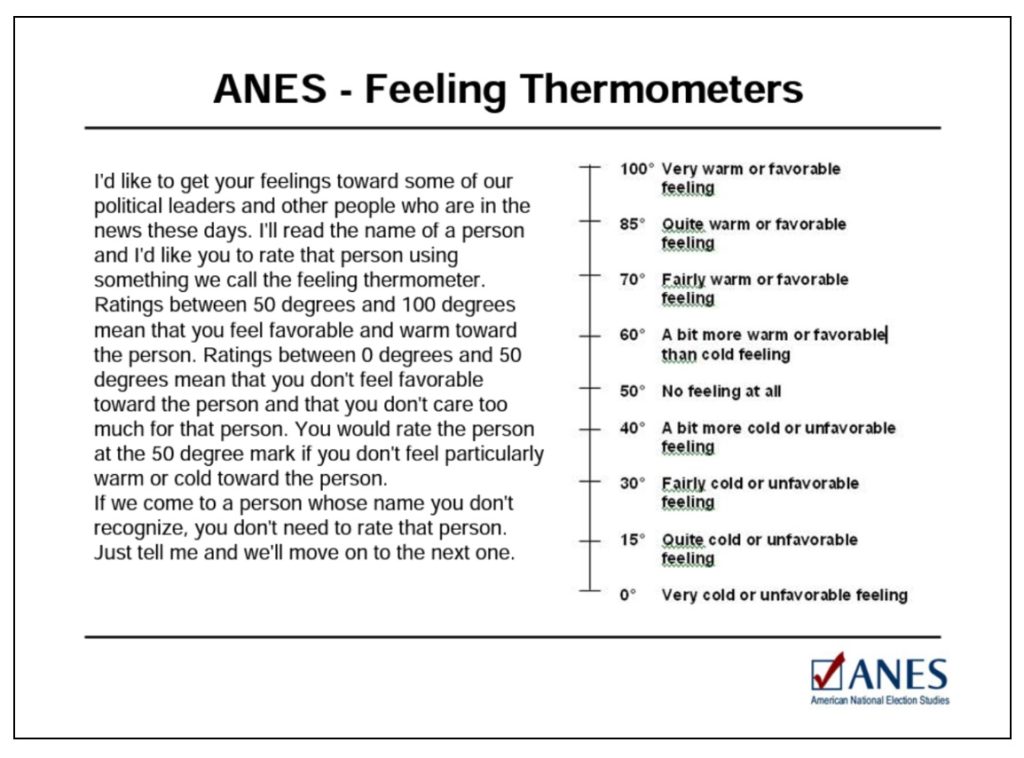
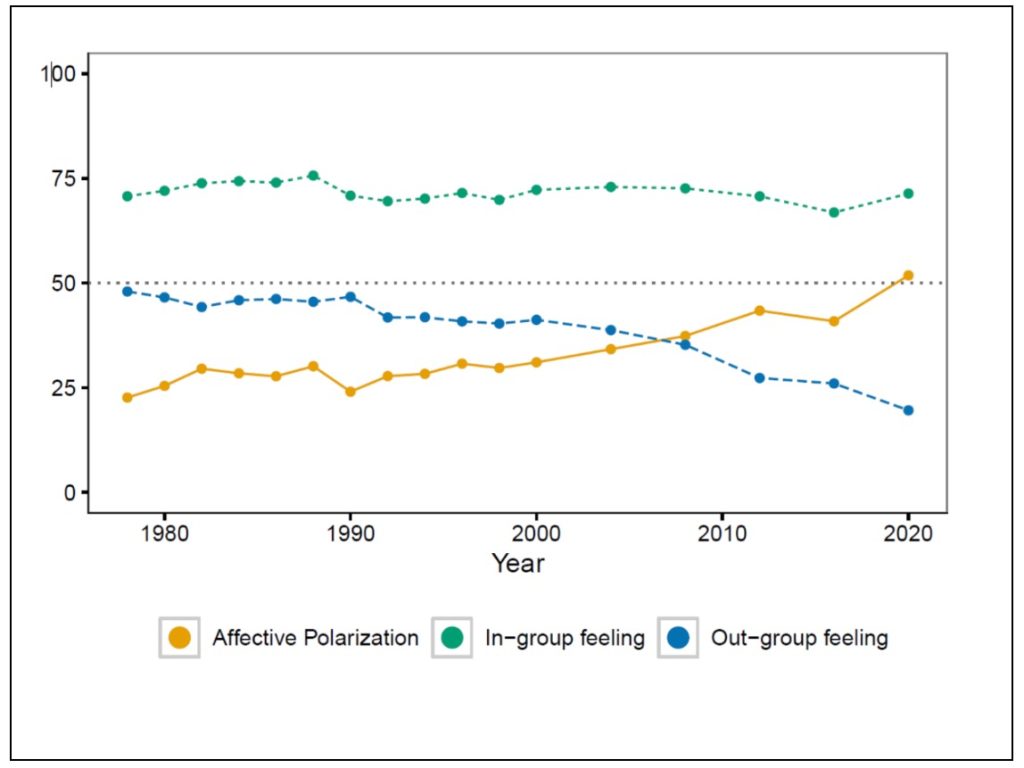
The introduction of the “feeling thermometer” in 1964 was a key innovation in measurement that has helped to capture “affective polarization”– the shifting feelings people hold toward political parties– over time. The feeling thermometer remains a widely used tool for measuring how voters feel about a specific person or group.
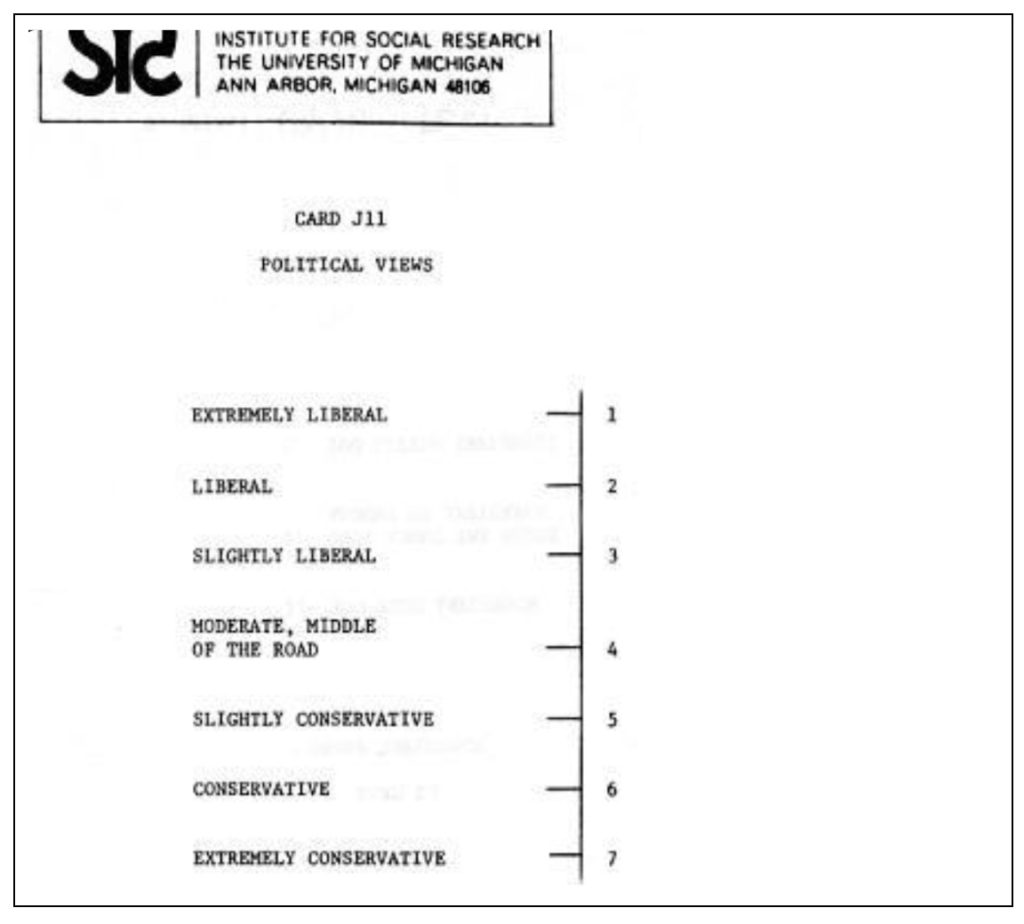
The other major innovation in measurement dating back to the 1960s was the “seven-point Likert scale,” introduced in 1968 and now omnipresent in survey measurement. The invention of this scale came out of the work of Richard Brody and Sidney Verba in a study of attitudes toward the Vietnam War.
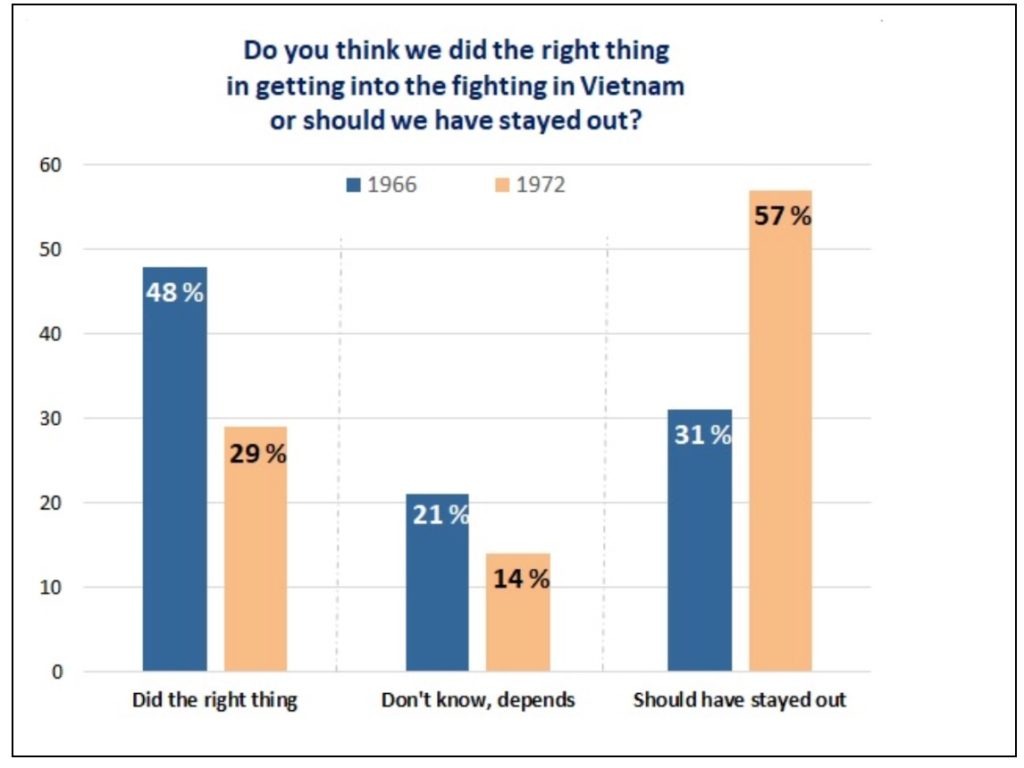
The project began asking Americans in 1966 if the US “did the right thing in getting into the fighting in Vietnam.” The 1972 survey results documented the shifting tide of public opinion. While 48% of respondents in 1966 thought the US had “done the right thing in getting into the fighting,” that number by 1972 had dwindled to 29%.
The Seventies
In 1970 the principal investigator for the election studies became the newly founded Center for Political Studies (CPS) at ISR. By this time, ANES historians note that the studies had become an extraordinary resource for large segments of the social science research community: “Placed in the public domain by the archival and data dissemination facilities of the Inter-University Consortium for Political and Social Research (ICPSR), the Michigan studies provided the quantitative data base for a very large number of important investigations in several disciplines, supporting social research carried out by scores of investigators, and utilized by hundreds of teachers and thousands of students.”
In the words of Warren Miller, the 1970s was also the occasion for “systematic attempts to broaden the input of the user community in the specification of Michigan election study content.”
A new area of focus for the study, dating to 1974, was the impact of mass media on electoral behavior– an area that has become a discipline in itself.
It’s fair to say the election studies were also impacting mass media by providing not only information but key concepts for analytical methods used to understand public opinion. Warren Miller helped various networks to develop their election coverage, and as a consultant for ABC News, Miller coined the term “projection” that remains in use today to describe estimated election outcomes.

Photo source: Chance Magazine, courtesy of Jack Moshman. Mike Traugott, Jerrold Rusk, and Warren Miller with members of the ABC News team. Circa 1968.
Questions about trust in government have been asked since the very early days of the election studies. The vast majority in early years believed that “not many” or “hardly any” in government were crooked. After Watergate evidence was released to the public in 1974, the percentage fell by 9 points. (Trust in government would again diminish over time after 2000).
The National Election Studies (1977-2005)
In 1977, the National Science Foundation (NSF) designated the National Election Studies (NES) as “a national research resource.” Its governing board that year referred to the NES as a “national resource for the social sciences analogous to high energy accelerators, telescopes, or oceanographic laboratories.”
Its mission was extending the time series collection of core data, and developing instrumentation and study designs to facilitate the testing of new theories of voting and public opinion. The principal investigator of the National Election Studies would now be supervised by an NSF-appointed board, whose charge included identifying the broad interests of the national and international research communities served by the survey.
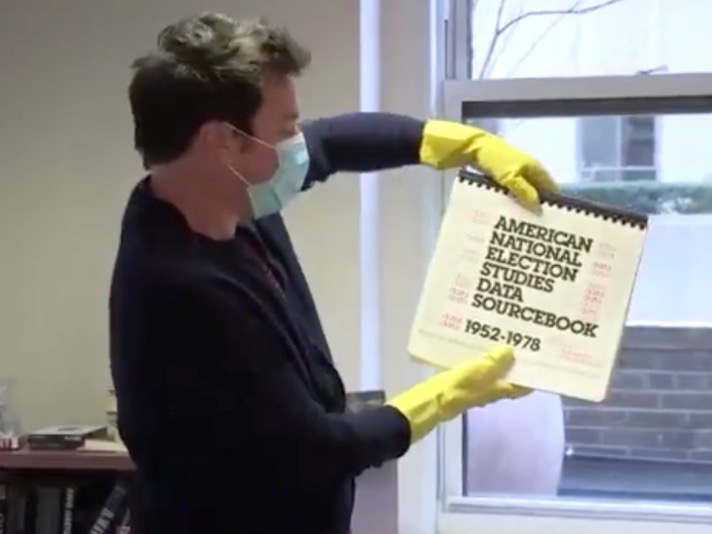
In 1979, Harvard published the ANES Data Sourcebook 1952-1978. Providing tabular percentages across years for measures repeated comparably over the multiple Time Series studies, the sourcebook was a predecessor to the online ANES Guide to Public Opinion and Electoral Behavior. The ANES’s Time Series Cumulative Data File would later become the most downloaded dataset in the ANES archive. Pictured below in a 2021 Tonight Show segment, Jimmy Fallon picks up a copy of the Sourcebook found while cleaning out the MSNBC office of political analyst Steve Kornacki.
The Millennial Shift
Technological changes at the turn of the millennium influenced the collection, development and distribution of the NES data. In 1980, the first phone interviews were conducted by NES administrators who recorded responses on paper questionnaires. Computer-assisted telephone interviewing (CATI) and personal interviewing (CAPI) techniques were used and compared against face-to-face interviewing techniques in the 1982 Methods Comparison Study. The subsequent growth of the internet radically altered communication with NES’s user community and the distribution of its data. In the late 1990s, the NES distributed data through its FTP site and released a CD-ROM that contained the data and supporting documents of all the studies it had mounted to date. The advent of the internet also made new sampling techniques available, supplementing the NES resource that remains unique today in its sampling and measurement quality.
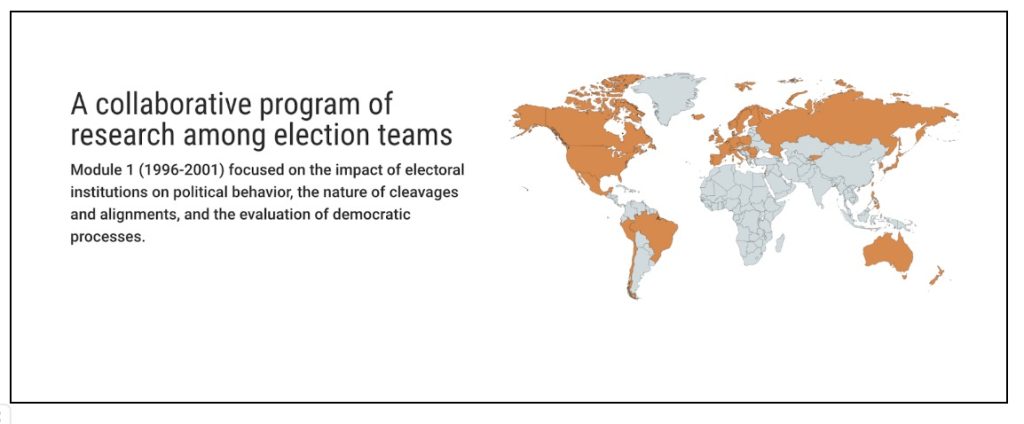
This period was also pivotal for the NES moving from national barometer to global participant. The NES had long been a model for the development of election studies around the world. Then in the early 1990s, the NES was a founding member of the most significant comparative study of democratic politics, the Comparative Study of Electoral Systems (CSES). Every five years, election studies participating in CSES collaborate on developing a new module of questions that is then included in post-election surveys globally, enabling analyses that compare citizen attitudes and behaviors across countries and different electoral contexts. The NES incorporated the CSES for the first time in its 1996 data collection; the year 2024 will be the seventh time that the CSES has been included in the NES.
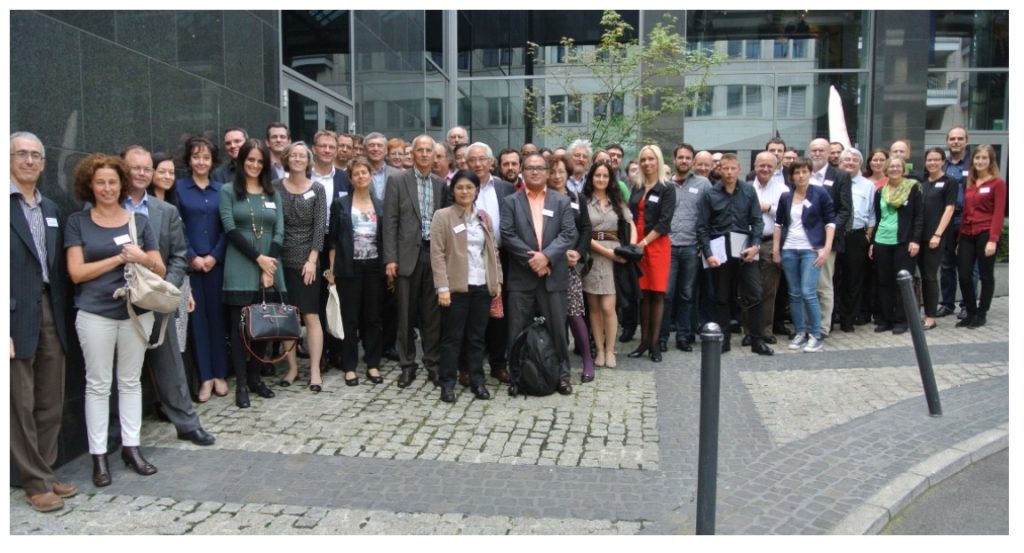
Pictured below: attendees of the 2014 CSES Conference and Plenary Session in Berlin, organized by the Wissenschaftszentrum Berlin für Sozialforschung (WZB) and supported by the Center for Political Studies.
The American National Election Studies, 2005-present
In 2005, the ANES began a collaborative effort between the Institute for Social Research at the University of Michigan and the Institute for Research in the Social Sciences at Stanford University.
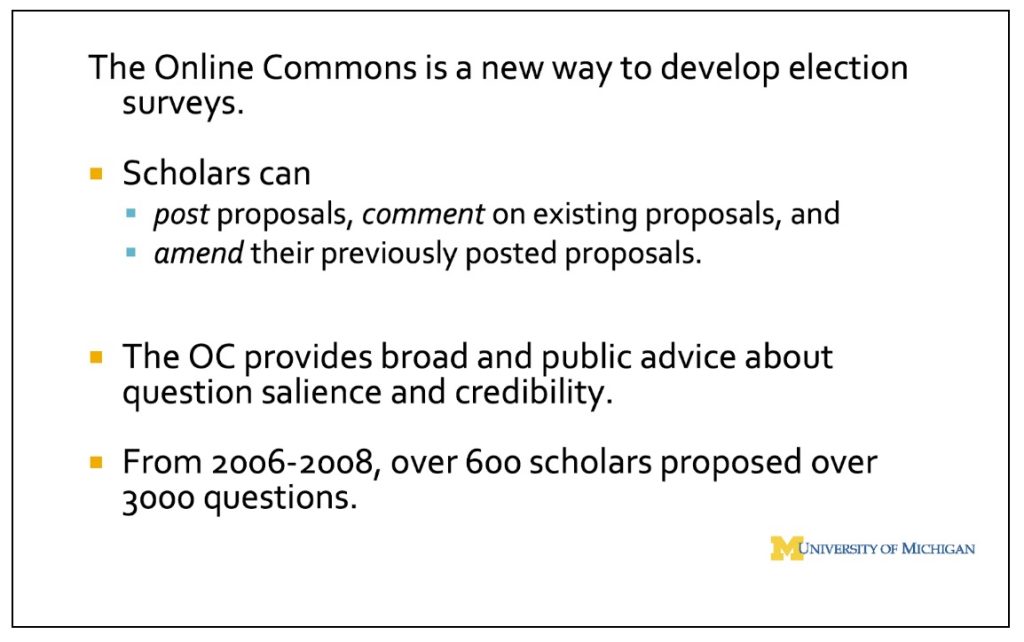
In 2006, PI’s Arthur Lupia and Jon Krosnick opened the “Online Commons,” a forum for the research community and the public to submit new ideas for future studies. From 2006-2008, over 600 scholars proposed over 3,000 questions.
In 2010, the NSF included the ANES in its “Sensational 60,” a list of advancements that have had a large impact on every American’s life.
Recent History
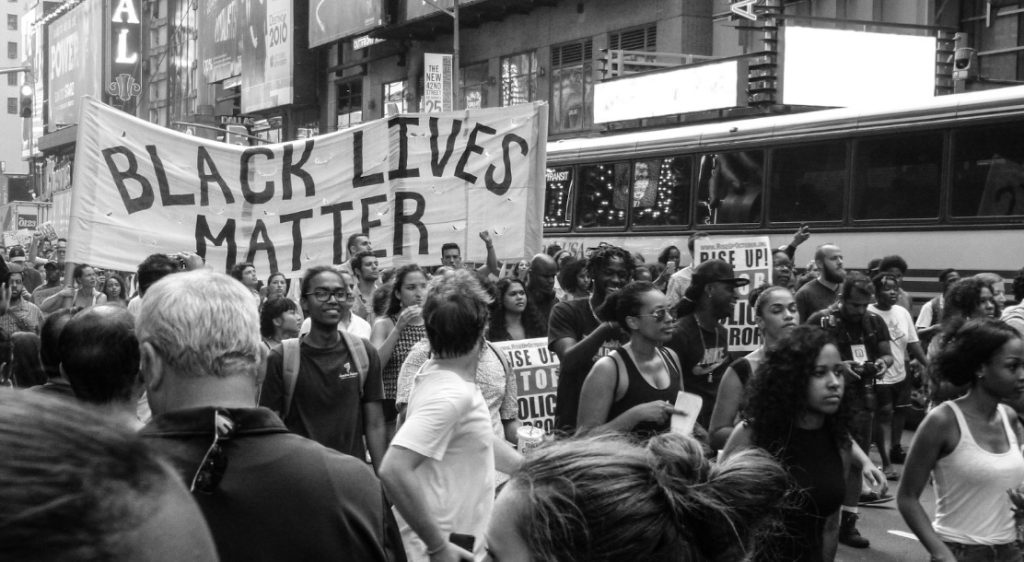
Photo source: Nicole Baster, via Unsplash
Perhaps the most important trends captured in the past decade of the ANES have been decreasing trust in government and increasing affective polarization, or animosity across party lines.
“The unparalleled ANES time series data have made possible the discovery of an entirely new subfield of American politics – the phenomenon of affective polarization,” writes ANES PI Shanto Iyengar. “[The documentation of] a significant increase over time in partisans’ hostility toward their opponents, first published in 2012, has since generated more than 350 published papers (with the term affective polarization in the title) and approximately 12,000 citations (from Google Scholar).”
The 2016 study introduced new questions on trade, immigration, economic inequality, LGBT issues, outsourcing, policing, and social mobility. That same year, the ANES tested the collection of high-quality Internet samples, comparing these to in-person interviews.
This year also inaugurated the 3-wave panel (2016-2024), interviewing more than 2,000 people from a high-quality, representative sample over three presidential elections for the first time in ANES’s history.
Conducted between 2018 and 2022, a massive scanning project funded by the NSF added 5 million pages of content to the ANES’s digital archive.
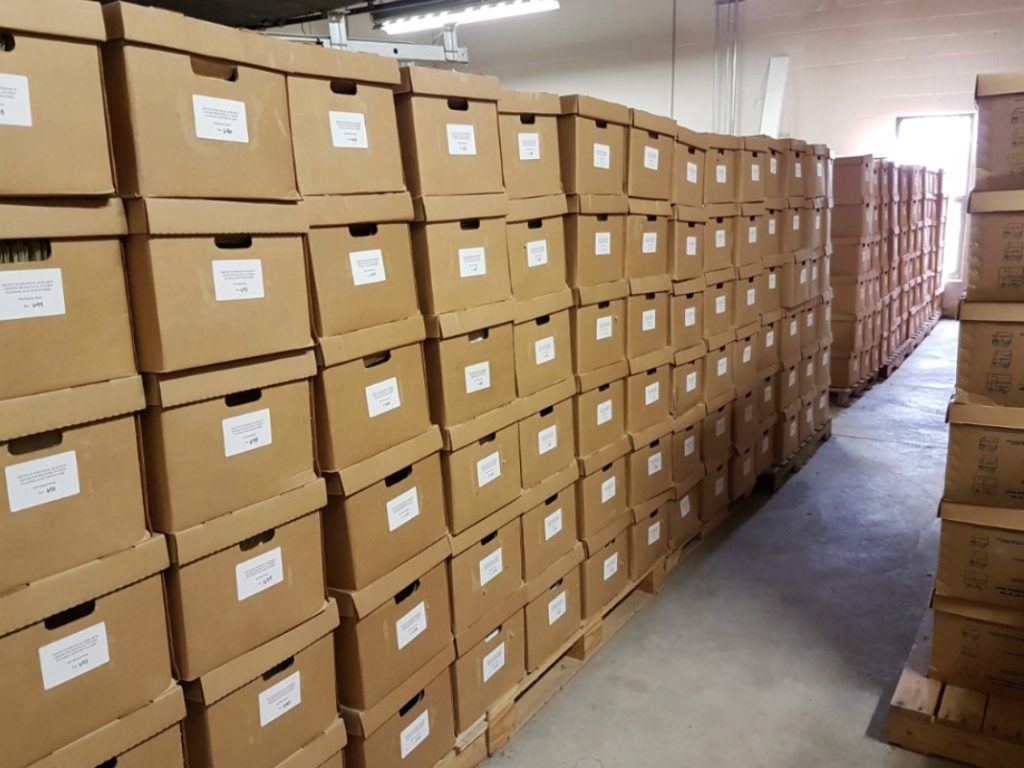
(Photo courtesy of ANES staff)
The 2020 Time Series study was designed by the Principal Investigators Ted Brader and Shanto Iyengar with help from Associate PI’s Nicholas Valentino, Sunshine Hillygus, Daron Shaw, an experienced staff, and with input from the ANES Advisory Board and user community. The ANES added questions about Black Lives Matter and police conduct, and initiated its Social Media Study, the first nationally representative data set linking social media use to political behaviors.
In 2022, the beta version of the ANES Guide to Public Opinion and Electoral Behavior was released with improved formatting, visualizations, and interactivity.
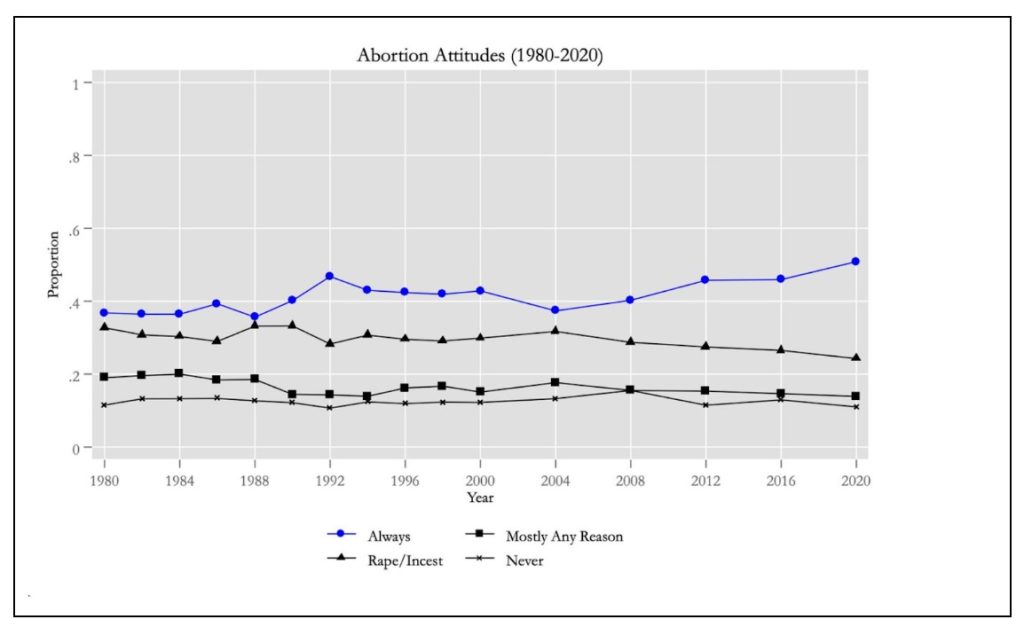
Following the Supreme Court’s decision in Dobbs, overturning Roe vs Wade, the 2022 ANES pilot study began beta testing new questions on abortion. Pictured here: A graph of election studies’ data on abortion attitudes, posted to Twitter/X by political scientist Ian Shapiro, shows an increase in support for the option that by law, a woman should “always” be able to obtain an abortion as a matter of personal choice.
The Future of the ANES (2024-)
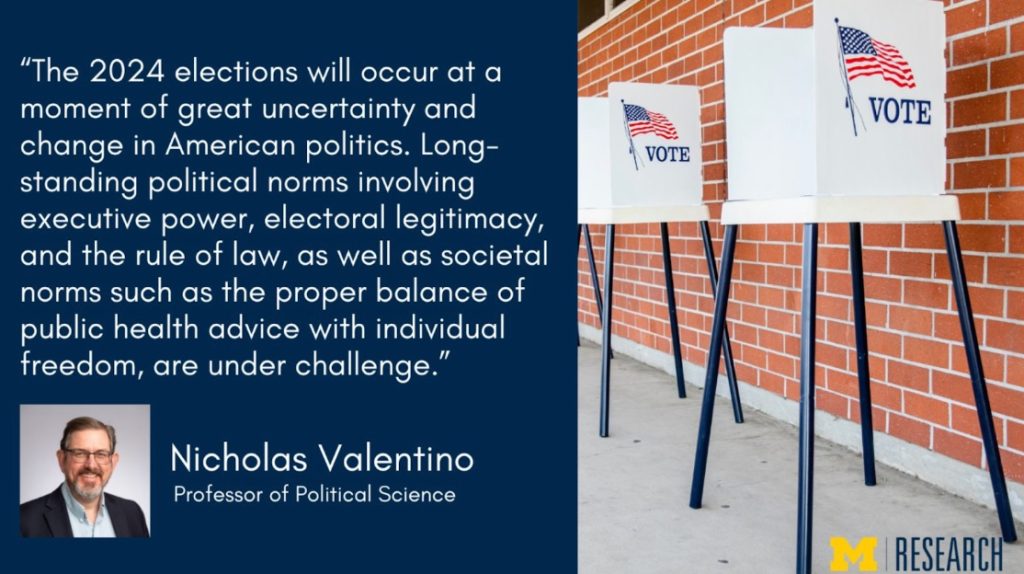
In 2022, the NSF awarded $14m to the ANES to study 2024 elections to a PI team including Sunshine Hillygus, Shanto Iyengar, Daron Shaw and Nicholas Valentino. In 2024, the ANES will complete its 3-wave panel interviewing the same respondents over three presidential elections for the first time in the ANES’s history. Valentino notes that the 2024 elections will occur “at a moment of great uncertainty and change in American politics. Long-standing political norms involving executive power, electoral legitimacy, and the rule of law…are under challenge.” Trust in government is at an all-time low; polarization in America is at its most venomous. Without the ANES, we would not be able to know where these trends began, and so long as the ANES remains funded, we will have a national resource that shows us where we’ll have gone from here.
The ANES is currently a collaboration of Duke University, the University of Michigan, Stanford University, and the University of Texas at Austin, with funding from the National Science Foundation.
Its current principal investigators are Shanto Iyengar, Professor of Political Science and Director of the Political Communication Laboratory at Stanford University, and Nicholas Valentino, Professor of Political Science at the University of Michigan and a Research Professor affiliated with the Center for Political Studies at the Institute for Social Research. The Associate PIs are D. Sunshine Hillygus, Professor of Political Science and Public Policy and director of the Initiative on Survey Methodology at Duke University, and Daron Shaw, Distinguished Teaching Professor and the Frank C. Erwin, Jr. Chair of State Politics at the University of Texas at Austin.
Sources and Further Reading
- John Aldrich, “The American National Elections Study as ‘Gold Standard’ for Survey Research in the Twenty-First Century,” Board Report, 2017.
- Nancy Burns, “The Michigan, then National, then American National Election Studies,” 2006.
- The ANES (electionstudies.org) history, previous principal investigators, and timeline.
- Warren E. Miller, “An Organizational History of the Intellectual Origins of the American National Election Studies,” European Journal of Political Research 25: 247-265, 1994.
- Virginia Sapiro, “Fifty Years of the National Election Studies: A Case Study in the History of ‘Big Social Science,’’ delivered at the Annual Meeting of the American Political Science Association, Atlanta, 1999.
- Herbert F. Weisberg, “Reflections: The Michigan Four and their Study of American Voters: A Biography of a Collaboration,” American Political Science Association, 2016.
This post was developed by Tevah Platt.

Feb 13, 2024 | ANES, ANES 75th Anniversary, Elections
 This year marks the 75th anniversary of the American National Election Studies– the definitive study of American political attitudes and behavior. The ANES has run national surveys of citizens before and after every presidential election since 1948, providing a rigorous, non-partisan basis for understanding contemporary issues as well as change over time. According to the National Science Foundation, the ANES provides “gold-standard data on voting, public opinion, and political participation in American national elections.” The Center for Political Studies interviewed ANES Principal Investigator Nicholas Valentino to gather his reflections on the history of the ANES, what we’ve learned from it, and where we’d be without it. This interview has been edited and condensed.
It’s the 75th anniversary of the ANES. What do you want people to know about it?
VALENTINO: It’s really important to remind ourselves about how important the ANES has been in terms of a gold standard survey, both methodologically and substantively, that other polling outfits use as a benchmark. We don’t often talk about those things, because we assume it is well known how important the ANES is for the entire discipline. But it is important that the ANES collects the highest quality samples; we care a lot about measurement, and we don’t change measures unless we know that the alternative is a better measure of the concept that we’re trying to tap. Every year, hundreds of dissertations and publications are written using ANES data. That means ANES data appear in thousands of scientific works per decade, and tens of thousands over the life of the project.
This is the most centrally important study of American public opinion and political behavior in existence.
What’s unique about the ANES survey?
VALENTINO: With the rise of other less expensive samples and sampling methods, especially volunteer internet samples, entire generations of students are now able to collect data on their own rather than rely on infrastructure projects like the ANES. This is no doubt a great innovation, because each scholar can learn a lot about new topics and perform survey experiments for which the ANES is not well suited. But these new samples and sampling techniques can’t match ANES’s data quality both in terms of measurement practices and the sampling quality. They can’t provide valid and reliable estimates of opinions that the population holds because they do not collect representative samples of the country. They can’t replace address-based samples and the face-to-face interviewing methodology that the ANES has employed (with the COVID-year exception in 2020) for 75 years. And, perhaps equally importantly, with its time series questions, the ANES allows one to measure population level change in opinions over time. The ANES is very unique for both of these reasons, and so we think it has made good on the hopes of its founders 75 years ago.
Let me say a bit more on how the ANES represents truly invaluable infrastructure for the entire discipline. The Department of Astronomy at Michigan recently invested in the instrumentation program for the Extremely Large Telescope (ELT), which is a consortium of universities and partners building the largest optical telescope in the world. Few universities can afford to build their own telescopes; instead, they buy into a measurement strategy that is fundamentally collaborative. The National Science Foundation supports these big projects, because they know that scholars from universities around the country can use the telescope regardless of the research budgets on their home campus. Well, that’s what the ANES is doing for the study of public opinion and political behavior. We include questions on the survey that have been asked before because we want continuity of measurement, and that are interesting to the broadest array of users in the community. The user community has several mechanisms for influencing the content of the ANES, including specific proposals and by serving on the large and diverse Advisory Board.
Where would we be today were it not for the ANES?
Valentino: One example is that we are currently very concerned about affective polarization or the polarization of society along lines of party. It was once the case that Democrats and Republicans didn’t dislike each other very much at all. In fact, if you ask Democrats and Republicans how warmly they felt toward their own party and toward the out-party, they once gave both roughly the same score. If you track this in the ANES over time, we see that after the 1980s there was a dramatic, continuous increase in how much Americans disliked members of the other party. That discovery has triggered a wide ranging set of inquiries about whether it was driven by elite preferences, differences in the party platforms, or by something that was changing in the electorate. We’re still trying to answer this question about why. But we wouldn’t really have known how big the problem was, or when it started, if not for the ANES. The ANES tells us when it started, and how fast it grew. And those pieces of information are very critical for understanding why it happened.
What kinds of questions have been asked continuously over the history of the ANES?
Valentino: It must have been very hard in 1950 to know which questions to ask, especially if one wanted to begin a time series that would last 75 years. You can imagine how different the world was when Warren Miller and his colleagues started thinking about what questions they should ask. One example of a question we have asked continuously over time is, “How much do you trust the government to do what’s right?” If you look up the trend on government trust on the accessible web page– the ANES Guide to Public Opinion and Electoral Behavior– you will see a dramatic decline in the percentage of people who say they trust the government to do what’s right. This trend is one of the things people point to when they worry about democratic backsliding and the deterioration of democratic norms. Back in the late 1950s, in the Eisenhower era, almost 80% of Americans said they could trust the government “most of the time or just about always.” Now that number has decreased to about 20%. Another question has been asked for quite some time on this topic: “Are governmental officials crooked?” At one time the vast majority of Americans responded “not many,”or “hardly any.” Since 2008, there has been a massive increase in the share of the electorate from either party who say “quite a few” elected officials are crooked. So that’s a massive shift and a decrease in trust that we’re aware of because of the ANES asking the same questions consistently over time. Americans’ trust in government hit its nadir in 2020– making the future of the ANES particularly valuable for understanding how democracies react to declines in public confidence.
What have we learned from the ANES about how voters select their candidate?
Valentino: One of the early discoveries of the founders of the ANES was that psychological attachments to parties themselves are group identities.
Party identification is the core predisposition shaping political beliefs and behaviors. In other words, it may be that votes are driven most strongly by those partisan identities rather than a citizen’s individual preferences on a bundle of policies. That discovery can have a very scary set of implications.
Most definitions of democracy insist that citizens have the ability to freely choose candidates who represent their issue preferences and hold elected officials accountable when they fail to produce results consistent with their campaign promises. So what if pre-existing attachments to parties drive vote choices even when candidates are not delivering on issues or economic performance? In that system, leaders could pursue policy interests divorced from the majority’s will. It reduces the impact that issues, trends, and performance have on democratic elections. If so, elections increasingly resemble sports events, in which it is forbidden to criticize the home team.
The ANES has documented a long-term shift in party identification, and especially a decline in Democratic dominance from the 1950s to the present. Over time, there is a lot of variation in partisan attachments that is not predicted by social group memberships. You might look at individual-level psychological forces to explain, for example, how white, blue-collar Democrats were pushed toward the Republican party after the Civil Rights movement. That is a dynamic you couldn’t understand by looking solely at social group memberships or by considering material interests. The early scholars of the ANES were among the first to discover that, contrary to popular belief, people don’t vote with their personal pocketbooks. People are motivated less by their own financial security than by how they think the country is doing as a whole. Americans, at least until very recently, support the incumbent if the country is doing well, even if that candidate is from the other party. The ANES was central in discovering this pattern. It will also be central for understanding how these long-term linkages between economic performance and support for incumbents may be breaking down.
What have we learned from the ANES about why some voters participate in politics and others don’t?
Valentino: It is often remarked that political science has few “laws” – theories that are so powerful and elegant that they have reached the status of a settled scientific explanation for important phenomena. One exception is the Civic Volunteerism model of participation proposed by Verba, Schlozman and Brady (1995). This theory claims that people turn out because they want to, because they’ve been asked to, or because they can. Those forces– engagement, recruitment, and resources– are all measurable, and the ANES measures them over time. The model has done a fantastic job explaining who will participate in politics in a variety of ways.
But short-term forces also matter. For example, people with a lot of resources participate in some elections but not others, and some people who have very few of these advantages participate, even though the model might predict that they wouldn’t. The short-term forces are also measurable, and many political psychologists are working on those. We have, for example, identified short-term emotional dynamics that can drive people to the polls– sometimes, but not others– even holding resources constant. You need to ask people about the emotional intensity they are experiencing in a given election, the intensity of competition between the candidates, about campaign negativity, and the tone of political discourse. These factors have also been measured by the ANES, and so our theories of participation are getting stronger and more comprehensive.
How and why are new questions added to the ANES?
Some parts of the ANES every election are about mapping long-term trends, but about 30% of the content on the ANES is concerned with the contemporary moment. People think that the ANES is only about asking the same questions, 75 years straight, but that is a profound misconception. The project solicits input from the user community every cycle, and relies on its diverse Advisory Board to identify contemporary issues it must explore. The ANES actively cultivates new questions about very new issues that might be driving the dynamic in a given election year, but may or may not be permanent parts of our landscape. And we try to balance those new inquiries against the space needed in order to measure long-term trends. Only then can political science as a discipline understand how we got to this point, and predict where we might be going.
Takeaways:
- The ANES is a centrally important study of American public opinion and political behavior.
- The ANES provides gold-standard data on voting, public opinion, and political participation in American national elections, priding itself on sampling quality and measurement quality.
- Looking at long-term trends, we currently stand at a low-point for Americans’ trust in government and an all-time high for affective polarization. These trends are understandable because the ANES’s time series questions track change over time.
- The ANES has demonstrated that political identity plays a strong role in determining how voters choose candidates.
- People participate in politics when they are interested, asked to participate, and have the resources to participate. But short-term factors like the emotional intensity of an election also matter. The ANES survey measures all of these factors.
- In recent cycles, about 30% of the survey has been dedicated to new questions investigating contemporary issues based on input from its community of users.
- Tens of thousands of dissertations and publications have been based on data from the ANES over the project’s history.
Nicholas Valentino is Professor of Political Science at the University of Michigan and a Research Professor affiliated with the Center for Political Studies at the Institute for Social Research. He received his Ph.D. from the University of California, Los Angeles, in 1998. His research focuses on political campaigns, racial attitudes, emotions, and social group cues in news and political advertising. His current work examines the intersection between racial attitudes and emotion in predicting political participation and vote choice, as well as the sources of public support and opposition to immigration in the U.S. and cross-nationally.
The ANES is currently a collaboration of Duke University, the University of Michigan, Stanford University, and the University of Texas at Austin, with funding from the National Science Foundation.
This post was developed by Tevah Platt.
Oct 31, 2023 | ANES, Economics, Elections, expert analysis, International, National, Policy, Social Policy
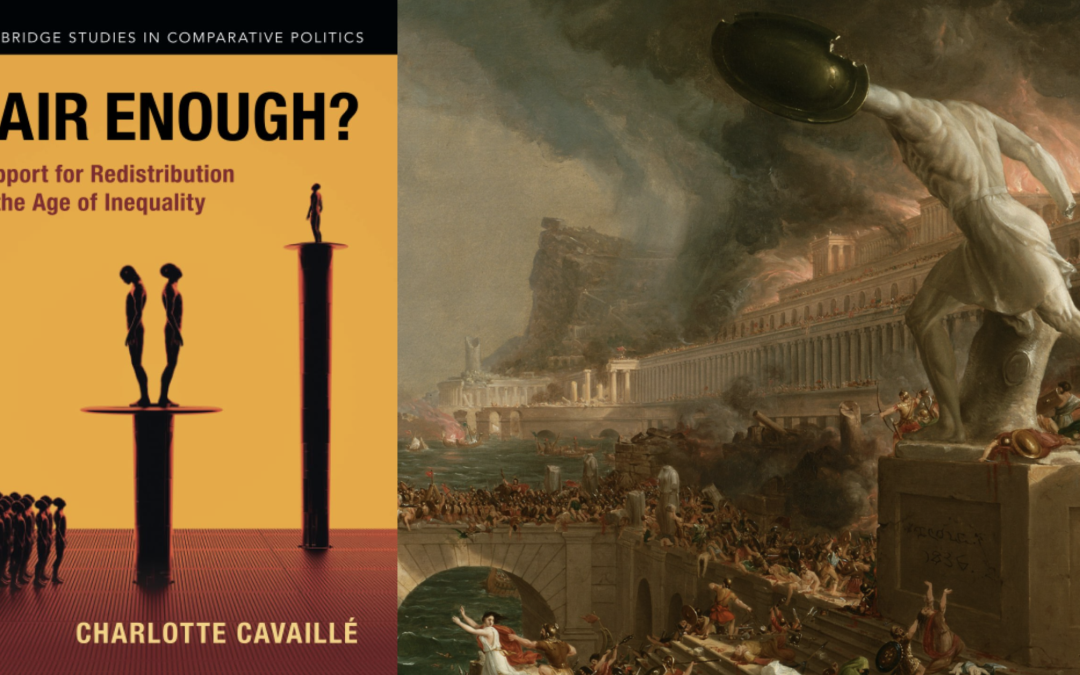
In the past, excessive economic inequality has ended… badly. As Charlotte Cavaillé points out in her new book that studies the public’s reaction to rising inequality, “only mass warfare, a state collapse, or catastrophic plagues have significantly altered the distribution of income and wealth.” Will this time be different?
Through income redistribution, democratic and political institutions today have a clear mechanism to peacefully address income inequality if voters demand it. Still, as highlighted by Cavaille in Fair Enough?: Support for Redistribution in the Age of Inequality (Cambridge University Press), greater wealth and income inequality are not leading to greater demand for an egalitarian policy response as many would expect.
Cavaillé reports there is little evidence of rising support for redistribution, especially among the worse off. Consider public opinion in the two Western countries with the sharpest increase in income inequality: In Great Britain, public support for redistribution is decreasing, and in the United States, the gap between the attitudes of low-income and high-income voters is narrowing. What, asks Cavaillé, can we conclude about public opinion’s role as a countervailing force to rising inequality?
 Based on Cavaillé’s doctoral work, Fair Enough? introduces a framework for studying mass attitudes toward redistributive social policies. Cavaillé shows that these attitudes are shaped by at least two motives: material self-interest and fairness concerns. People support policies that would increase their own expected income. On the other hand, they also support policies that, if implemented, “would move the status quo closer to what is prescribed by shared norms of fairness.” Material interest comes most into play when policies have large material consequences, according to Cavaillé, but in a world of high uncertainty and low personal stakes, considerations of fairness trump considerations about one’s personal pocketbook.
How fair is it for some to make a lot more money than others? How fair is it for some to receive more benefits than they pay in taxes? Cavaillé emphasizes two norms of fairness that come into play when we think about such questions: proportionality, where rewards are proportional to effort and merit, and reciprocity, where groups provide basic security to members that cooperatively contribute. Policy disagreement arises because people hold different empirical beliefs regarding how well the status quo aligns with what these norms of fairness prescribe.
With fairness reasoning in the picture, Cavaillé writes, “baseline expectations are turned on their heads: Countries that are more likely to experience an increase in income inequality are also those least likely to interpret this growth as unfair.”
Should we expect growing support for redistribution to be a driving force behind policy change in the future? A change in aggregate fairness beliefs, Cavaillé argues, will require a perfect storm: a discursive shock that repeatedly exposes people to critiques of the status quo as unfair on the one hand, and a large subset of individuals whose own individual experience predispose them to accept these claims as true on the other. Policy changes in postindustrial democracies are possible, Cavaillé concludes– but they are unlikely to be in response to a pro-redistribution shift in public opinion.
 Charlotte Cavaillé is an assistant professor of public policy at the University of Michigan’s Gerald R. Ford School of Public Policy and an affiliate of the Center for Political Studies at the Institute for Social Research. Her dissertation, on which ‘Fair Enough’ is based, received the 2016 Mancur Olson Best Dissertation Award.
Tevah Platt and Charlotte Cavaillé contributed to the development of this post.
Feb 13, 2023 | ANES, expert analysis, National
This post was developed by Ken Kollman and Tevah Platt, based on the talk, “When People Change Their Partisanship, is it Bottom-Up or Top-Down?” that Ken Kollman presented for the Research Center for Group Dynamics Winter Seminar Series on Political Polarization (2023) at the University of Michigan Institute for Social Research. Ken Kollman is the Director of the Center for Political Studies.
Partisanship is sticky. People tend to vote like their parents and to maintain their partisan leanings over time. But to understand partisanship, we need a model that can explain why people change party loyalties when they do. This is what Ken Kollman and John E. Jackson of the University of Michigan Center for Political Studies (CPS) provide in Dynamic Partisanship: How and Why Voter Loyalties Change. The following summarizes their overarching argument.
What is partisanship?
Partisanship is a group-based, shared identity. A classic work from 1960, The American Voter, also out of ISR, describes partisan identity as a long-term, affective, psychological attachment to a political party. According to this famous “Michigan model,” the socially-informed attitudes and values we form early in life durably influence the way we identify with political parties and how we vote.
Kollman and Jackson argue that partisanship has similarities to brand loyalty. It’s relatively stable and habitual, but it’s also evaluative and cognitive. Parties compete for votes and, importantly, for voter loyalty among “consumers” who are considering and comparing candidates and party ideas. Voters “experience” parties in office and in campaigns, and evaluate parties like consumers with products. Yet voting over time for the same party can also become habitual until voters become dissatisfied with what they chose.
What drives partisanship change?
Ronald Reagan often said that he didn’t leave the Democratic party, but the Democratic party left him. The quip encapsulates what Kollman and Jackson find to be the primary answer to the question of what moves partisanship. Two other processes do influence partisan dynamics– changes in people’s political attitudes and their evaluations of the performance of politicians in office – but it’s the behaviors of parties that they find are the greatest contributors to changing partisanship.
- At the micro-level, partisanship is driven by evaluations of parties and politicians who are themselves changing for strategic reasons to try to win office.
- At the macro-level, party polarization is a consequence of elite-level competition for voters, mostly at a national scale– for example, in response to national policies and movements.
In the broader debates about polarization, the stake they claim is that polarization is driven by elite-level competition for power, and not by ordinary people changing their minds about their ideologies or issue positions. It’s top-down, driven by what politicians and their parties do.
How parties compete
A canonical model of party competition came out of the mid-century work of Anthony Downs, who developed a theory of party competition in ideological space. This theory drew a picture of the Democratic and Republican parties converging on the “median voter” the way that ice cream trucks would converge at the middle of a beach to attract the most customers. More complex models admit that political ideology and conflict takes place in multiple dimensions; on the ground, for example, a candidate or party that is moving right on social issues could be moving left on economic policy, perhaps testing out impacts on voters.
A case in point: the language of industrial protectionism (saving factories) was an economically leftward move of the Trump-guided GOP that effectively turned Ohio from purple to red by attracting whites in Northeastern Ohio to the Republicans. Dynamic Partisanship tracks such patterns across the US, the UK, Canada and Australia over more than a half-century, but the overarching trend is that parties are the moving gear in dynamic partisanship. Voters don’t need to be moved, but partisanship can change because voters are reacting to parties that move– and that’s the underlying dynamic.
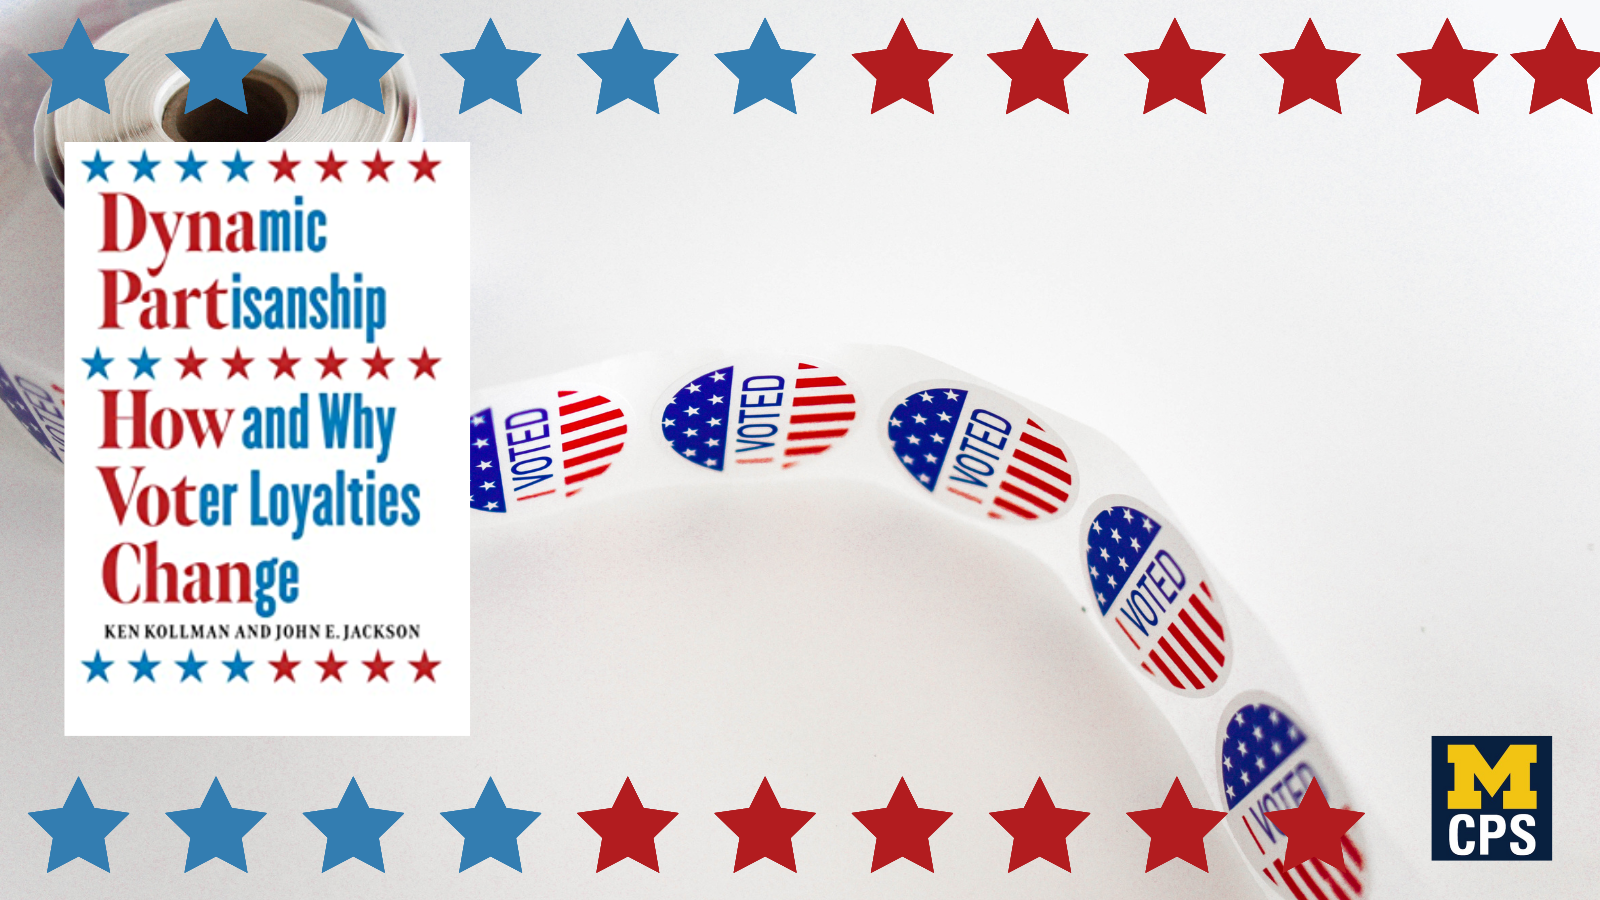
Partisan trends in the US
This figure, from Dynamic Partisanship, plots partisanship among three groups of the U.S. electorate– northern whites, southern whites, and African Americans– from 1956 to 2016, with Democratic partisanship increasing on the y axis. There are three distinct patterns:
- Northern white partisanship is the most stable, coming closest to the traditional view of party identification as an unchanging personal attribute;
- The 1964 election, on the heels of the passage of the Civil Rights Act, is a critical turning point in African American partisanship, making a full-point leap and remaining consistently high on the Democratic scale from that time;
- Southern white partisanship shows a strong, gradual trend shifting from moderately Democratic to weakly Republican over 61 years.
The twin phenomena of southern Black voters becoming more Democratic since the 1960s and southern whites becoming slowly more Republican over time represent two of the major tectonic shifts in American society and politics that have occurred in the last half century.
The innovation is that the model used in Dynamic Partisanship can accommodate these divergent patterns– relative stasis, abrupt changes, and gradual changes. For the details and the myriad examples, check out the book.
Sep 19, 2022 | ANES, National, Race
Post developed by Francy Luna Diaz and Tevah Platt, based on the work Luna Diaz presented at the 2022 Annual Meeting of the American Political Science Association (APSA), “Latinos for Trump in 2020: A Story of Heterogeneous Information Environments and Social Media.”
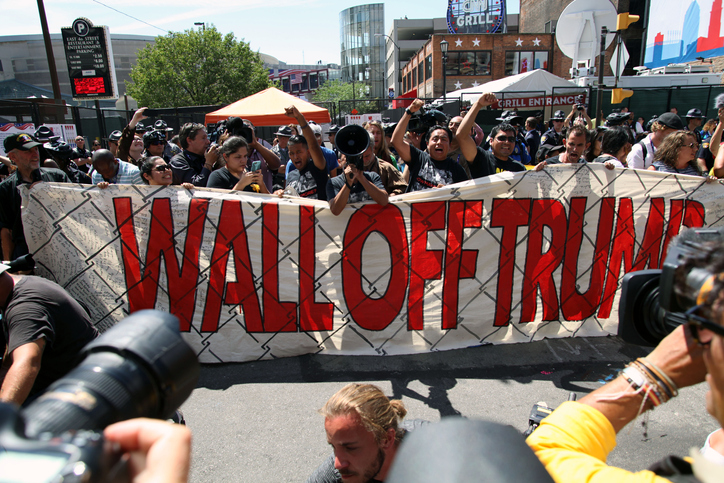
Latinos continue to surprise with their sustained and increased support for former President Trump. After numerous episodes during his campaign for president and time in office espousing what was seen as anti-Latino and anti-immigrant rhetoric and policies, it is puzzling to many that almost one in three Latinos voted for him during the 2020 presidential election.
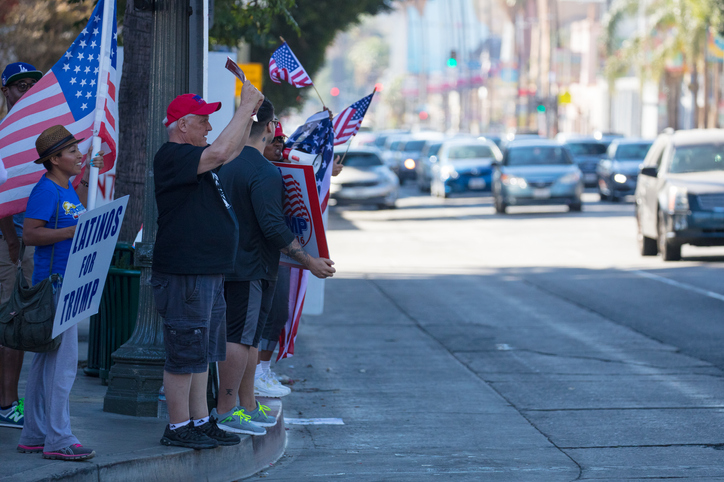
Los Angeles, United States – October 22, 2016: LOS ANGELES, USA – OCTOBER 22: A pro Donald Trump rally outside a CNN building on Sunset Blvd in Hollywood, Los Angeles
What is his appeal to many Latinos? Scholars have found that many Latinos agree with his policies, and more Latinos say they are Republicans than before. Political science PhD student Francy Luna Diaz, however, wants to probe deeper. She analyzes why some Latinos are attracted to Trump and others are not. She proposes that Latinos’ information environments are crucial to understanding the wide-ranging variance of the groups’ political attitudes.
Latinos are embedded in information environments that differ from other Americans because of distinct social media use and social networks. Information environments refer to the various sources of information that people have around them, mainly social media platforms. Latinos, in fact, are more likely than other ethnic groups to rely on social media and messaging applications to share and obtain information with close friends and relatives.
Additionally, Latinos often maintain ties to Latin America and are exposed to political information about and emerging from Latin America.
These factors combined—higher use of social media and more diverse information networks—increased Latinos’ vulnerability to disinformation and misinformation in 2020 and may have influenced some Latinos to distance themselves from the Democratic party.
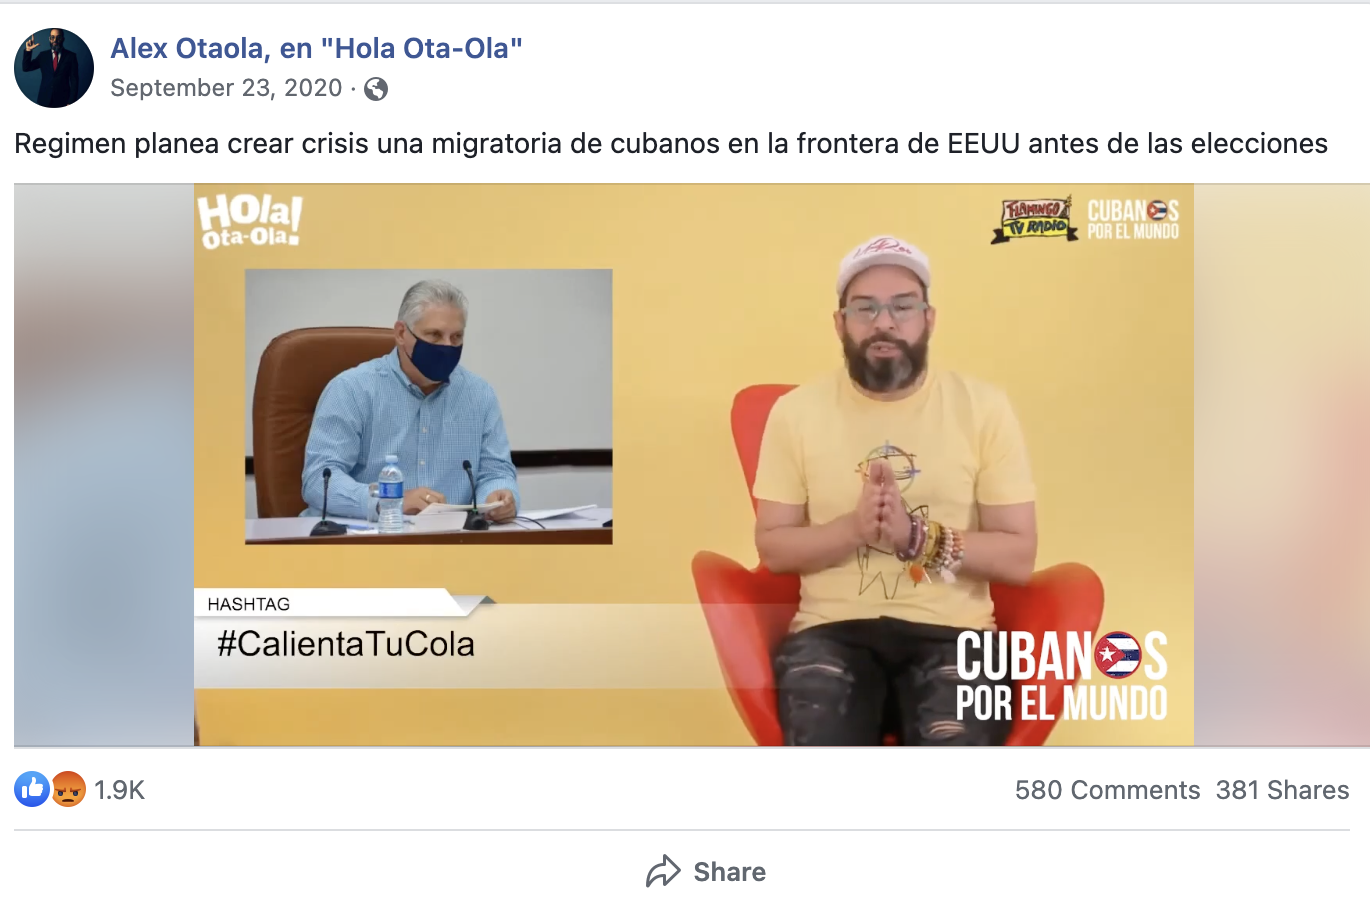
An example of social media misinformation: Cuban-American influencer Alex Otoala falsely claimed Democrats were going to send a caravan of Cuban immigrants to the US border to disrupt the election.
Luna Diaz analyzed ANES data from 2020 and 2016 to explore whether traditionally recognized factors such as party identification, age, education, income, trust, generation in the U.S., language, and place of birth, among others, correlated with respondents’ decision to vote for Trump. She found that in 2020, Latinos who used Facebook more frequently were significantly more likely to vote for Trump, while the same pattern was not present for non-Latinos.
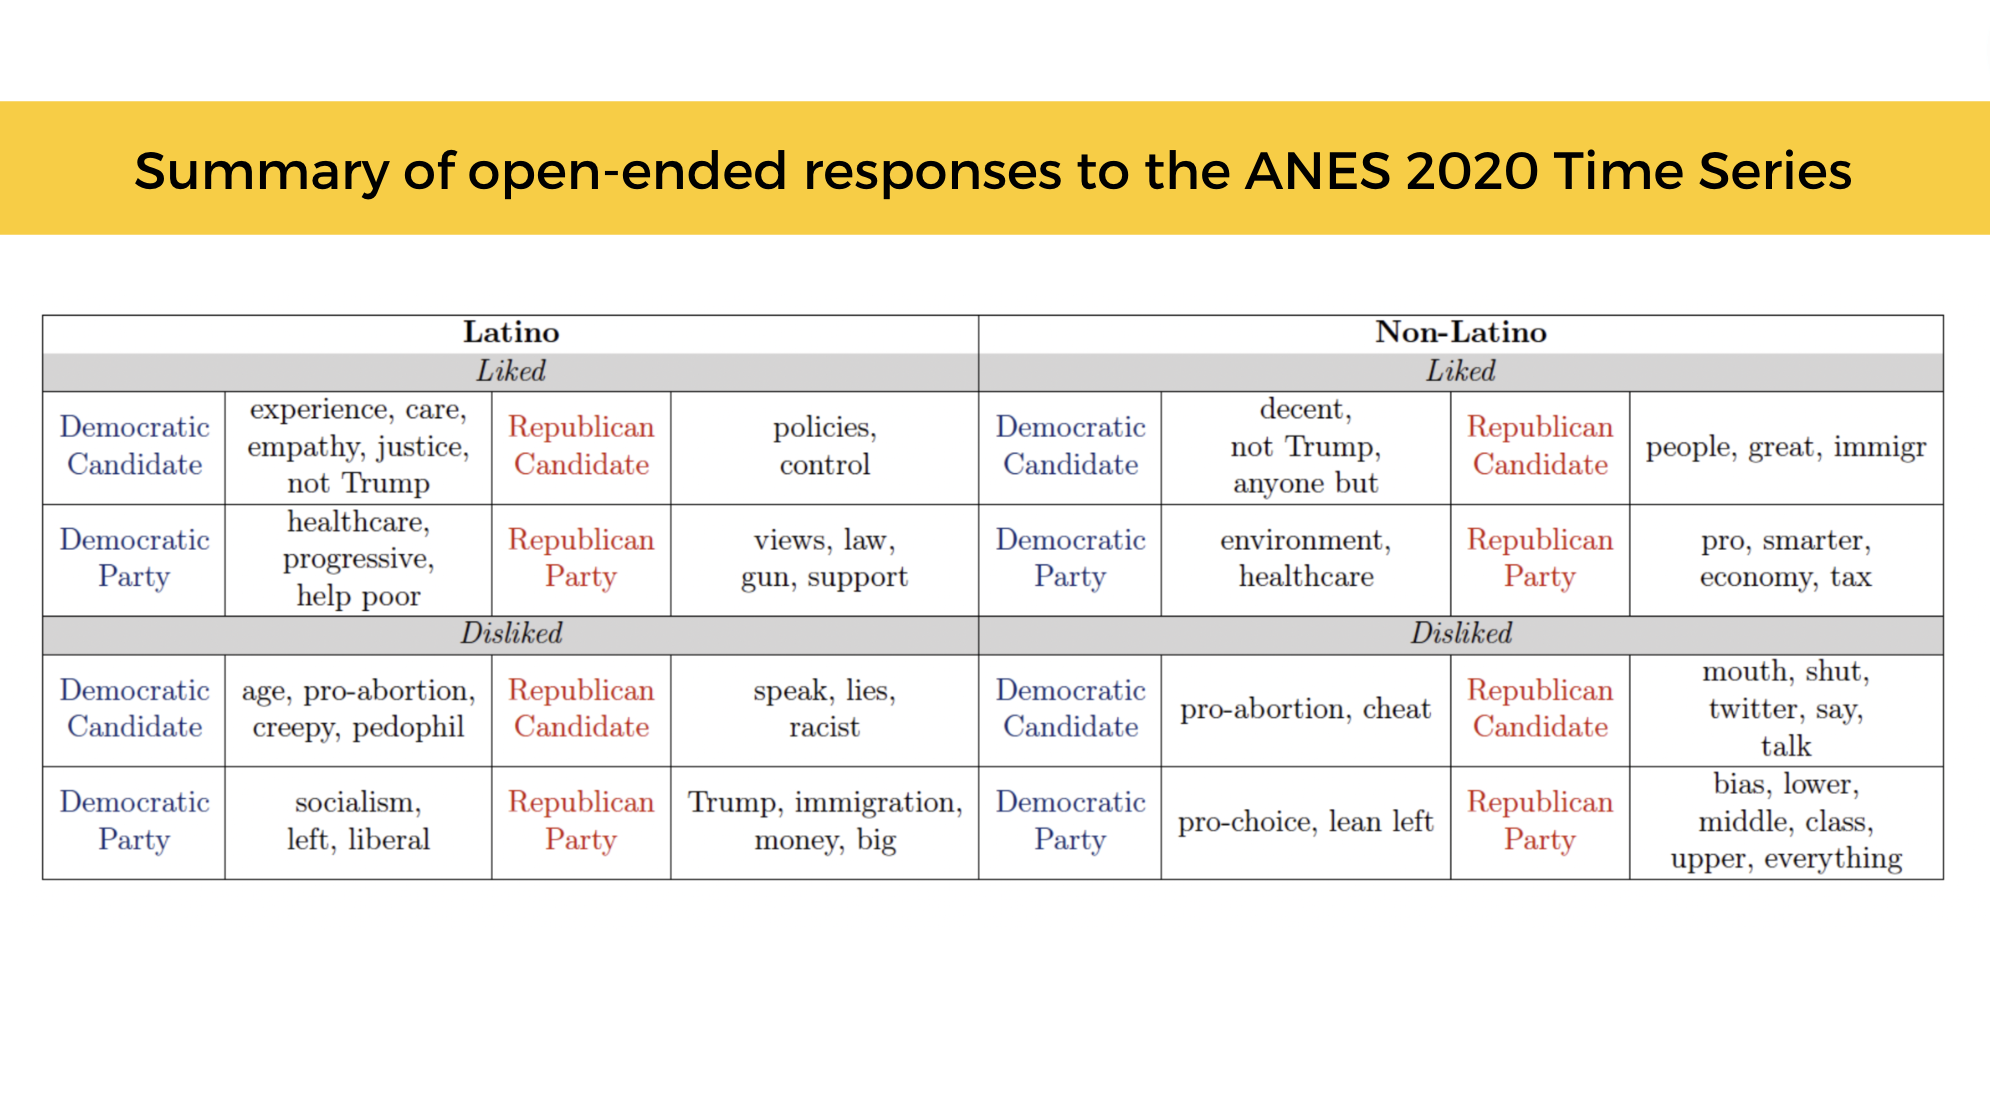
Luna Diaz also looked at answers to open-ended questions in ANES, summarized in the Table below, and found that while Latinos offered similar considerations when discussing why they like each candidate or party, differences emerged when they discussed why they disliked the Democratic candidate and the Democratic party in 2020. Interestingly, the reasons offered may point to (sometimes false or misleading) news spreading online claiming that the Democratic party is leading the U.S. towards socialism and President Biden behaves inappropriately with children.
 Understanding Latinos’ political behavior is crucial to evaluating the present and future of American electoral politics. Latinos’ share of the population is steadily increasing along with their political influence in close elections. On a larger scale, it is important to uncover whether the spread of potential disinformation via social media impacts the political participation of different groups. Understanding the effect of online disinformation and misinformation will only increase in importance as democracy remains under threat in the United States.