Oct 31, 2014 | Elections, National
Post developed by Katie Brown and Josh Pasek.
Photo credit: ThinkStock
With each election cycle, the news media publicize day-to-day opinion polls, hoping to scoop election results. But surveys like these are blunt instruments. Or so says Center for Political Studies (CPS) Faculty Associate and Communication Studies Assistant Professor Josh Pasek.
Pasek pinpoints three main issues with current measures of vote choice. First, they do not account for day-to-day changes. Second, they capture the present moment as opposed to election day. Finally, they can be misleading due to sampling error or question wording.
Given these problems, Pasek searched for the most accurate way to combine surveys in order to predict elections. The results will be published in a forthcoming paper in Public Opinion Quarterly. Here, we highlight his main findings. Pasek breaks down three main strategies for pooling surveys: aggregation, prediction, and hybrid models.
Aggregation – what news companies call the “poll of polls” – combines the results of many polls. In this approach, there is choice in which surveys to include and how to combine results. While aggregating creates more stable results by spreading across surveys, an aggregation is a much better measure of what is happening at the moment than what will happen on election day.
Prediction takes the results of previous elections, current polls, and other variables to extrapolate to election day. The upside of prediction is its focus on election day as opposed to the present and the ability to incorporate information beyond polls. But, because the models are designed to test political theories, they typically use only a few variables. This means that their predictive power may be limited and depends on the availability of good data from past elections.
Hybrid approaches utilize some combination of polls, historical performance, betting markets, and expert ratings to build complex models of elections. Nate Silver’s FiveThirtyEight – which won accolades for accurately predicting the 2012 election – takes a hybrid approach. Because these approaches pull from so many sources of information, they tend to be more accurate. Yet the models are quite complex, making them difficult for most readers to understand.
So which pooling approaches should you look at? That depends on what you want to know. Pasek concludes, “If you want a picture of what’s happening, look at an aggregation; if you want to know what’s going to happen on election day, your best bet is a hybrid model; and if you want to know how well we understand elections, compare the prediction models with the actual results.”
Oct 14, 2014 | Current Events, Elections, National
Post developed by Katie Brown and Josh Pasek.
The Birther movement contends that Barack Obama was not born in the United States. Even after releasing Obama’s short form and long form birth certificates to the public, which should have settled the matter, the rumors to the contrary continued. Some contend Obama was born in Kenya. Others argue he forfeited American citizenship while living in Indonesia as a child.
What drives these beliefs?

Obama’s short form birth certificate, courtesy of whitehouse.gov
Center for Political Studies (CPS) Faculty Associate and Communication Studies Assistant Professor of Josh Pasek – along with Tobias Stark, Jon Krosnick, and Trevor Tompson – investigated the issue.
The researchers analyzed data from a survey conducted by the Associated Press, GfK, Stanford University, and the University of Michigan. The survey asked participants where they believed Obama was born. The survey also asked about political ideology, party identification, approval of the President’s job, and attitudes toward Blacks.
21.7% of White Americans did not think Obama was born in the U.S.; their answers included “not in the U.S.,” “Thailand,” “the bush,” and, most frequently, “Kenya.”
Further analyses revealed that Republicans and conservatives were more likely to believe Obama was born abroad. Likewise, negative attitudes toward blacks also correlated with Birther endorsement. Importantly, disapproval of Obama mediated the connection between both ideology and racism on the one hand and Birther beliefs on the other.
The authors conclude that, “Individuals most motivated to disapprove of the president – due to partisanship, liberal/conservative self-identification, and attitudes toward Blacks – were the most likely to hold beliefs that he was not born in the United States.” Put simply, the key feature of Birthers wasn’t that they were Republicans or that they held anti-Black attitudes, but that they disapproved of the president. It was this disapproval that was most closely associated with the willingness to believe that President Obama was ineligible for his office.
The full Electoral Studies article can be found here.
Oct 2, 2014 | Elections, National
Post developed by Katie Brown and Arthur Lupia.

Photo credit: ThinkStock
In a post last year, Center for Political Studies (CPS) Research Professor and Professor of Political Science Arthur Lupia declared there to be two types of people: those who are ignorant about politics and those who are delusional about how much they know. There is no third group.
If people lack information, it can lead to bad decision-making. As part of an effort to reduce bad decisions, Lupia examines how to inform voters more effectively in his forthcoming book, How to Educate Ignorant People about Politics: A Scientific Perspective.
Lupia focuses on improving the efforts of teachers, scientists, faith leaders, issue advocates, journalists, and political campaigners. How can they best educate others? To further this goal, Lupia focuses on the transmission of information. He clarifies how different kinds of information can improve important kinds of knowledge and competence. A key part of Lupia’s argument is that people are easily distracted and often evaluate information based on how it makes them feel. As a result, the way to improve knowledge and competence is to find factual information that is not only relevant to the decisions that people actually have to make but also consistent with their values and core beliefs. For if a person sees factual information that is inconsistent with their values and beliefs, they tend to ignore it; and if the information is not relevant to their actions, then it cannot improve their competence. In this examination, facts are not enough. The real task is to convey facts to which people want to pay attention.
Despite the pessimistic premise of broad ignorance, Lupia is ultimately optimistic. The central thesis of his book is that offering helpful information is possible. Or as he puts it, “Educators can convey valuable information more effectively and efficiently if they know a few more things about how people think and learn.”
Aug 29, 2014 | Current Events, Innovative Methodology, National
Post developed by Katie Brown and Yuri Zhukov.
ICYMI (In Case You Missed It), the following work was presented at the 2014 Annual Meeting of the American Political Science Association (APSA). The presentation, titled “Measuring Rape Culture,” was a part of the Political Methodology theme panel “Big Data and the Analysis of Political Text” on Friday August 29th, 2014.
In August of 2012, two high school football players raped a young woman in Steubenville, Ohio. Instead of intervening, witnesses recorded the incident, posting photos and videos to social media sites. The social media trail eventually led to a widely publicized indictment and trial. Yet while the two teenagers were convicted of rape, coverage of the case nonetheless came under fire for perpetuating rape culture. News outlets displayed empathy for the rapists while blaming the victim.
When the media cover sexual assault and rape, empathizing with the accused and/or blaming the victim may send the message that rape is acceptable. This acceptance in turn could lead to an increase in sexual violence, with perpetrators operating with a perceived sense of impunity and victims remaining silent. Yet there exists no systematic study of the prevalence or effects of the media and rape culture.
Center for Political Studies (CPS) faculty associate and Assistant Professor of Political Science Yuri Zhukov, along with Matthew A. Baum and Dara Kay Cohen of Harvard University’s John F. Kennedy School of Government, are filling this gap with a systematic investigation of rape culture reporting in the news media through an analysis of 310,938 newspaper articles published between 2000 and 2014.
The authors first had to operationalize the concept of rape culture, to date a diffuse term. In addition to perpetrator empathy and victim blaming, the authors added implications of victim consent and questioning victim credibility as fundamental dimensions of the concept. The authors then broke down each of these four categories into more detailed content, resulting in 76 descriptors of rape culture. Trained coders analyzed a random subset of some 13,000 newspaper articles. Zhukov and his colleagues then used these manually coded articles to “train” a computer algorithm to detect rape culture in a previously unseen body of text. The algorithm then assigned each of 310,938 articles an overall score on a 6-point Rape Culture index, with higher scores corresponding to articles with more rape culture language.
While the study offers many provocative and important findings, we will focus on an innovative and startling result. The authors created a word cloud mapped onto the rape culture index.
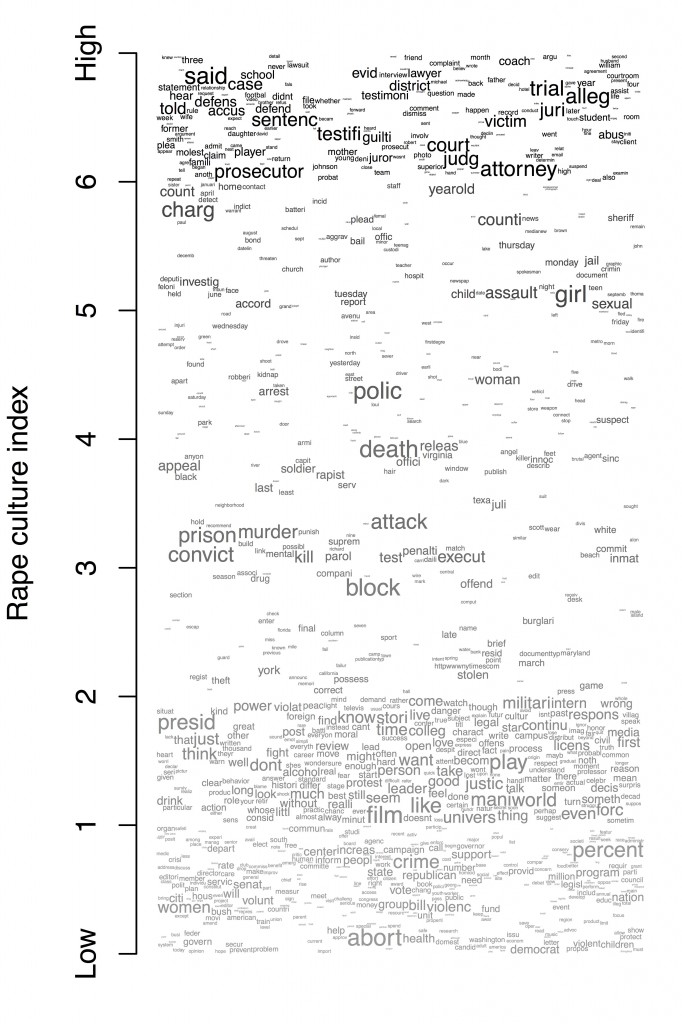
Articles with scores on the lower end of the index tended to discuss rape in the context of crime in general or domestic politics. Articles in the mid-range tended to discuss it in the context of that particular crime, the fate of the accused, and the response of law enforcement. Articles high on the index tended to be about court proceedings (and refer to the victim as “girl,” especially “young girl”) or to athletic institutions. Based on the word cloud graph, the authors conclude that: “Rape culture is less apparent in the initial stages of a case, when news stories are more focused on covering the facts of crimes,” and “Rape culture is strongest when individual cases reach the justice system.”
The authors find that rape culture is quite common in American print media: over half of all newspaper articles about rape revealed information that might compromise a victim’s privacy, and over a third contained language recognized by the algorithm as victim-blaming, empathetic toward the perpetrator, or both. Contrary to popular belief, preliminary findings suggest that rape culture does not depend on the strength of local religious beliefs, or local crime trends. However, the authors find a strong correlation with local politics and demographics: the higher the female share of the population where an article is published, the less likely that article is to contain rape culture language.
Aug 28, 2014 | Innovative Methodology, National, Social Policy
Post developed by Katie Brown and Nicholas Valentino.
ICYMI (In Case You Missed It), the following work was presented at the 2014 Annual Meeting of the American Political Science Association (APSA). The presentation, titled “The Attitudinal Structure and Political Consequences of Group Empathy,” was a part of panel “32-8. Race and Political Psychology” on Thursday August 28th, 2014.

Photo credit: ThinkStock
Group empathy is the ability to see through the eyes of another, to take their perspective and experience their emotions. The ability to experience empathy is adaptive in families and friendships. But how can we best measure empathy? And how do life experiences condition one’s ability to feel empathy?
Center for Political Studies (CPS) Research Professor and Professor of Political Science Nicholas Valentino, along with Cigdem Sirin-Villalobos and Jose Villalobos, both of the University of Texas, El Paso, seek to answer these questions. To do so, they conducted a survey with Knowledge Networks. The survey included 1,799 participants, of which 633 were White, 614 Black, and 552 Latino/a.
The authors contend that empathy is not just the ability to take another’s perspective, but the motivation to do so. To this end, they asked 14 questions to create a “Group Empathy Index” (GEI). Examples of the items included statements such as “The misfortunes of other racial or ethnic groups do not usually disturb me a great deal” and “I am often quite touched by things that I see happen to people due to their race or ethnicity.” They also asked about empathy toward specific groups. Analysis showed the new scale to be both reliable and valid.
In addition to better measuring empathy, the authors wanted to understand the role of related personal traits. They found that race, gender, and education condition empathy. In particular, being a minority or a woman, and having more education, are related to higher empathy. Further, personally experiencing unfair treatment by law enforcement also related to higher empathy. Minorities reported more unjust treatment by law enforcement, which might underlie the different levels of empathy by race.
The survey also included questions to gauge political implications of empathy. The study found that those who display higher empathy showed greater support for immigration, valued civil liberties more than societal security, and were more likely to volunteer and attend rallies. The authors concluded that, “Such variations in empathy felt toward social groups other than one’s own may thus have powerful political consequences.”
Jul 31, 2014 | Current Events, National
Post developed by Katie Brown and Cassandra Grafström
So-called “inflation truthers” – who claim that inflation is actually much higher than reported in the United States – have made recent news waves. Mainstream financial news organizations have debunked the charges of inflation truthers with the simple math of averages. But what if the truthers are just looking in the wrong place? That is, what if there is systematic bias not in reported inflation, but in projected inflation?
Enter the work of Cassandra Grafström, a Ph.D. candidate in the department of Political Science and affiliate of the Center for Political Studies (CPS). Grafström, along with Christopher Gandrud of the Hertie School of Governance, conducted research to trace potential partisan biases in inflation estimates.
In a paper which is forthcoming in Political Science Research and Methods, Gandrud and Grafström began with a widely accepted notion that under more liberal governments, the Federal Reserve tends to predict higher inflation. Why? Democratic administrations tend to try to lower unemployment, which causes higher inflation. Under more conservative governments, on the other hand, the Federal Reserve predicts lower inflation. Yet there exists little empirical support for these ideas. Instead, most work on inflation comes from the field of economics, with a focus on comparing federal predictions with money market predictions.
To test these commonly held ideas, Grafström and Gandrud looked at the Federal Reserve’s predictions across time. The authors took Presidential party and actual monetary and fiscal policies into account. They found that, regardless of actual monetary and fiscal policies, under more liberal presidents, the Federal Reserve over-estimates inflation while under more conservative presidents, the Federal Reserve under-estimates inflation.
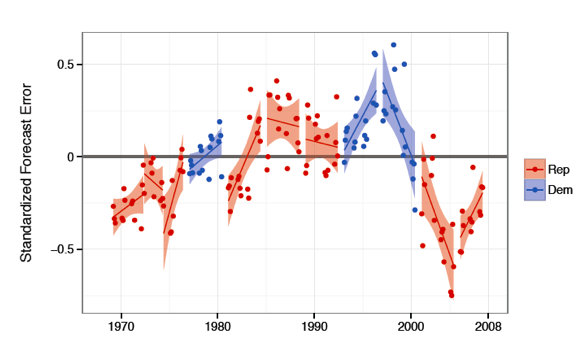
In the graph below, perfect predictions would create an error of 0. Points above the line correspond to over-estimation and points below the line correspond to under-estimation. The graph shows that when a Democrat is president, estimate errors tend to be above the line, while Republican errors tend to fall below the line.
Errors in Inflation Forecasts Across Time by Presidential Party
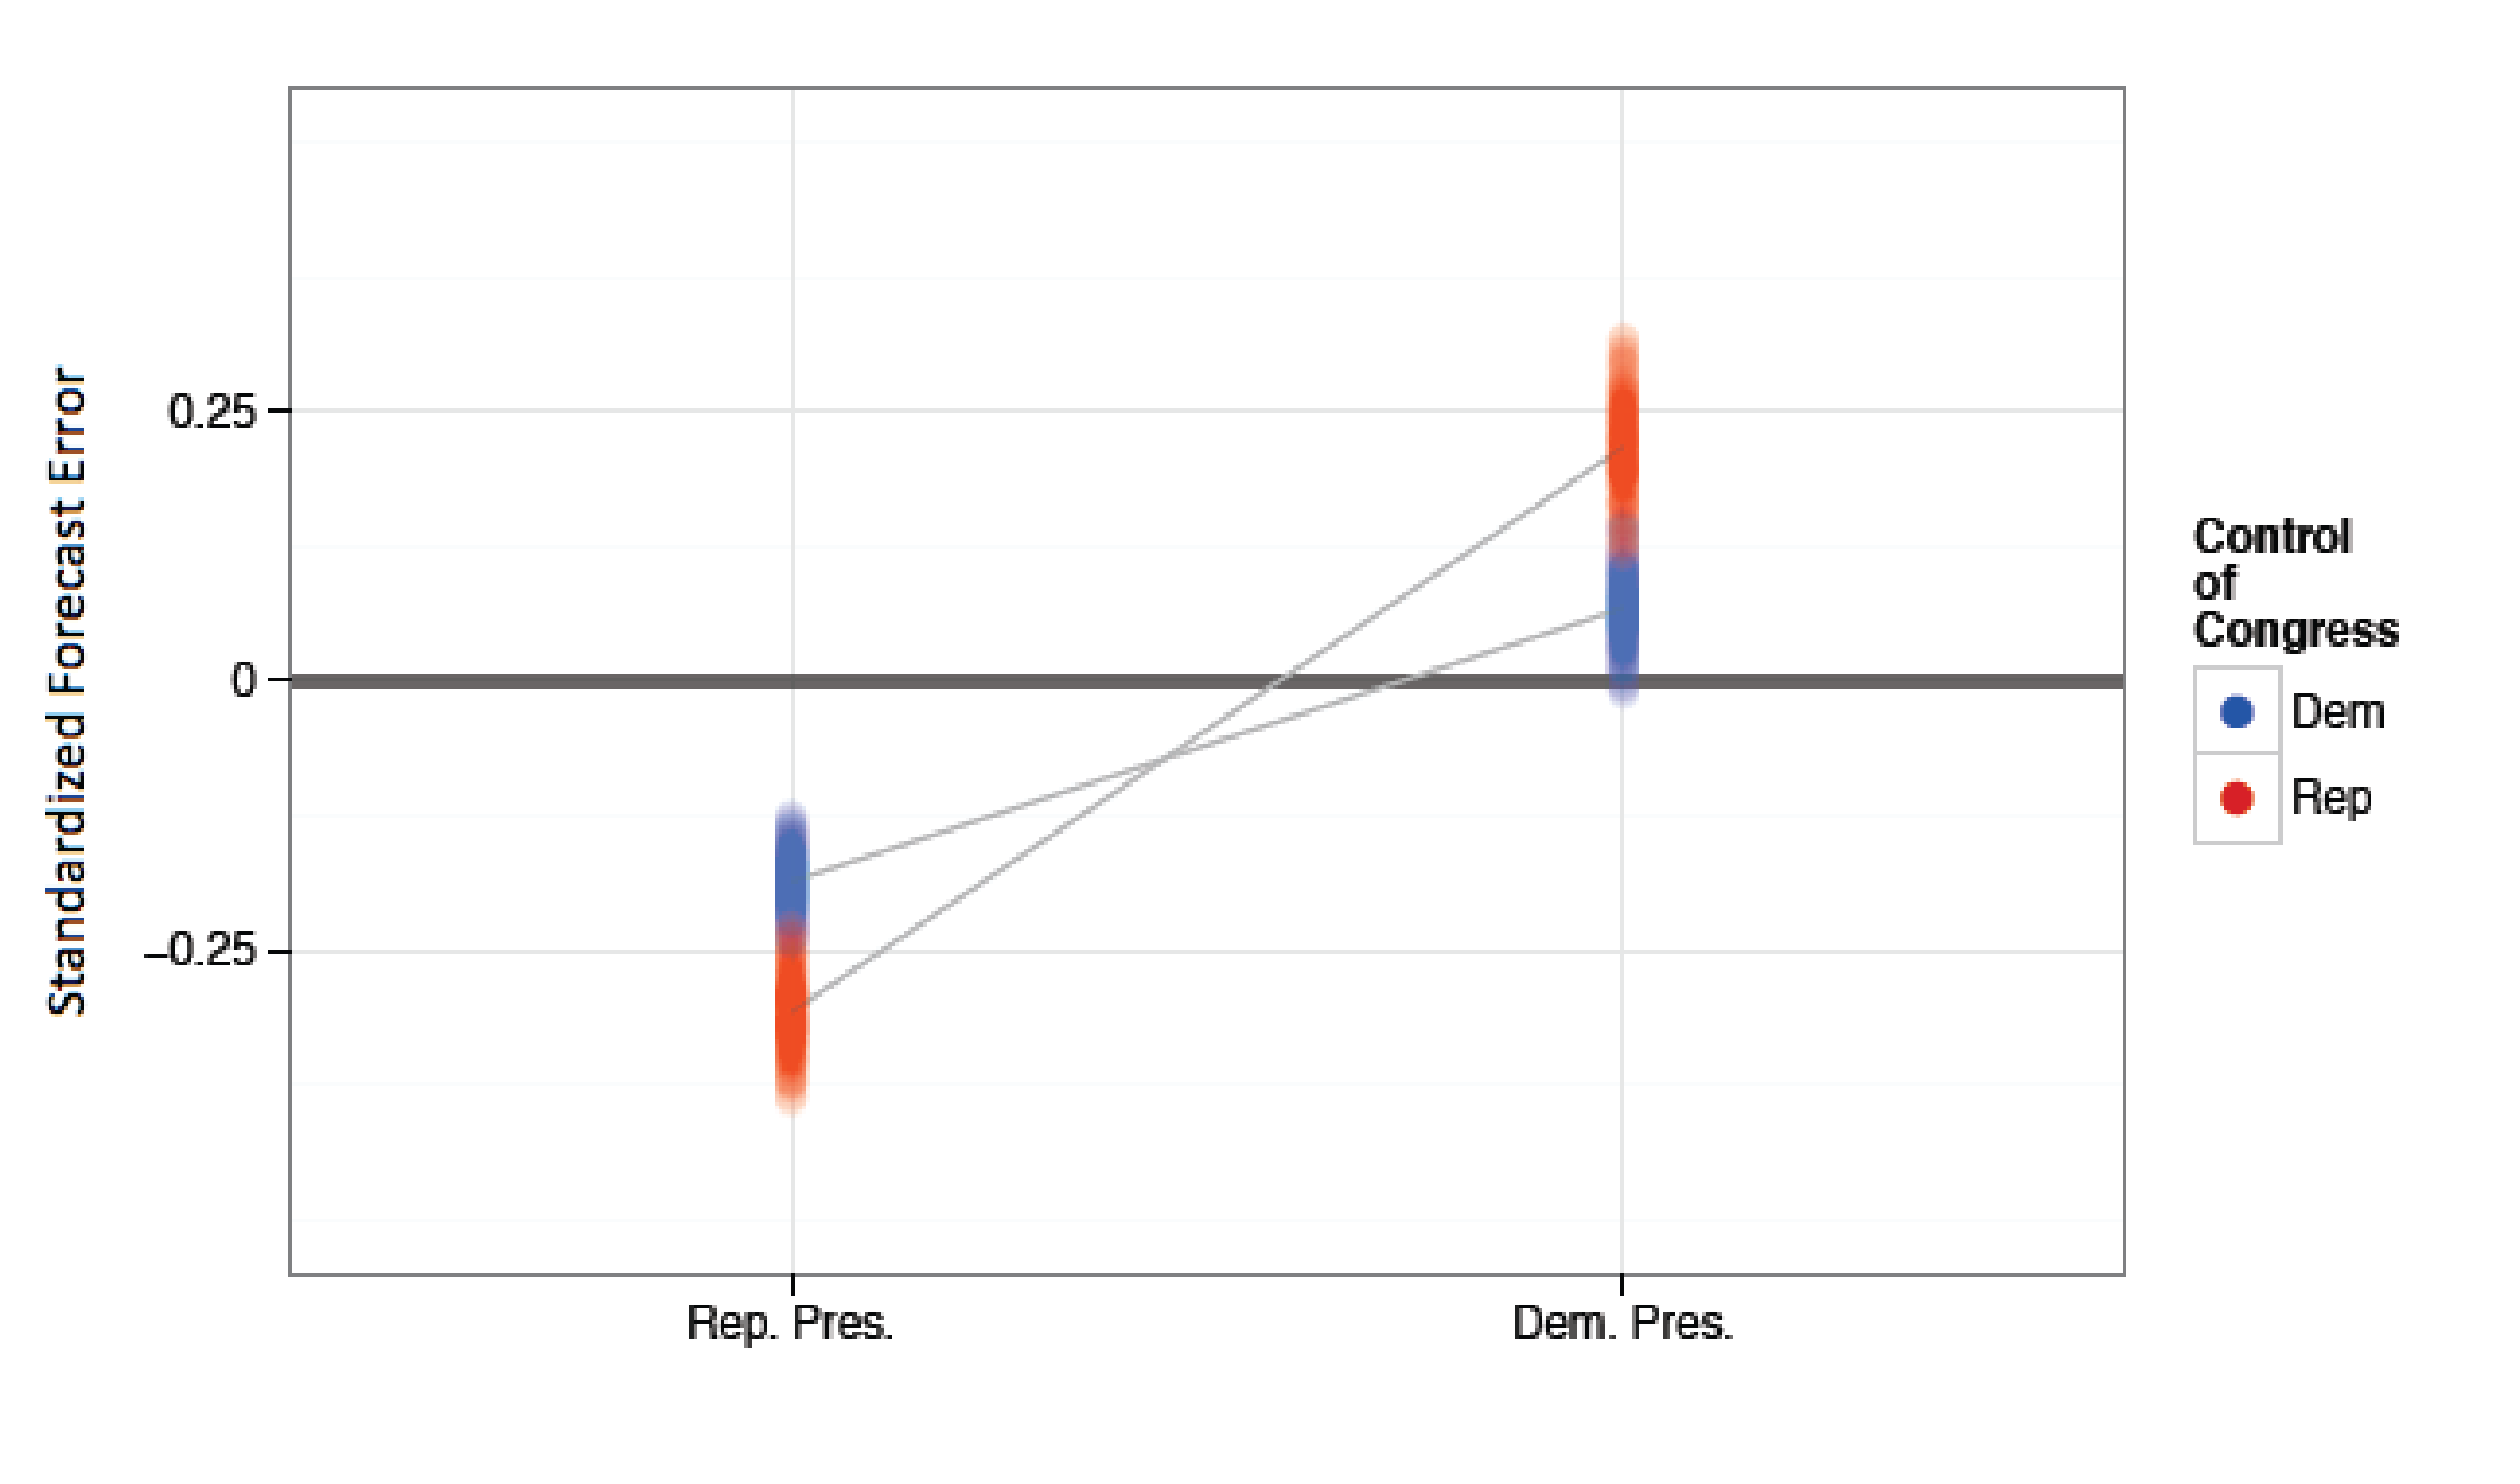
Grafström and Gandrud also wondered if control of Congress plays a role. To test this, they considered the joint influence of presidential party and the majority party in Congress. As the graph below shows, presidential party drives the trend. Interestingly, a Republican controlled Congress makes the original results stronger. That is, with a Democratic president and Republican Congress, there is greater over-estimation of inflation. Likewise, with a Republican president and Republican Congress, there is greater under-estimation of inflation. The graph below illustrates these findings (0 would again represent a match between predicted and actual inflation)
Errors in Inflation Forecasts Across Time by Presidential and Congress Majority Parties
Given the clear links between presidential partisanship and inflation forecasts, the authors worry that this likely translates into biased monetary and fiscal policies. That is, over-estimated inflation under Democratic presidents may lead to more restrictive monetary and fiscal policies. On the other hand, under-estimated inflation under Republican presidents may lead to more expansive monetary and fiscal policies. In both cases, the policy changes would be based on forecasts biased by flawed but accepted rules of thumb about inflation under Democrat vs. Republican presidents.