Dec 11, 2013 | Innovative Methodology, National
Developed by Katie Brown in coordination with John Garcia

Photo credit: Thinkstock
Center for Political Studies (CPS) and Inter-university Consortium for Political and Social Research (ICPSR) Researcher John Garcia studies this phenomenon. In a forthcoming paper, “Race as Lived Experience: The Impact of Multi-Dimensional Measures of Race/Ethnicity on the Self-Reported Health Status of Latinos,” Garcia – along with colleagues Gabriel R. Sanchez, Shannon Sanchez-Youngman, Edward D. Vargas, and Vickie D. Ybarra – develops a multiple dimensional model of race and tests its relation to health with American Latinos.
The authors measure race with a survey. The survey includes questions that consider three dimensions of race: ascribed race (or what people think others see as their race), skin color, and experience with discrimination. Garcia then combined these questions into a scale. Unlike other measures that consider race to be genetic or biological, Garcia’s scale approaches race as a socio-cultural construct. Race is typically captured through self-identification utilizing social identity theory. As the source is the individual, this assumes that one’s self identity is “derived” primarily or exclusively from the individual him/herself. The relational nature of racial identification can become muted or minimize the role of interactions, institutions and policies that affect race, status, and power relations. Garcia seeks to diversify this approach by creating and testing a new scale.
After creating the scale, the authors then interviewed 1,200 Latinos by phone. The survey also included questions about health.
Interestingly, the authors find a connection between the multiple dimensions of race and self-reported health. The darker the skin, the worse self-reported health. The graph below illustrates this trend.
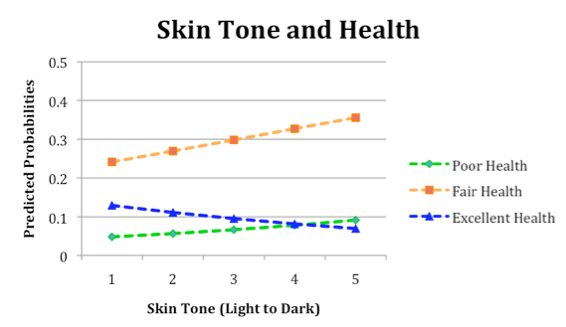
Likewise, health appears to deteriorate with more discrimination experiences. The graph below shows this finding.
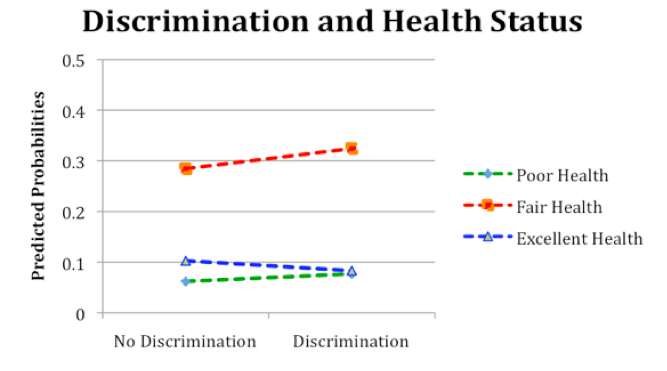
Ascribed race, on the other hand, was not related to self-reported health. But, when all three dimensions of race are combined into a single scale, then, the authors report,
“Latinos whose daily lives are more directly influenced by their race/ethnicity report poorer health than Latinos for whom race is not a central factor.”
These results are important for multiple reasons. A multi-dimensional approach to measuring race – like this one – is truer to lived experience. Furthermore, this approach offers more power to explain the societal injustices rooted in race, like relative health.
Dec 5, 2013 | CLEA, Innovative Methodology, International, National
Developed by Katie Brown and Jill Wittrock in coordination with David Backer, Allen Hicken, Kirill Kalinin, Ken Kollman, and Walter Mebane
Photo credit: Thinkstock
Voter fraud is an important problem, and it knows no geographical boundaries. In the last two months alone, allegations of voter fraud made the news. Some 1,000 citizens of Beit Shemish, Israel protested in demand of new elections amid evidence of foul play in an earlier vote. A Florida congressman’s former chief of staff was sentenced to prison for trying to rig an election. Similar stories also came out of Wisconsin, Texas, Michigan, Nebraska, Kansas, North Carolina, New York, Iowa, Egypt, Japan, and New Zealand, to name just a few from just the last few weeks.
Voter fraud is an important problem. When ballot results are viewed as corrupted by some process, elections have the potential to be destabilizing, and in extreme cases, can trigger violence and political regime change. For example, the suspicions surrounding the results of the 2007 Kenyan presidential election triggered large-scale turmoil, leading to more than 1,000 deaths. Observations from international election monitoring in 170 countries indicate 61% of countries experience some degree of cheating, including election fraud, with 27% countries in the sample exhibiting major fraud problems.
But how can we measure it? And how can we give election monitoring agencies the tools they need to pinpoint potential hotspots before an upcoming election? Researchers Walter Mebane and Kirill Kalinin at the University of Michigan have refined a set of tools that capture different aspects of potential election irregularities. Some of these methods are informed in part by techniques developed for detecting financial fraud: numbers changed by humans tend to have patterns that wouldn’t have occurred through the normal process of casting a ballot. Other methods derive from other mathematical regularities or feature simulations of what votes affected by fraud look like. Such methods have revealed fraud in recent elections in Russia, Iran, and Uganda. However, vast amounts of election returns are needed to conduct the data analysis, and many of the tests of election fraud have relied on precinct or polling station results, which can be difficult to get from governments, especially ones under suspicion of engaging in fraudulent behavior.
Enter the Constituency-Level Elections Archive (CLEA). Three of the co-directors of CLEA (Ken Kollman, Allen Hicken, and David Backer) are teaming up with Mebane and Kalinin to provide high quality and detailed constituency-level election results. Together the researchers are testing whether tools developed for detecting fraud using precinct results will also work at a higher level of aggregation, namely the district-level. CLEA provides cleaned and uniformly formatted results for elections around the world. Preliminary results from recent elections in Russia, Uganda, and Mexico suggest that different fraud detection techniques accurately estimate the probability of suspicious behavior at the district-level. For instance, in Russia, serious irregularities were widely alleged by both election monitors and Russian voters. Mebane and Kalinin found significant and substantial evidence of fraud using a range of fraud detection techniques, thus corroborating the firsthand account of monitoring organizations and Russian voters.
Next steps include applying these techniques to the remaining 1200+ elections in the archive with the end goal of providing baseline estimates of likely cases of fraud. Armed with this information, election monitoring organizations will have a sophisticated tool to complement their efforts at promoting free and fair elections. Over the short run, such results can assist monitors in focusing attention on problematic areas in specific countries, but in the long run, these detection techniques have the potential to deter those who wish to engage in election manipulation.
Nov 14, 2013 | ANES, Michigan, National, Social Policy
Post developed by Katie Brown.
In June of this year, the Supreme Court of the United States maintained the legality of affirmative action programs at American colleges and universities – for now. The Supreme Court’s seven-to-one decision pushes American colleges and universities to prove the utility of affirmative action programs. The court declined to rule specifically on a case regarding the University of Texas at Austin’s affirmative action policy. This week, the UT Austin case was debated before a federal court.
How does the American public feel about affirmative action, and has their support or opposition changed over time? The American National Election Studies (ANES) can be used to examine such trends. For 65 years, the ANES has interviewed a representative sample of voting age Americans on a variety of topics, including but not limited to voting and turnout, public policy support, societal values, and demographics. As ANES describes, the resulting data “inform the nation about itself.”
There are many ways to measure levels of support or opposition for affirmative action. Since 1992, ANES has asked the American voting age public whether it is “for or against” one type of affirmative action: preferential hiring and promotion of blacks. As the graph below illustrates, public opposition in the United States for this type of affirmative action appears both dominant and stable over the time period 1992-2012.
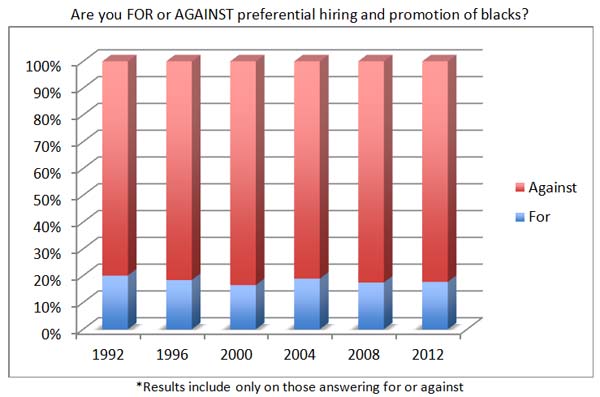
In 2012, ANES also asked a question about support or opposition for the use of quotas to admit black students to colleges and universities. The results were similar, with 77% of respondents opposing such a program and 23% of respondents being in support.
The latest Supreme Court ruling comes on the heels of a 2003 Supreme Court decision regarding the University of Michigan‘s use of affirmative action in its decision-making process for admitting students. The Court upheld the use of affirmative action by the University’s law school but negated the use of affirmative action in its undergraduate admissions. In 2006, voters from the state of Michigan voted in support of a ballot referendum, Proposition 2, which made affirmative action illegal in the state. Then in November of 2012, the state of Michigan’s 6th Circuit Court of Appeals overturned Proposition 2. Last month, the constitutionality of Proposition 2 went before the Supreme Court of the United States.
The latest court proceedings suggest that the future of affirmative action remains unclear, but results from the ANES suggest that public opposition to affirmative action remains stable. Yet, no single question or two can encapsulate feelings toward an issue as complex as this one.
Nov 5, 2013 | Elections, National
Developed by Katie Brown in coordination with Josh Pasek.
Photo credit: Thinkstock
American elections are traditionally held the first Tuesday in November. On this first Tuesday in November, we present a post on ballots in honor of elections.
Ballots list all candidates officially running for a given office so that voters can easily choose between them. But could the ordering of candidate names on a ballot change some voters’ choices? A new study by Center for Political Studies (CPS) Faculty Associate and Assistant Professor of Communication Josh Pasek suggests just such a possibility.
Pasek studies the impact of new media and psychological processes on political attitudes, public opinion, and political behavior. In a forthcoming paper – with Daniel Schneider, Jon Krosnick, Alexander Tahk, Eyal Ophir, and Claire Milligan – Pasek considers the effect of ballot ordering on election results.
The study uses data from all California elections between 1976 and 2006. California randomizes the order of candidate names on ballots by district, creating a natural chance to test this question.
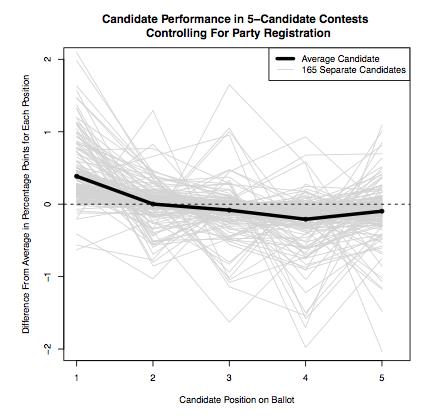
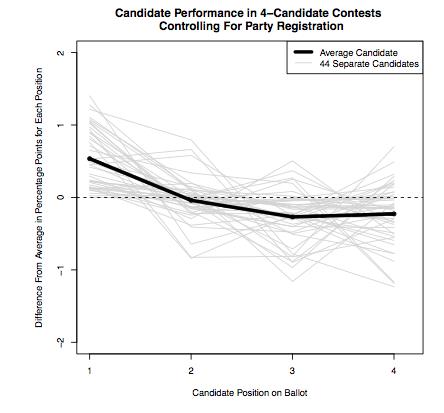
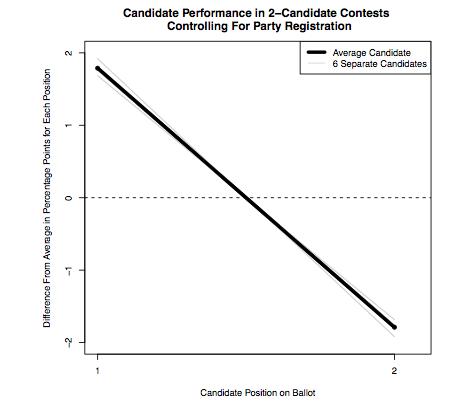
Pasek and his colleagues analyzed the data in a variety of ways. No matter the approach, candidates listed first on the ballot had a slight advantage. This effect was largest for races (1) with little publicity, (2) when more votes were cast, and (3) when there was a bigger win. These factors support the idea that name order may influence those with minimal information about or investment in the race.
The graphs at the bottom of this post show this advantage for contests with (a) five candidates, (b) four candidates, and (c) two candidates. The horizontal axis shows the position of each candidate on the ballot. The vertical axis shows how that candidate’s votes would be expected to change. As we can see, candidates tend to perform best when listed in the first position on the ballot and worse when listed farther down on the ballot, with the exception of the last spot on the ballot where there is a slight rebound.
Although the overall size of the effect is small, Pasek notes that the size of the effect is far greater than the margin of victory in many elections. For example, George W. Bush beat Al Gore by less than 0.009 percent (a few hundred votes out of six million cast) in Florida in the 2000 election for the President of the United States. Randomizing the order of names on a ballot may therefore be important for ensuring a fair, democratic process.
a.
b.
c.
Oct 31, 2013 | Michigan, National, Social Policy
Developed by Katie Brown in coordination with Rosemary Sarri

Photo credit: Thinkstock
In June of 2013, Sesame Street debuted its first character with a parent in prison. The Sesame Street website now features a page of video clips and guides to help children facing this situation. But how likely is it a child will see his or her parent go behind bars?
The U.S. has a high rate of incarceration, about 760 per 100,000. The rates are higher than peer countries – five times the rate of Britain, and eight times the rate of Germany. But are the rates even higher for families with criminal pasts?
Center for Political Studies (CPS), School of Social Work, and Women’s Studies Professor Emerita Rosemary Sarri studies social policy, with an emphasis on children in the justice system. In a paper just published with Irene Ng and Elizabeth Stoffregen in the Journal of Poverty, Sarri considers the intergenerational nature of incarceration.
The study grew from a larger effort to understand preparation of youth returning from detention to the community. Data analysis revealed high levels of parental imprisonment among the youth in the sample. So the researchers considered the issue in more depth.
The researchers broke their participants into three groups: low, medium, and high levels of parental incarceration. Then they performed a cluster analysis to determine if these three groups varied along different factors.
The results indicate that higher levels of parental incarceration correspond to negative life events, parental substance abuse, receiving federal assistant, placement in foster care, neighborhood quality and instability, stigma, and negative youth outcomes. The graph below displays four of these associations by level of parental incarceration.
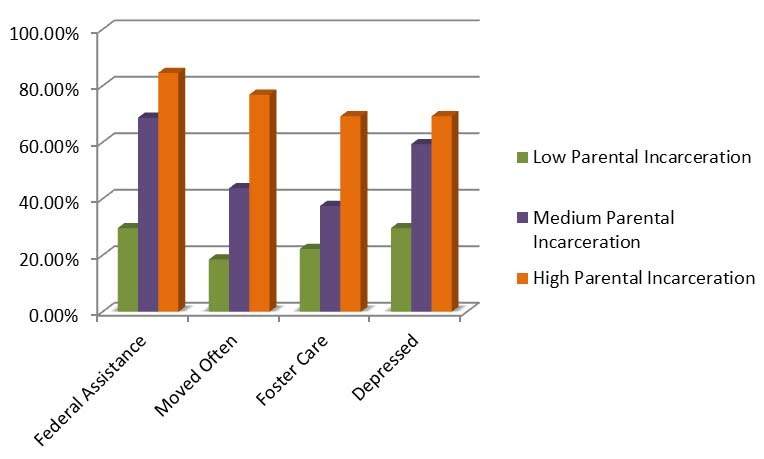
So having a parent in prison not only increases the risk of a child facing juvenile lock up, but is also associated with other negative experiences. The troubles appear to perpetuate along family trees. A staggering 53% of the juvenile offenders in the study have children themselves. Further, most of the male participants expected little future contact with their children.
It would be easy to be pessimistic given these results, but the results highlight a situation that needs to be addressed. In response, Sarri calls for a re-examination of imprisoning parents. She argues that these families and society at large could benefit from community programs that support families. Such community programs demonstrate long-term positive effects for both parents and children. When used for non-violent offenses, like drug abuse, such community programs protect public safety while potentially redirecting the growth of ill-fated family trees. Sarri also suggests parenting training, substance abuse and mental health treatment, workforce development, and community organization to relieve disorganization. These preventative services could help redirect families before there’s a problem.
Sep 23, 2013 | Elections, Innovative Methodology, National
Post developed by Katie Brown in coordination with Cara Wong.
The maps below show the same small city. The shaded area shows how residents delineate their community. The differences are notable. But do these internal maps impact how people make political decisions?
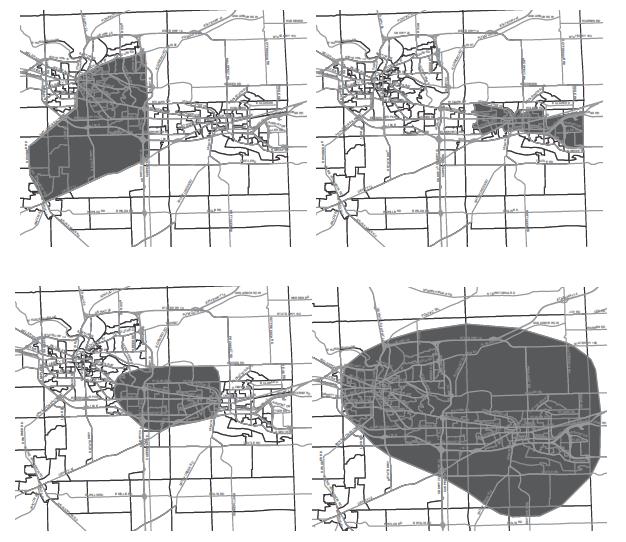
Center for Political Studies Adjunct Faculty Associate and University of Illinois Associate Professor of Political Science Cara Wong studies perceptions of communities and how this impacts policy support. With colleagues Jake Bowers and Tarah Foster Williams of the University of Illinois, and Katherine Drake Simmons of the Pew Research Center, Wong published a paper in the Journal of Politics that considers how these mental maps relate to policy support.
In the study, participants were shown a map of the blocks surrounding their home and a map of their county, and asked to highlight their local community on either. Two thirds focused on the block maps, while one third shaded communities on the county maps. The size highlighted ranged from smaller than a block to larger than two cities. Some participants even highlighted non-contiguous areas.
Then, the participants were asked to describe the demographics of the area they highlighted. Questions included the proportion of blacks and whites, Democrats and Republicans, and unemployed. Next, they were asked about their take on these factors in the United States in general. Results show that participants view their communities and the United States at large as having more blacks (15% more on average) and fewer whites than the census. Unemployment and racial distortions are bigger than partisan distortions. All three are distorted to some extent across the block, community, and country levels.
The highlighted areas varied between participants. Their internal maps of their communities also differ from how the government creates administrative boundaries. But to what effect?
These discrepancies can play out in the voting booth and in day to day {day-to-day} behaviors. As Wong et al. explain:
The ‘fear of crime’ literature in sociology has explained that personal and altruistic fear—regardless of accuracy—leads to purchases (e.g., guns), behavioral changes (e.g., not going out at night), and abandonment of locations (e.g., parks and industrial areas). Political scientists need to understand whether perceptions of community heterogeneity and interracial competition have equally serious consequences for political actions and outcomes.