Of 987 individuals killed by police officers’ use of fatal force in 2018, 209 were black, and, of those, 200 were black men. The targeting and killing of unarmed black men has become a point of interest for news cycles and social movement organizations alike and is indicative of a fraught relationship between communities of color and police. With increasing press coverage over the past decade, academics have also begun to focus on the intertwining relationship between police use of force and race, complementing a long-standing literature which links blacks to perceptions of criminality, violence, and hostility. One area that is not well-developed, however, is how news coverage of police shootings influences attitudes towards police and policies related to policing for white Americans.
Building from research on race, media coverage, and policing, new research by Nicole Yadon and Kiela Crabtree examines reactions to police and policing by white people after they read about a police officer shooting a white man, a black man, or a dog. They find that news reports about police shootings change attitudes about police, but the strength of the reaction varies depending on who the victim is.
Specifically, Yadon and Crabtree’s study examines white individuals’ feelings towards police following exposure to news of a fatal police shooting. They designed a survey that presents participants with a fictional but realistic news report about a fatal police shooting. In one version the shooting victim is a black man, another reports that the victim is a white man, and in the third version the victim is a dog. Key information about the shooting remains the same across all three versions. A control story, unrelated to race or police shootings, was given to a control group for purposes of comparison with the three treatment groups. This experiment was conducted via Amazon’s Mechanical Turk (MTurk) platform, with 802 white participants. After reading one of the news reports, participants were asked a series of questions about their perceptions of the events in the article and about their attitudes towards police more broadly.
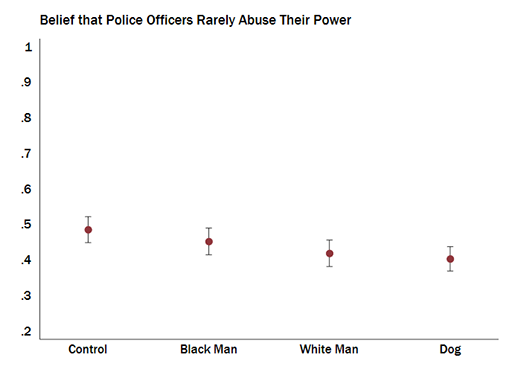
When asked whether they agree or disagree that police officers rarely abuse their power, the control group who had not read about a police shooting had a neutral response — about 0.49 on the 0 to 1 scale. Respondents who read about a white man or a dog being shot by police had a markedly different reaction. Participants who read an article about a white man shot by police had a 7 percentage point decrease in belief that police rarely abuse their power while those who read about a dog shot by a police officer had an 8 percentage point decrease. This is equivalent to survey respondents moving from feeling neutral about whether police abuse their power to a slight disagreement that abuse of power is rare after reading about either a White victim or dog victim.
Importantly, when white survey participants read about a black victim of a police shooting, it did not change their perception of abuse of power by police officers. Put differently, those who read about a black victim held views abuse police abuse of power that were indistinguishable from those who read the control story. The evidence suggests, then, that white respondents react more strongly to a police shooting if the victim is a dog than a black man.
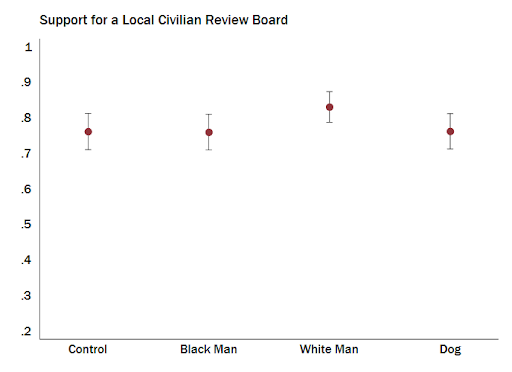
A separate set of questions focused on interest in varying forms of political participation following exposure to the news story. Do white people feel moved toward political participation in response to a story about a police shooting? First, the survey asked whether respondents would support a civilian review board to oversee the police department in their community. Those who read about a police officer shooting a black man or a dog were no more likely to support a civilian review board than the control group. However, those who read about the shooting of a white man were more than 7 percentage points likely to support civilian review in their community.
A second question asked about interest in signing a petition urging Congress to take action towards reducing excessive use of force by police. In contrast to the civilian review board question, levels of support for signing a petition were very low across all groups. In fact, white participants do not appear increasingly motivated to urge Congress to take action against excessive police force regardless of the victim’s identity.
Taken together, Yadon and Crabtree’s results suggest that exposure to a news story about a police shooting draws strong reactions from white people. Of concern, however, is that such reactions are largely limited to viewing either a white man or a dog victim. Indeed, across most of the items which measure attitudes towards police, there are no statistically significant differences when comparing the control condition with the black victim treatment. Such connections are increasingly important to study as cities move toward tightening oversight of police forces and many such initiatives are presented to citizens at the ballot box. Thus, the attitudes citizens hold about police are not only their own. The public’s opinion has potentially lasting effects for the future of policing in local communities.
Post developed by Katherine Pearson and Diana Mutz
Foreign trade is a complex issue, but the public still has strong opinions about the issue. Diana Mutz demonstrated that social psychology can help to understand attitudes about trade when she delivered the 2019 Miller Converse lecture. A recording of her talk “Winners and Losers: The Psychology of Attitudes Toward Foreign Trade” is available below.
Most people rely on small-scale social experiences to understand large-scale interactions such as international trade. From this understanding, people tend to embrace beliefs about trade that are not necessarily accurate. For example, folk beliefs suggest that impersonal transactions are more dangerous than personal ones, that trade is zero-sum, and that trade “deficits” mean that a country is losing more jobs as a result of imports than it gains due to exports. These beliefs are inaccurate, yet understandable, generalizations from the world of face-to-face social exchange.
Contrary to popular wisdom, trade preferences do not reflect people’s economic self-interest. Mutz demonstrates that, surprisingly, these attitudes are not influenced by a person’s occupation, industry of employment, community job loss, geographic location, or individual job loss. Instead, perceptions of what is in the collective economic interest determine attitudes toward trade. Coverage of trade in the media has a large influence on these perceptions. Media coverage of foreign trade was mostly negative until 2016. As media coverage of trade has become more balanced since 2016, support for trade has also increased.
Politicians from all parties have been unwilling to champion trade when running for office because foreign trade is seen as a political liability in the United States. As the world economy changes, Mutz asserts that leaders will need to advocate for trade and for safeguards against its negative effects. She cautions that it’s unhelpful to leave the public out of that conversation altogether as has been common in the past.
For an additional perspective, Mutz compares attitudes about trade in the United States and Canada. She finds that attitudes about trade in the two countries are different due to differing attitudes toward competition. Americans value competition more, and believe in the fairness of unequal outcomes. In the U.S., nationalism reduces support for foreign trade, but in Canada the opposite is true. Canadians who hold the strongest beliefs about national superiority want to promote more trade and immigration.
Differing perspectives on trade in these countries can be explained by variation in two different types of ingroup favoritism. First, Americans in Mutz’s studies systematically preferred trade agreements in which their fellow Americans benefited more than trading partners. In fact, there was no level of job benefits to foreign countries that would justify the loss of even a single American job. This was not the case among Canadians. In addition, Americans demonstrated their competitive attitudes toward trade by demonstrating greater support for trade agreements that not only benefit their country but also disadvantage the trading partner. Canadians, in contrast, preferred the kind of “win-win” trade agreement that economists suggest benefits all countries involved.
Attitudes about race drive attitudes about trade and Mutz finds that the reverse may also be true. In a study that asked respondents to select which students should be admitted to college, participants who had just watched an ad against foreign trade were less supportive of admitting Asian-American students, as well as students from Asia.
Mutz concludes that, while many of these results are distressing, attitudes remain malleable. Efforts to change opinions toward trade that emphasize similarity and shared values are more effective than efforts emphasizing pocketbook gains. Since 2016, her data shows that there has been an increase in support for foreign trade and a realization that it comes with benefits as well as negative consequences.
The cultural and political divide in America receives considerable media and scholarly attention. Republicans and Democrats have different preferences for everyday things like cars and drinks – most people are familiar with stereotypes of latte-drinking liberals or truck-loving conservatives. These differences even extend to their children’s names, the places they live, and the amount they give to charity.
The authors of this paper took a closer look at the extent to which non-political objects, activities, and places are associated with partisanship and ideology. Participants in the study were first prompted to list objects and activities they associate with either liberalism or conservatism. Following this open-ended question, respondents were asked to rate a list of 26 objects and activities based on ideology or partisanship.
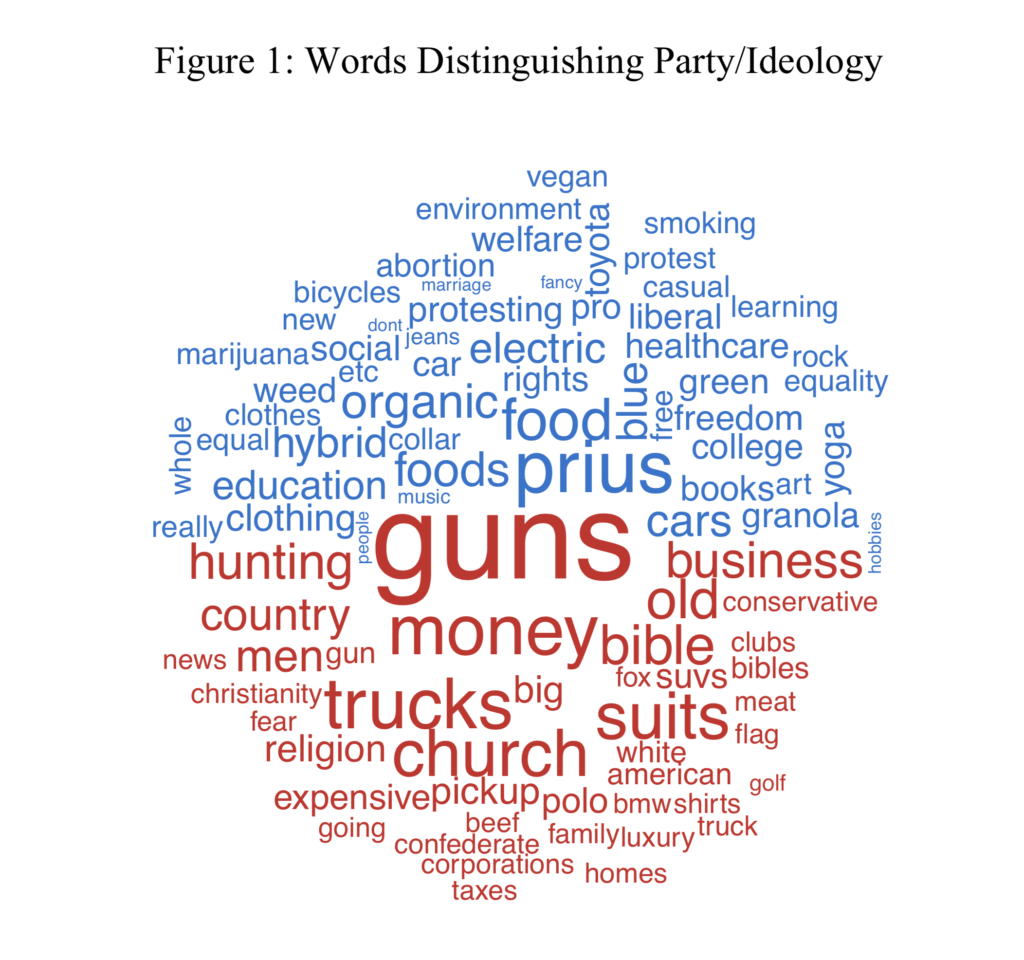
The results of the open-ended question are illustrated in the figure below, which shows the words most strongly associated with Democrats (blue) and Republicans (red). The figure makes clear the ease which which respondents name objects and activities often associated with the two partisan groups.
Hiaeshutter-Rice, D., Neuner, F., Soroka, S. 2019, “Divided by Culture: Partisan Imagery and Political Evaluations”, paper presented to the 77th Annual MPSA Conference, Chicago, IL, April 4-7, 2019.
In subsequent studies, the authors examined respondents’ reactions to a series of photos of political candidates standing in front of different backgrounds, including a NASCAR race, an organic food store, and a shooting range. Not all treatments made a difference, but the shooting range (and another image of a gun shop) in particular affected the way that respondents perceived the candidates’ ideology and policy proposal.
As more politicians use social media to share images of their campaigns, it is essential to be aware of the ways in which voters evaluate candidates. Nonverbal political communication conveys information that can help shape public opinion and political behavior. Will voters be manipulated by objects and scenery in political messages? The authors suggest that even as respondents can attach partisanship to wide range of non-political activities, their candidate-photo experiment finds only limited effects of hypothetical press-conference backgrounds. They conclude on a comforting note: “The fact that voters are readily able to attach partisanship to objects and activities, but yet barely take this information into account when rating candidates and policies, may be good news for representative democracy.”
White conservatives who not only have racial animus but are also knowledgeable about politics were the most likely group to believe that former President Barack Obama was not born in the United States, according to a University of Michigan Institute for Social Research study.
Michael Traugott and Ashley Jardina
The study, published in the Journal of Race, Ethnicity and Politics, teased out motivations of white voters for believing the so-called birther rumor. It found that white conservatives who ranked as having a high amount of knowledge were most likely to support the idea that Obama was not born in the U.S.
“This is a piece of social science research about biased perceptions in the political world and what their consequences might be,” said the study’s co-author Michael Traugott, a researcher at the Center for Political Studies at ISR. “It’s relevant because the whole concept of fake news is about devaluing information that doesn’t conform to either what you believe or what you want other people to believe, therefore suggesting a basis upon which it can be discounted or thrown away.”
Traugott and co-author Ashley Jardina, a former U-M doctoral student and now an assistant professor of political science at Duke University, say politically knowledgeable conservatives may be more likely to believe the rumor because they may follow what’s called a “motivated reasoning model.”
“One of the most interesting things about the motivated reasoning model is that the more resources the person has—which could be political information—the better they are able to argue against new information that doesn’t fit their worldview,” said Traugott.
Traugott and Jardina explored a portrait of a birther among white Americans using data from the 2012 American National Election Study. The ANES, conducted in person among a nationally representative sample of respondents, asked several questions assessing belief in contemporary conspiracy theories.
As recently as 2017, nearly a third of U.S. adults believed it was possible Obama was born outside the U.S., according to the researchers.
The survey also assessed participants’ knowledge by asking them to identify the office held by several political figures. A respondent’s score on the scale was the proportion of correctly answered questions.
The researchers found that 62 percent of very strong Republicans reported that Obama was born in the U.S. compared to 89 percent of very strong Democrats. Thirty-eight percent of very strong Republicans reported that Obama was probably born in another country, while 11 percent of very strong Democrats reported the same.
To estimate the impact of racial attitudes on the birther rumor, the researchers compared two conspiracy theories detailed in the 2012 ANES survey: the Obama birther rumor and the existence of the Affordable Care Act “death panels,” or, the idea that the ACA authorized government panels to make end-of-life decisions for people on Medicare.
Additionally, the researchers found:
Strong Republicans with higher levels of racial animus are more inclined to believe the birther rumor, but not the death panel rumor.
Republicans both low on resentment and low on knowledge are also more inclined to believe the birther rumor.
Democrats with higher levels of racial resentment are not significantly inclined to adopt either rumor.
Democrats low on knowledge and high on resentment are more likely to adopt birther beliefs.
High-knowledge Democrats with high levels of racial resentment are less likely to believe the rumor.
“Until recently, the relationship of party identification to things like voting behavior had weakened, but it has strengthened again,” Traugott said. “We expected partisanship would play a role in attitudes about Barack Obama, and because he was an African American, racial attitudes would play a role as well. These things are now increasingly important because of this kind of tribalism that’s infecting contemporary politics.”
Elections experts Ken Goldstein, Walter Mebane, and Vincent Hutchings analyzed the results and key lessons of the 2018 Midterm Elections at a round table discussion hosted by the Center for Political Studies on November 13, 2018. A recording of the event is available below.
Ken Goldstein, Professor of Politics at the University of San Francisco
Ken Goldstein began his presentation by noting that there are still races that do not have a clear winner a week after the election, including the Senate and Governor’s races in Florida and the Governor’s race in Georgia.
Leading up to the Midterm Elections, some observers anticipated big wins for the Democratic Party. Goldstein observed that while there was a general lack of exuberance on the part of Democrats on election night, further reflection reveals that there were meaningful shifts in this election. Although the “blue wave” of Democratic wins didn’t materialize, the number of congressional seats changing away from the President’s party was of similar magnitude to past midterm elections.
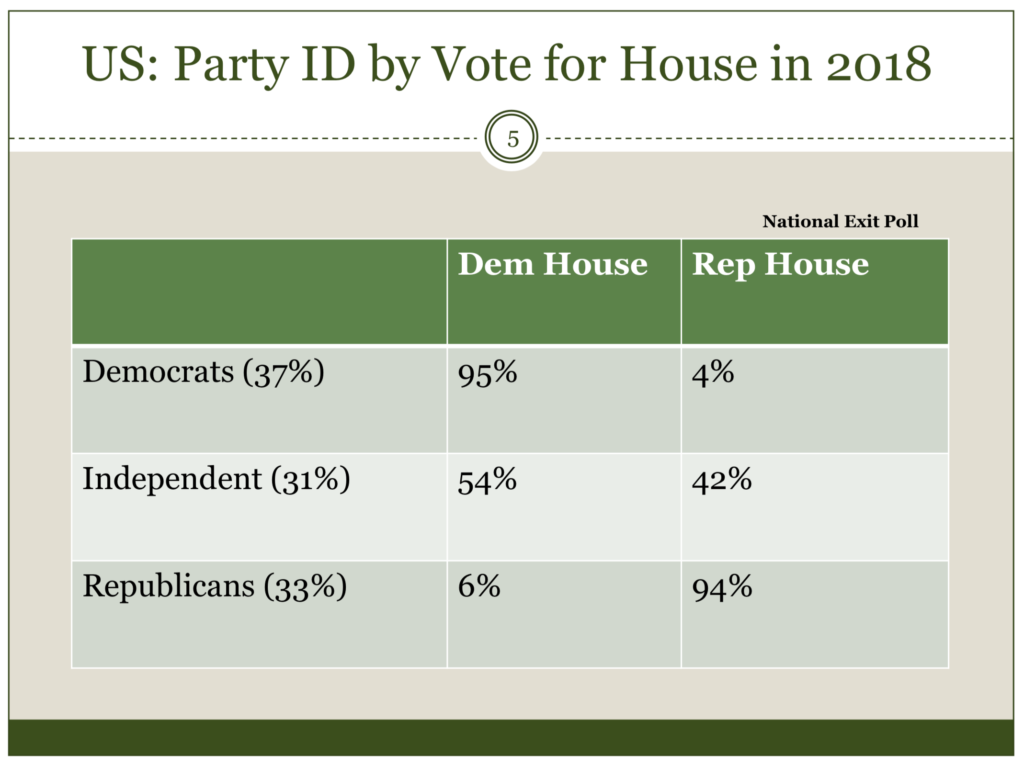
Goldstein drew attention to the behavior of independent voters. Exit poll data show that independents favored Republican candidates for the House of Representatives in the past two midterm elections, as well as the 2016 General Election. In contrast, independent voters were more likely to vote for Democratic House candidates in 2018 by a margin of 12 percentage points.
Were the polls leading up to the election predictive of the actual outcome? Goldstein said they were fairly accurate, but reminded the audience that many congressional seats were not in play in this election. There are few high-quality state-level polls, which makes forecasting less accurate. More probability-based surveys that weight responses for education and race of the respondent would improve the accuracy of predictions.
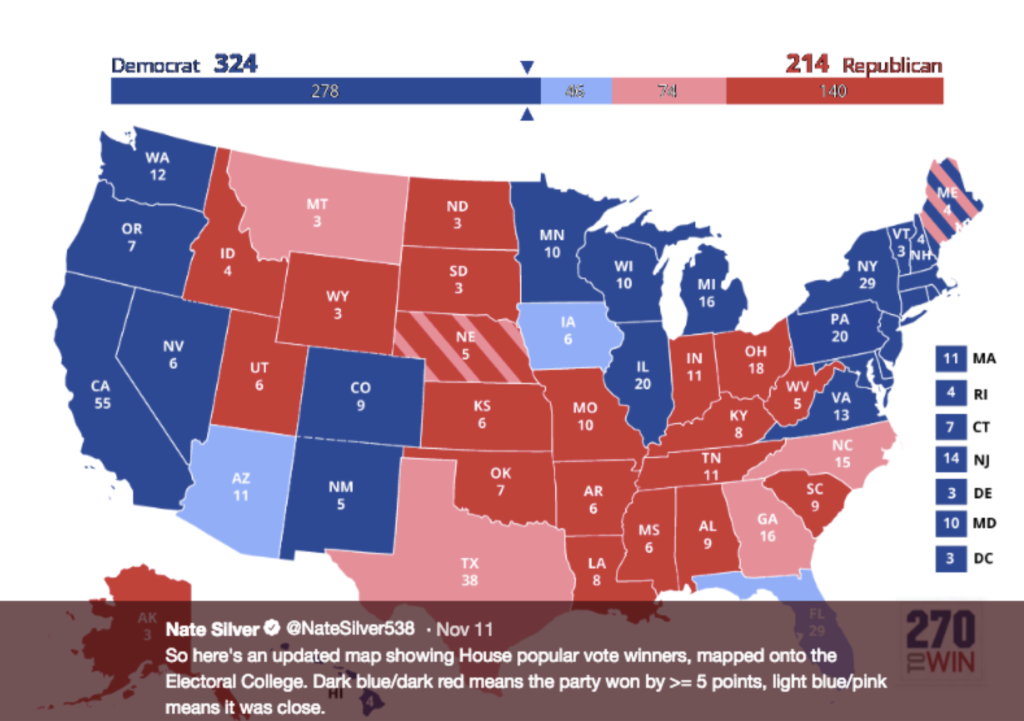
Looking at the big picture trends, Goldstein observed that there was a substantial increase in the number of women running for office and winning, as well as large increases in non-white voters. He shared a map showing what the results of the presidential election would look if votes followed the same partisan break-down as the 2018 midterms. However, Goldstein cautioned that presidential campaigns are very different from congressional campaigns, and that a presidential candidate running a nation-wide campaign will face challenges in changing districts, especially in the Midwest.
Walter Mebane, Professor of Political Science and Statistics at the University of Michigan
Next, Walter Mebane presented analyses he has conducted using election forensics. Mebane coined the term “election forensics” to describe a set of statistical methods he developed to determine whether the results of an election accurately reflect the intentions of the electors.
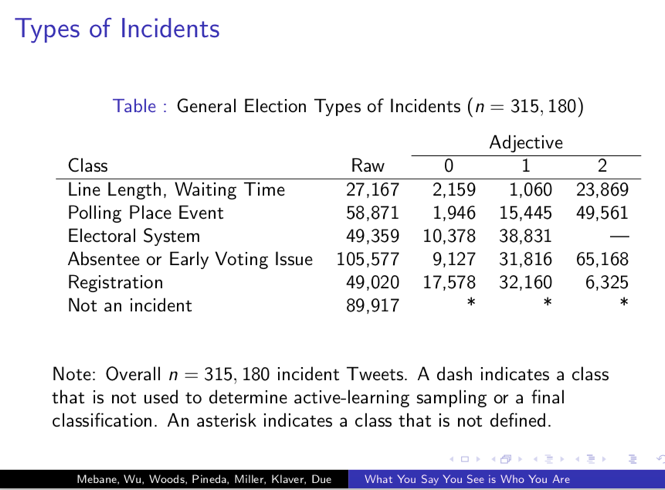
Using Twitter data from the 2016 General Election Mebane analyzed reports of election incidents, including wait times and problems with voting. During the 2016 General Election people used Twitter to report different kinds of election incidents depending on their partisan affiliation. These incidents tended to be reported in replies to people with similar partisan affiliations.
Mebane discovered that there are partisan differences in the types of incidents that Twitter users shared during the 2016 General Election. For example, Republicans were less likely to report a long line to vote, but more likely to report registration problems. A significant conclusion from this finding is that such observational biases and communication silos suggest partisans tended to form different impressions of how the 2016 election went, supported by the divergent reported experiences. These patterns will probably continue in 2018, according to Mebane.
Vincent Hutchings, Professor of Political Science at the University of Michigan
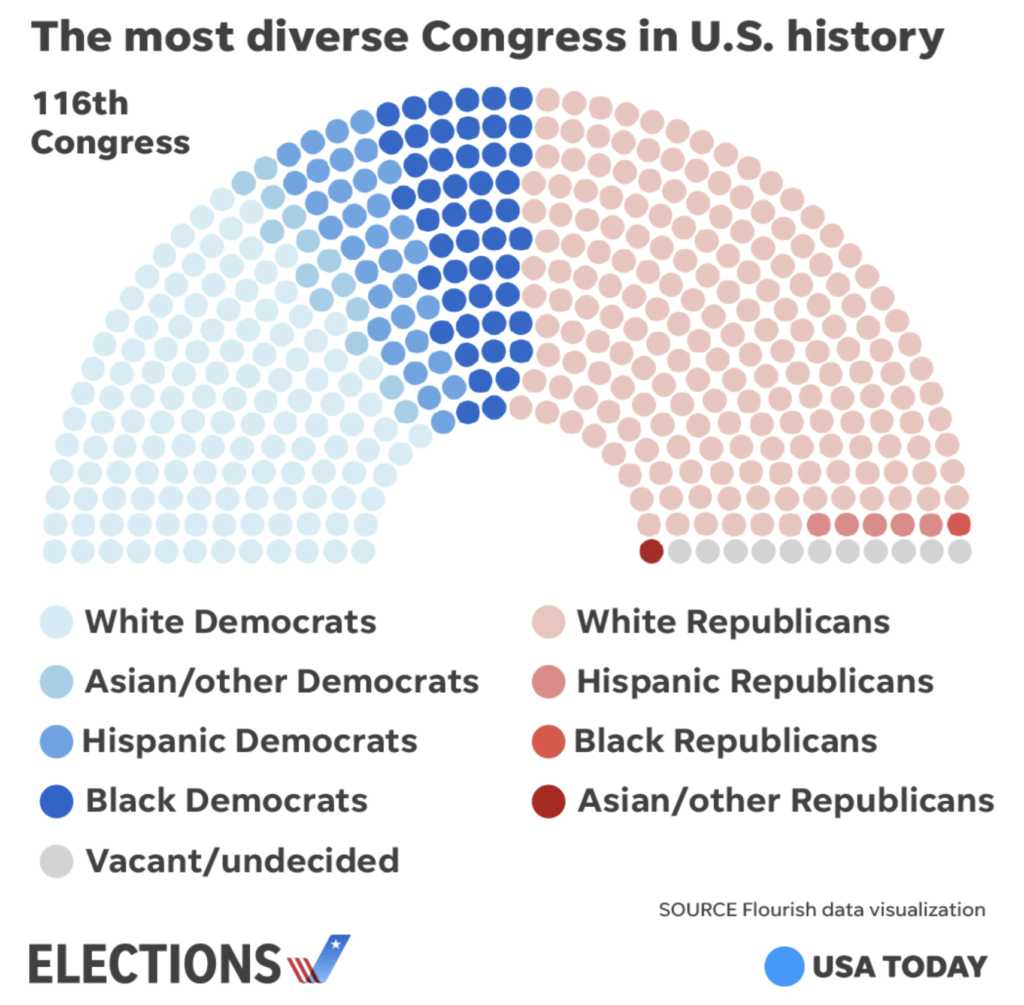
Vincent Hutchings analyzed the shifting demographics of the American electorate. Hutchings presented data showing that Democratic voters have become more racially diverse in the past 20 years, while Republican voters have remained predominately white. Similarly, the Congress elected in 2018 is the most diverse in the history of the United States, but the increase in diversity has been primarily among Democrats elected to Congress.
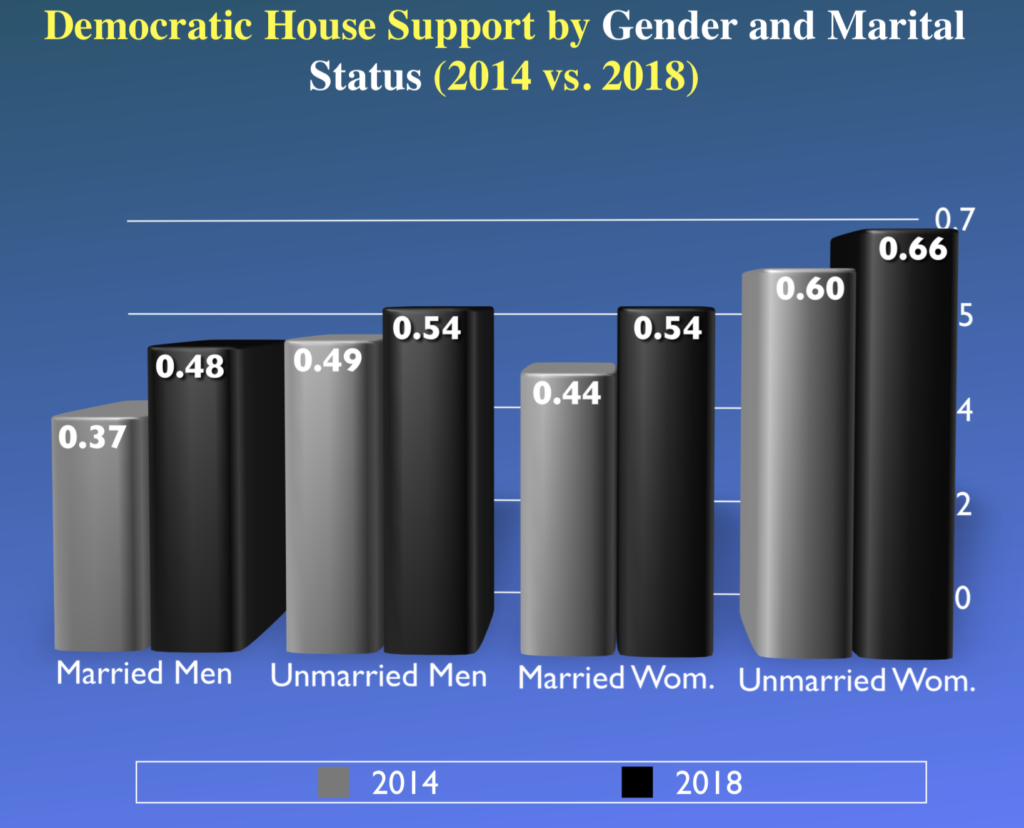
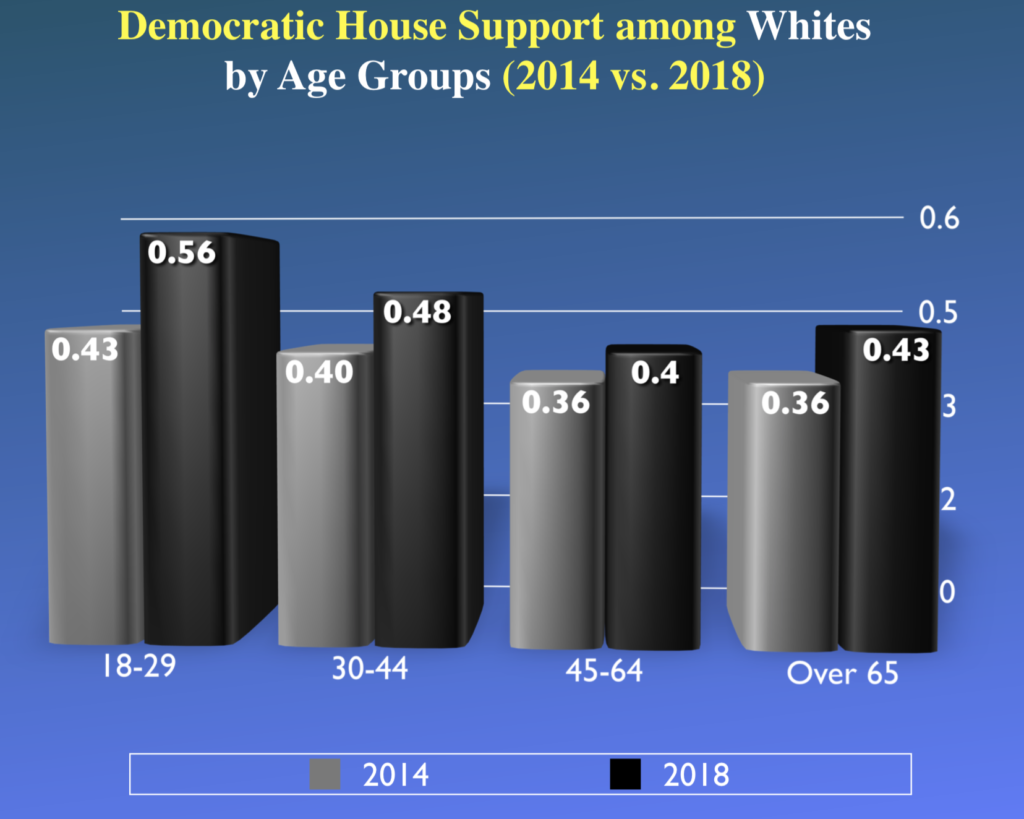
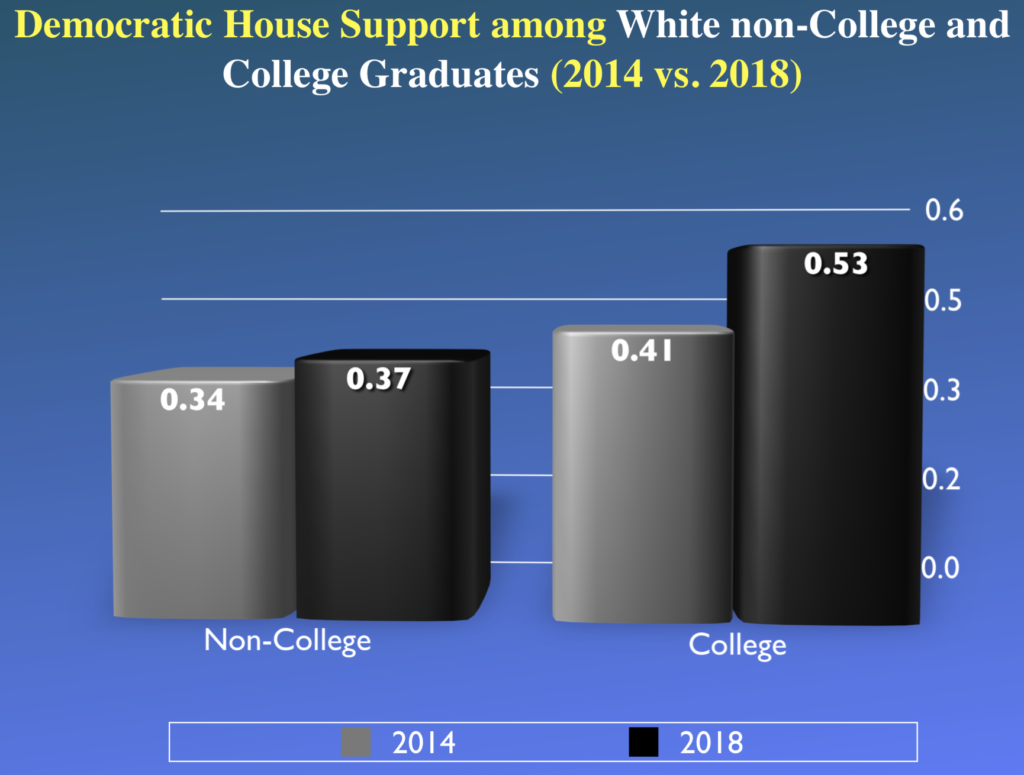
Reviewing voting data by race, gender, age, marital status, and education, Hutchings notes that each demographic group voted for Democrats at a higher rate than they did in the 2014 Midterm Elections. However, the magnitude of change was different for each group.
Some elections experts wondered whether women would vote for Democrats at higher rates in 2018 in response to the #MeToo movement, the contentious confirmation of Justice Kavanaugh, and controversial remarks about women made by President Trump. Hutchings showed that, among white voters, men and women both shifted toward Democratic candidates, but the gender gap didn’t change. Married men and married women both moved toward the Democratic Party House candidates at roughly equal rates in 2018 compared to 2014. No matter how Hutchings examined gender, he found no evidence that white women behaved differently than comparable men, relative to their preferences four years ago.
Similarly, Hutchings observed meaningful trends related to generation and education. Voters under 30 years old voted for Democrats at a higher rate than voters under 30 in 2014. Democrats also increased gains among college-educated white voters compared to the 2014 Midterm Elections. Hutchings concluded that, while media may focus on gender differences between Democratic and Republican voters, more important differences are emerging along generational and educational lines, and these are trends to watch
“Gerrymandering”— when legislative maps are drawn to the advantage of one party over the other during redistricting—received its name in 1812, when Massachusetts Governor Elbridge Gerry signed off on a misshapen district that was said to resemble a salamander, which a newspaper dubbed a “gerrymander.”
But although the idea of gerrymandering has been around for a while, proving that a state’s legislature has deliberately skewed district lines to benefit one political party remains challenging.
The problem is that the mere presence of partisan bias in a district map tells us very little about the intentions of those drawing the districts. Factors such as racial segregation, housing and labor markets, and transportation infrastructure can lead to areas where one party’s supporters are more geographically clustered than those of the other party. When this happens, the party with a more concentrated support base achieves a smaller seat share because it racks up large numbers of “surplus” votes in the districts it wins, while falling just short of the winning threshold in many of the districts it loses.
Further, there are many benign reasons that legislatures may seek to redistrict voters—for example, to keep communities of interest together and facilitate the representation of minorities—that may have the unintended consequence of adding a partisan spin to the map.
The research of political scientists Jowei Chen and Jonathan Rodden is helping to differentiate cases of deliberate partisan gerrymandering from other redistricting efforts. Chen, Faculty Associate at the University of Michigan’s Center for Political Studies, and Rodden, Professor of Political Science at Stanford University, have devised a computer algorithm that ignores all partisan and racial considerations when drawing districts, and instead creates thousands of alternative district maps based on traditional districting goals, such as equalizing population, maximizing geographic compactness, and preserving county and municipal boundaries. These simulated maps are then compared against the district map that has been called into question to assess whether partisan goals motivated the legislature to deviate from traditional districting criteria.
We first wrote about Chen and Rodden’s work back in December 2016, detailing a 2015 paper in the Election Law Journal, which used the controversial 2012 Florida Congressional map to show how their approach can demonstrate and unconstitutional partisan gerrymander. Now, this work is back in the spotlight: Chen’s latest research has been cited in several cases of alleged gerrymandering that are currently working through the courts in Pennsylvania, North Carolina, Wisconsin and Maryland.
In January, Chen’s testimony as an expert witness was cited when the Pennsylvania Supreme Court threw out the state’s U.S. House of Representatives district map. In its opinion, the court said the Pennsylvania map unconstitutionally put partisan interests above other line-drawing criteria, such as eliminating municipal and county divisions.
The Pennsylvania districts in question were drawn by the Republican-controlled General Assembly in 2011. Immediately, the shape of the districts was an indicator that at least one traditional criterion of districting—compactness—had been overlooked.
Though few states define exactly what compactness means, it is generally taken to mean that all the voters within a district should live near one another, and that the boundaries of the district should be create a regular shape, rather than the sprawling polygon with donut holes or tentacles that characterized the Pennsylvania district map.
In particular, District 7—said to resemble Goofy kicking Donald Duck—had been called into question. “It is difficult to imagine how a district as roschachian and sprawling, which is contiguous in two locations only by virtue of a medical facility and a seafood/steakhouse, respectively, might plausibly be referred to as compact,” the court wrote.
Although there are more registered Democrats than Republicans in Pennsylvania, Democrats hold only five of the state’s 18 congressional districts. In the 2016 election, Democrats won each of their five House seats with an average of 75 percent of the vote while Republicans’ margin of victory was an average of 62 percent across their 13 districts. This is an indicator of “packing,” a gerrymandering practice that concentrates like-minded voters into as few districts as possible to deny them representation across districts.
Chen’s expert report assessed the district map and carried out simulations to generate alternative districting plans that strictly followed non-partisan, traditional districting criteria, and then measured the extent to which the current district map deviates from these simulated plans.
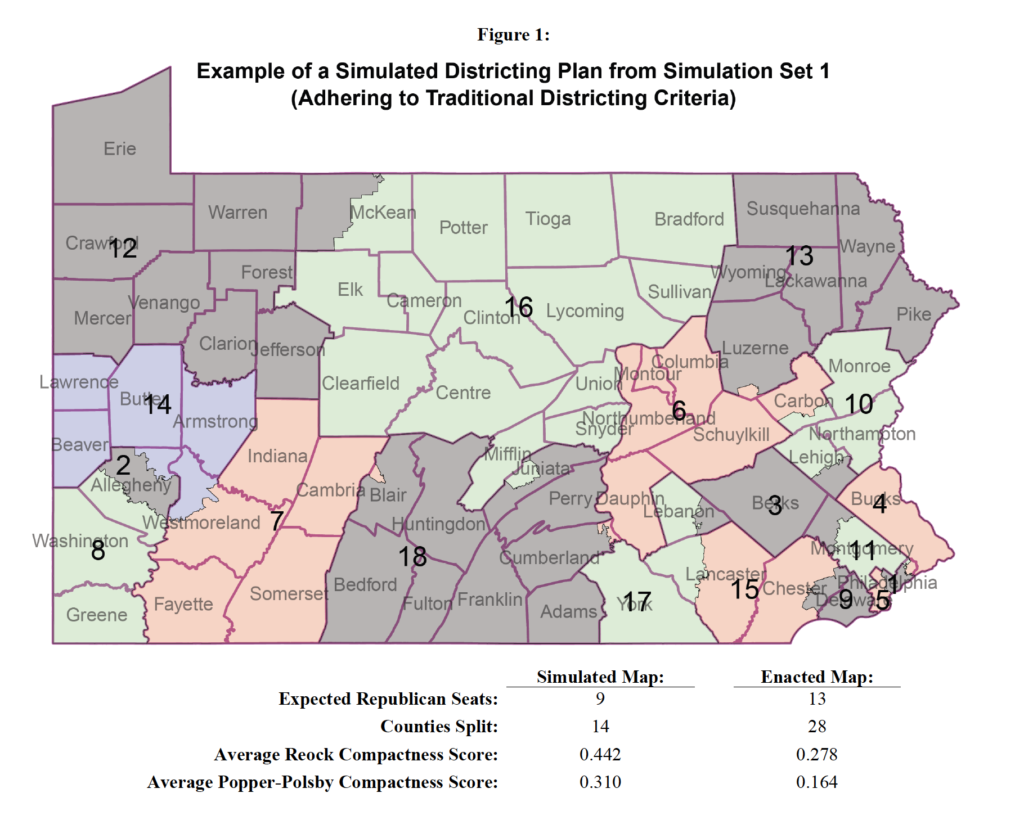
To measure the partisanship of the computer-simulated plans, Chen overlaid actual Pennsylvania election results from the past ten years onto the simulated districts, and calculated the number of districts that would have been won by Democrats and Republicans under each plan (see Figure 1).
The districting simulation process used precisely the same Census geographies and population data that the General Assembly used in creating congressional districts. In this way, the simulations were able to account for any geographical clustering of voters; if the population patterns of Pennsylvania voters naturally favor one party over the other, the simulated plans would capture that inherent bias.
Generally, the simulations created seven to ten Republican districts; not one of the 500 simulated districting plans created 13 Republican districts, as exists under the Republican-drawn district map. Thus, the map represented an extreme statistical outlier, a strong indication that the enacted plan was drawn with an overriding partisan intent to favor that political party. This led Chen to conclude “with overwhelmingly high statistical certainty that the enacted plan created a pro-Republican partisan outcome that would never have been possible under a districting process adhering to non-partisan traditional criteria.”
This table compares the simulated plans to the 2011 Pennsylvania district map with respect to these various districting criteria.
Following its ruling, on February 20 the Pennsylvania Supreme Court released a new congressional district map that has been described in a Washington Post analysis as “much more compact”. In response, the state’s Republican leadership announced plans to challenge the new map in court.